| Tissue | Expression Dynamics | Abbreviation |
| Cervix | 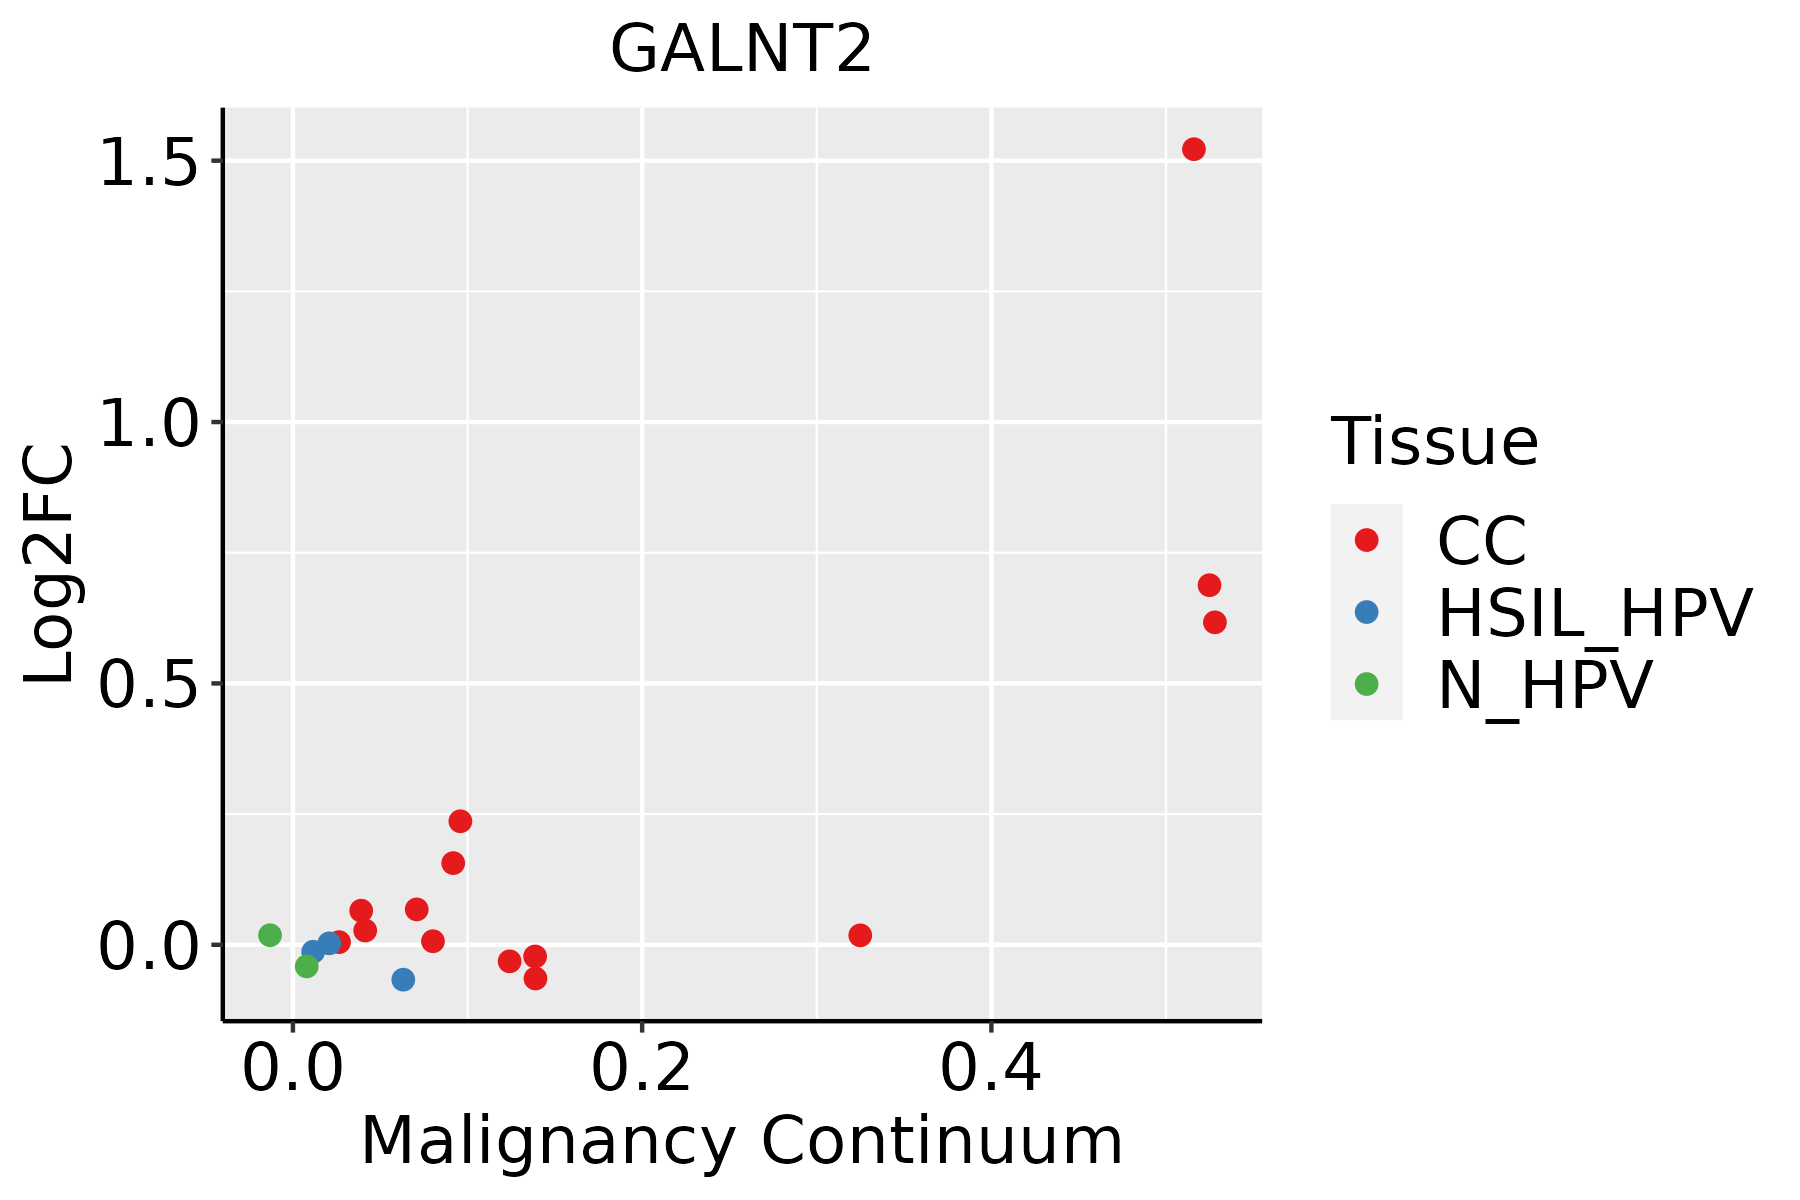 | CC: Cervix cancer |
| HSIL_HPV: HPV-infected high-grade squamous intraepithelial lesions |
| N_HPV: HPV-infected normal cervix |
| Endometrium | 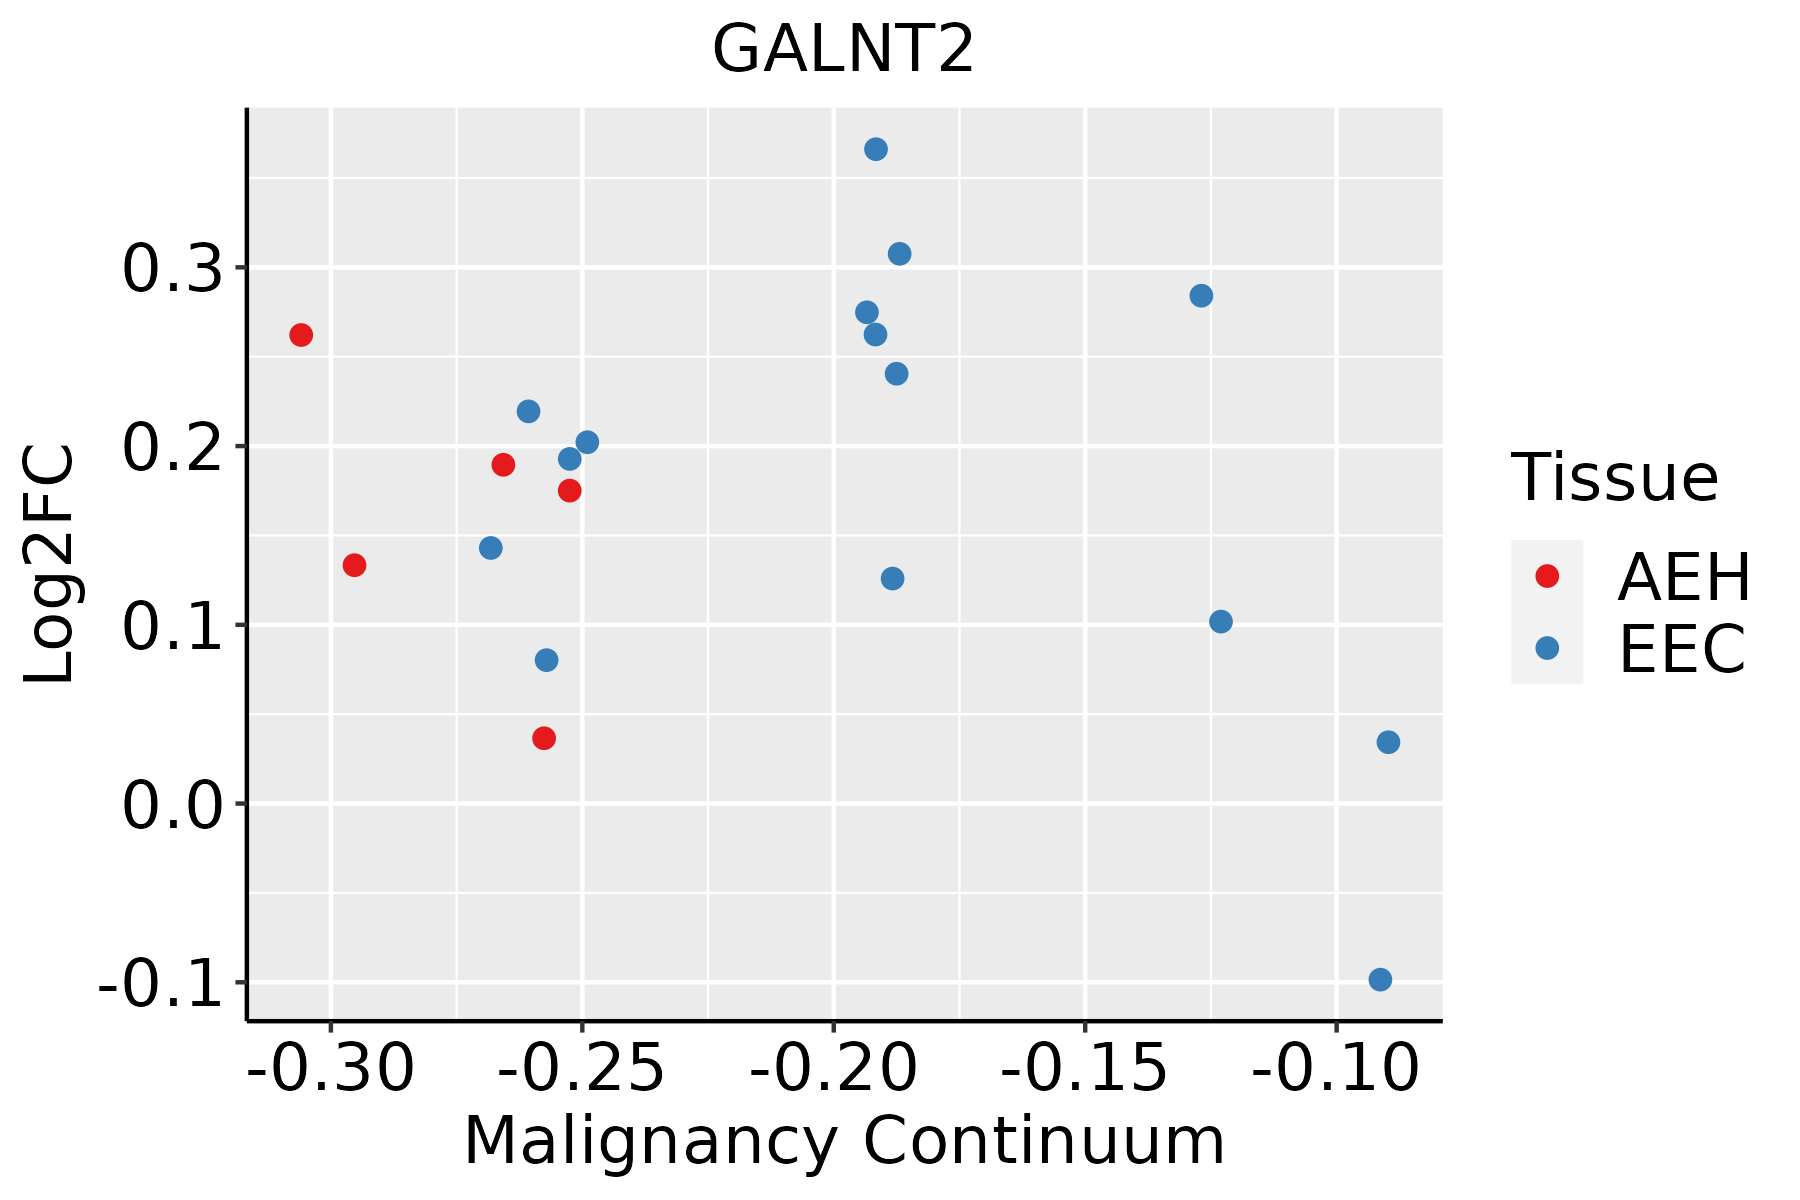 | AEH: Atypical endometrial hyperplasia |
| EEC: Endometrioid Cancer |
| Esophagus |  | ESCC: Esophageal squamous cell carcinoma |
| HGIN: High-grade intraepithelial neoplasias |
| LGIN: Low-grade intraepithelial neoplasias |
| Liver | 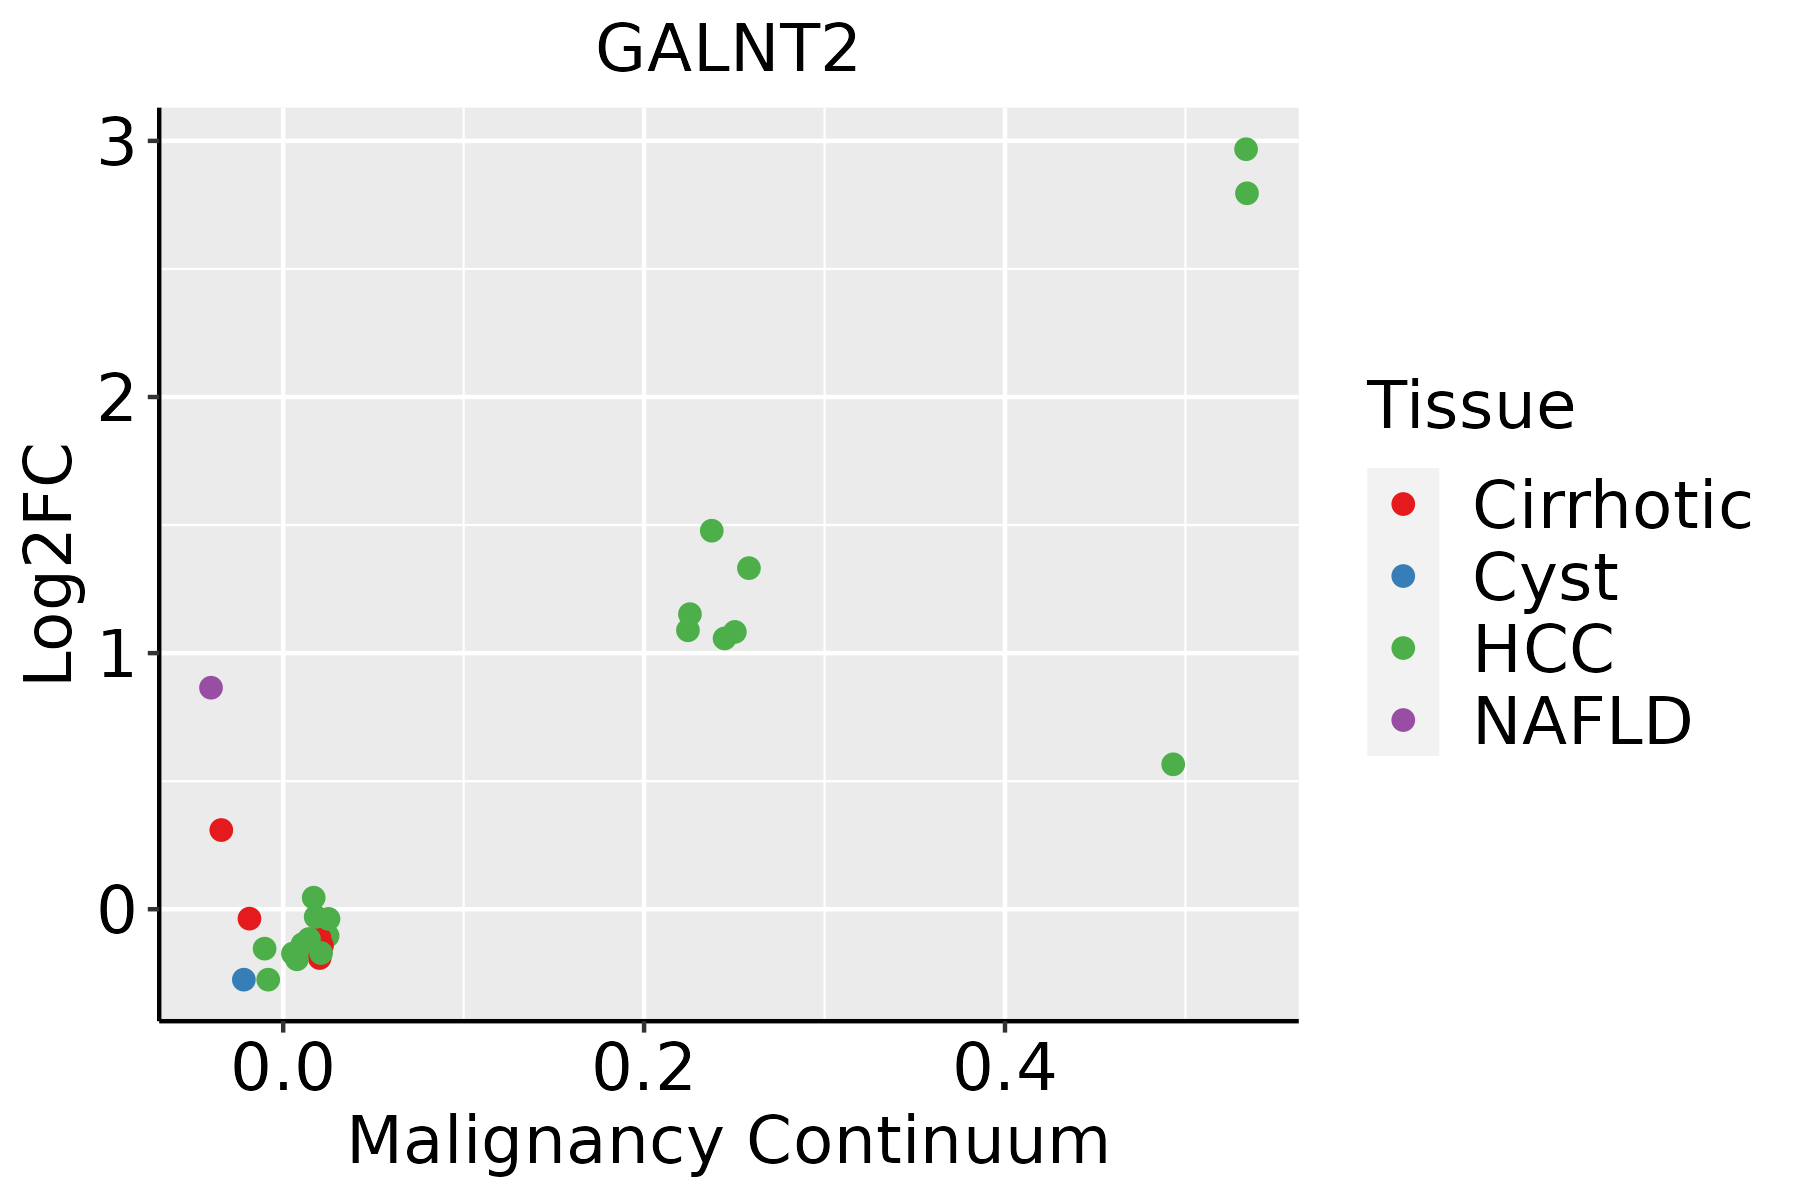 | HCC: Hepatocellular carcinoma |
| NAFLD: Non-alcoholic fatty liver disease |
| Lung | 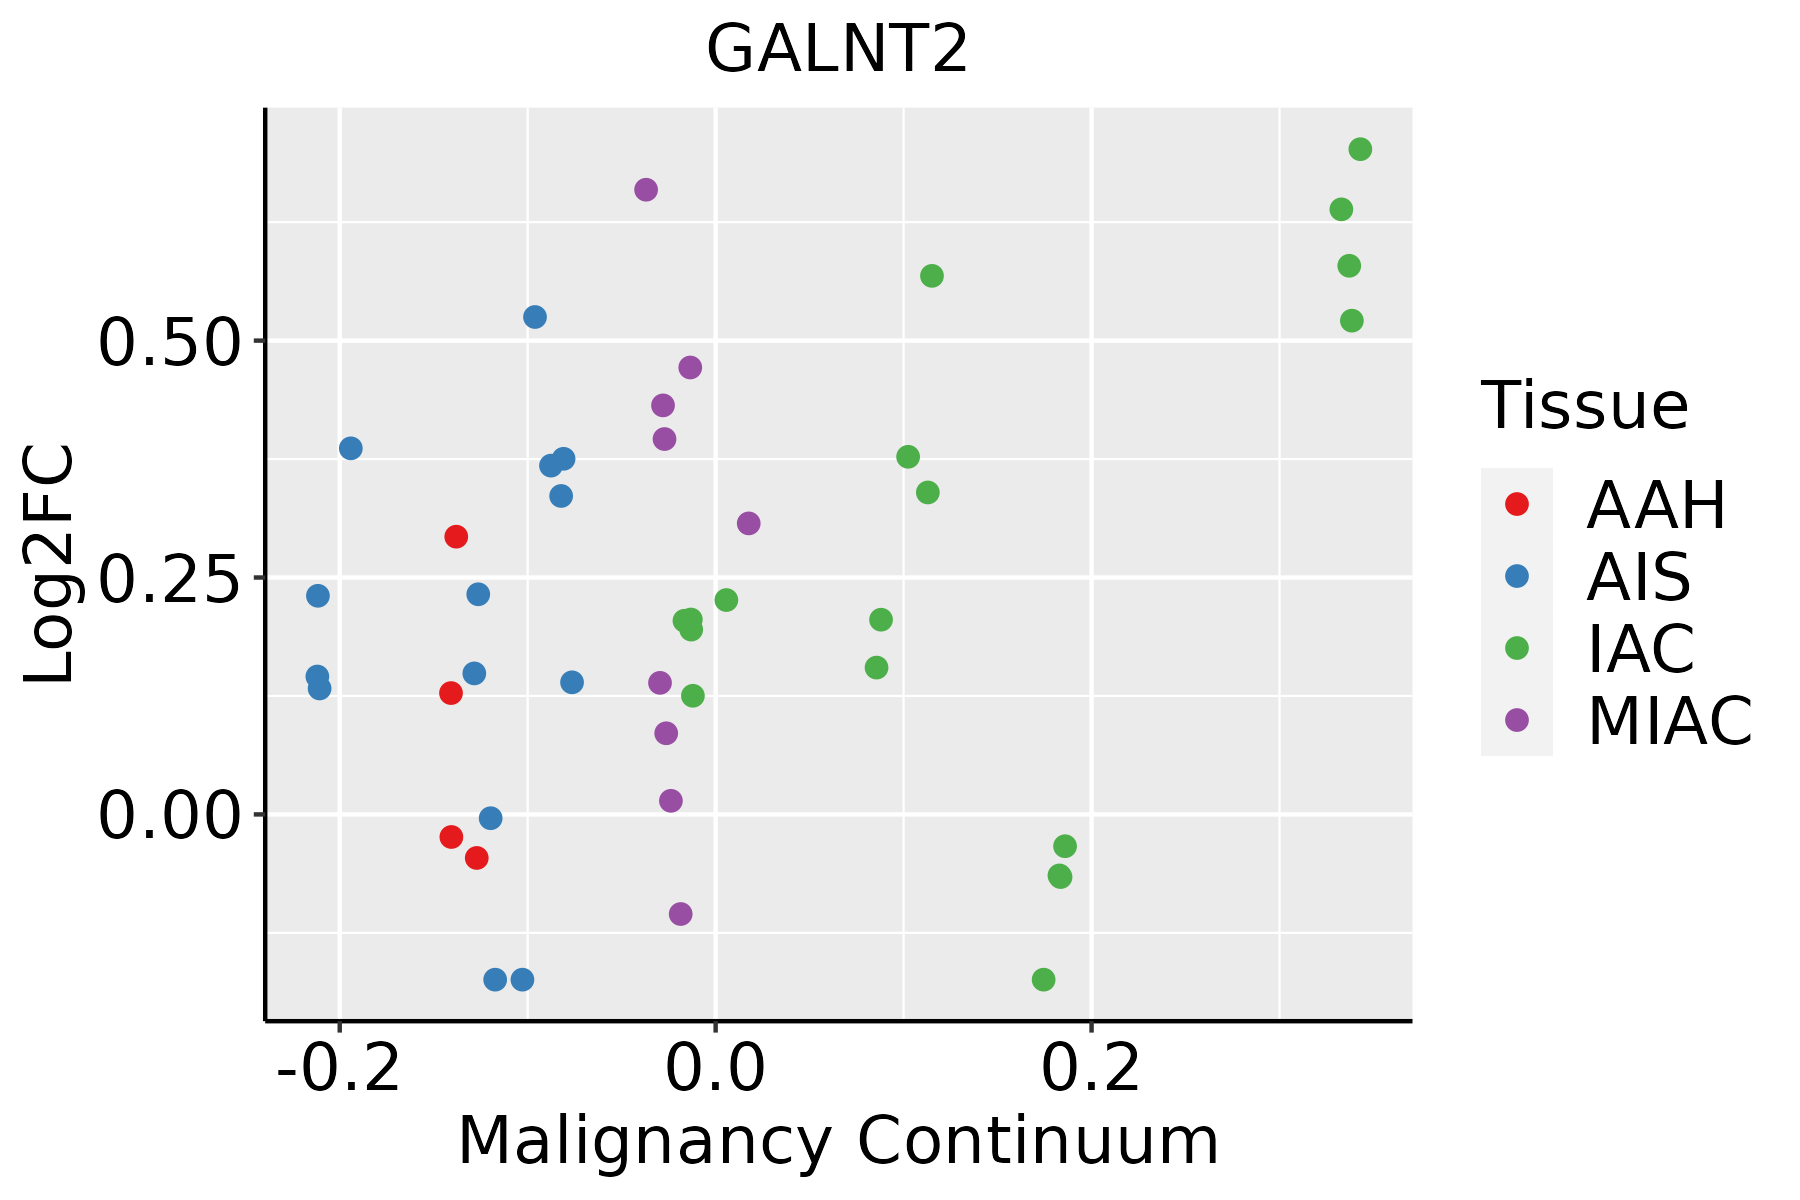 | AAH: Atypical adenomatous hyperplasia |
| AIS: Adenocarcinoma in situ |
| IAC: Invasive lung adenocarcinoma |
| MIA: Minimally invasive adenocarcinoma |
| Oral Cavity | 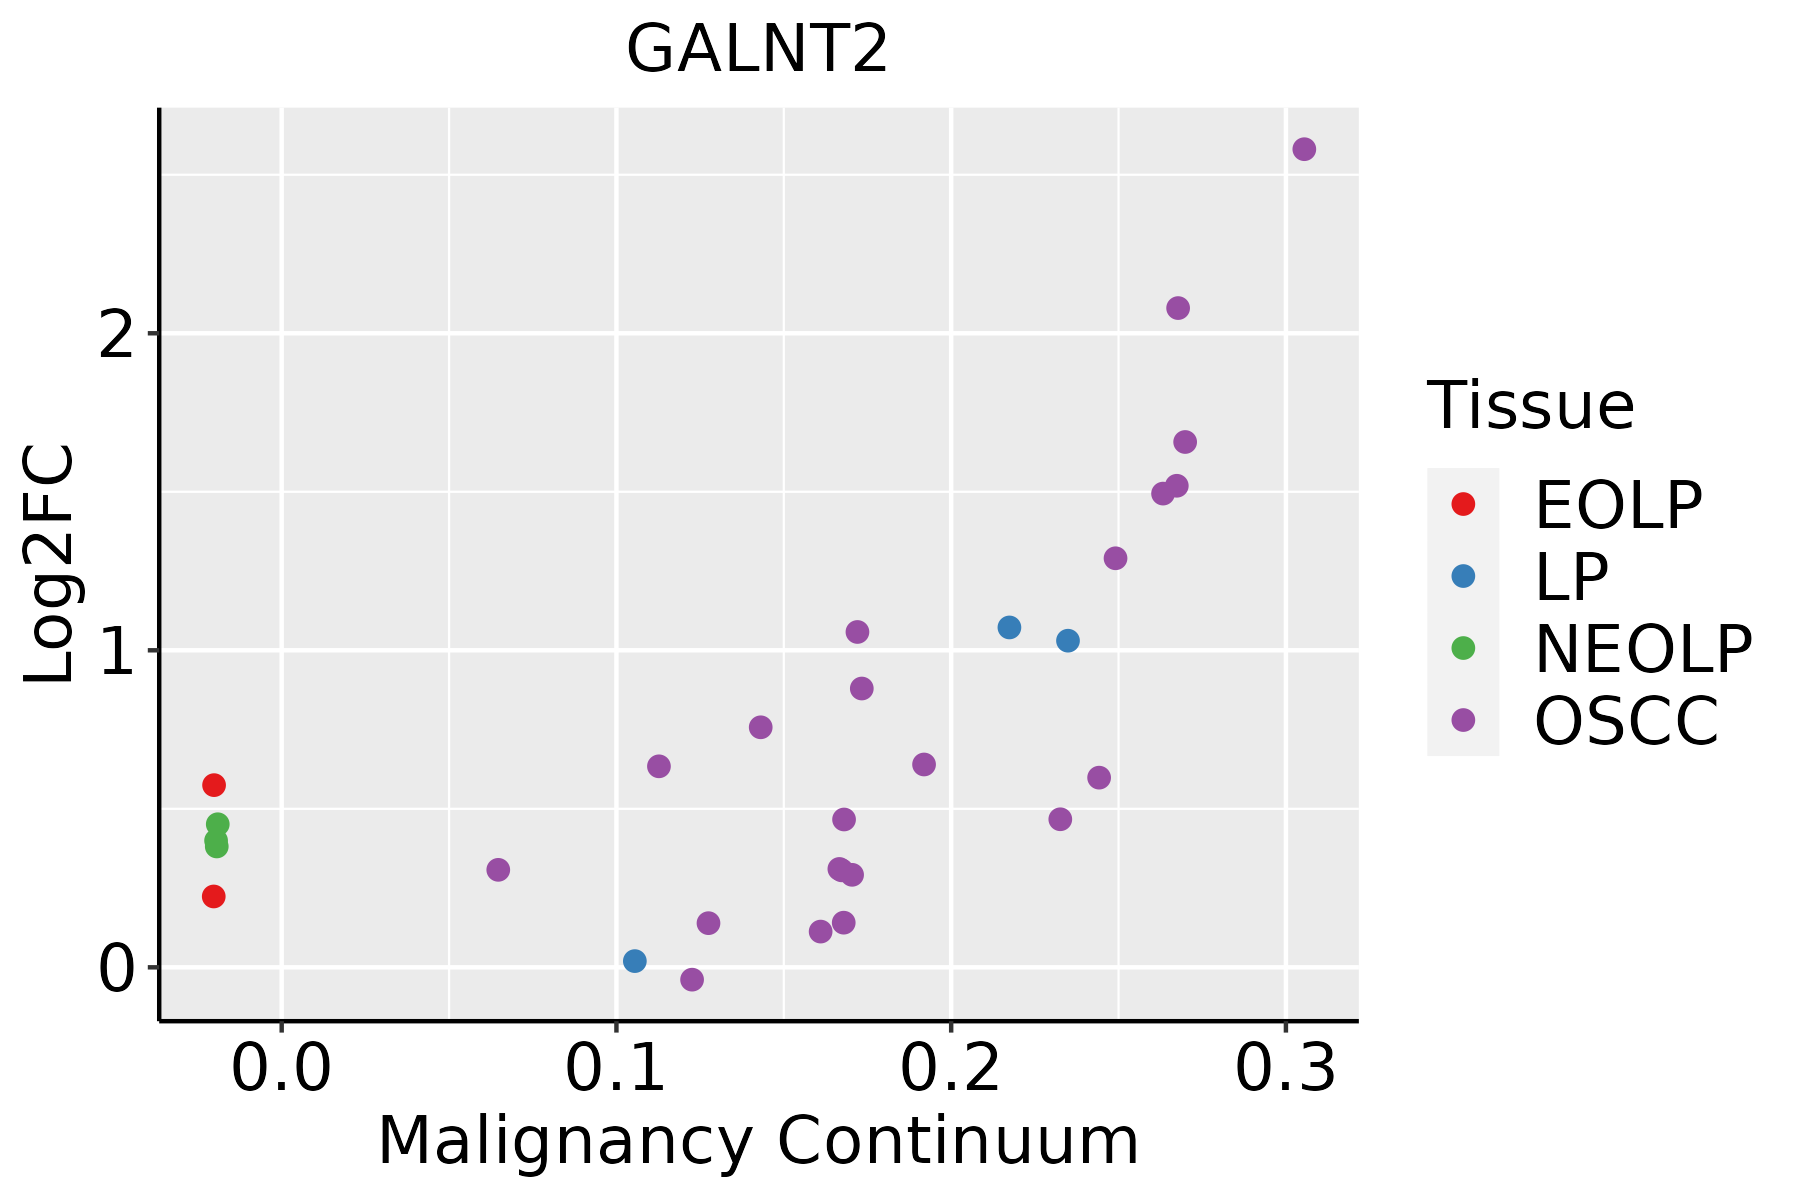 | EOLP: Erosive Oral lichen planus |
| LP: leukoplakia |
| NEOLP: Non-erosive oral lichen planus |
| OSCC: Oral squamous cell carcinoma |
| Skin | 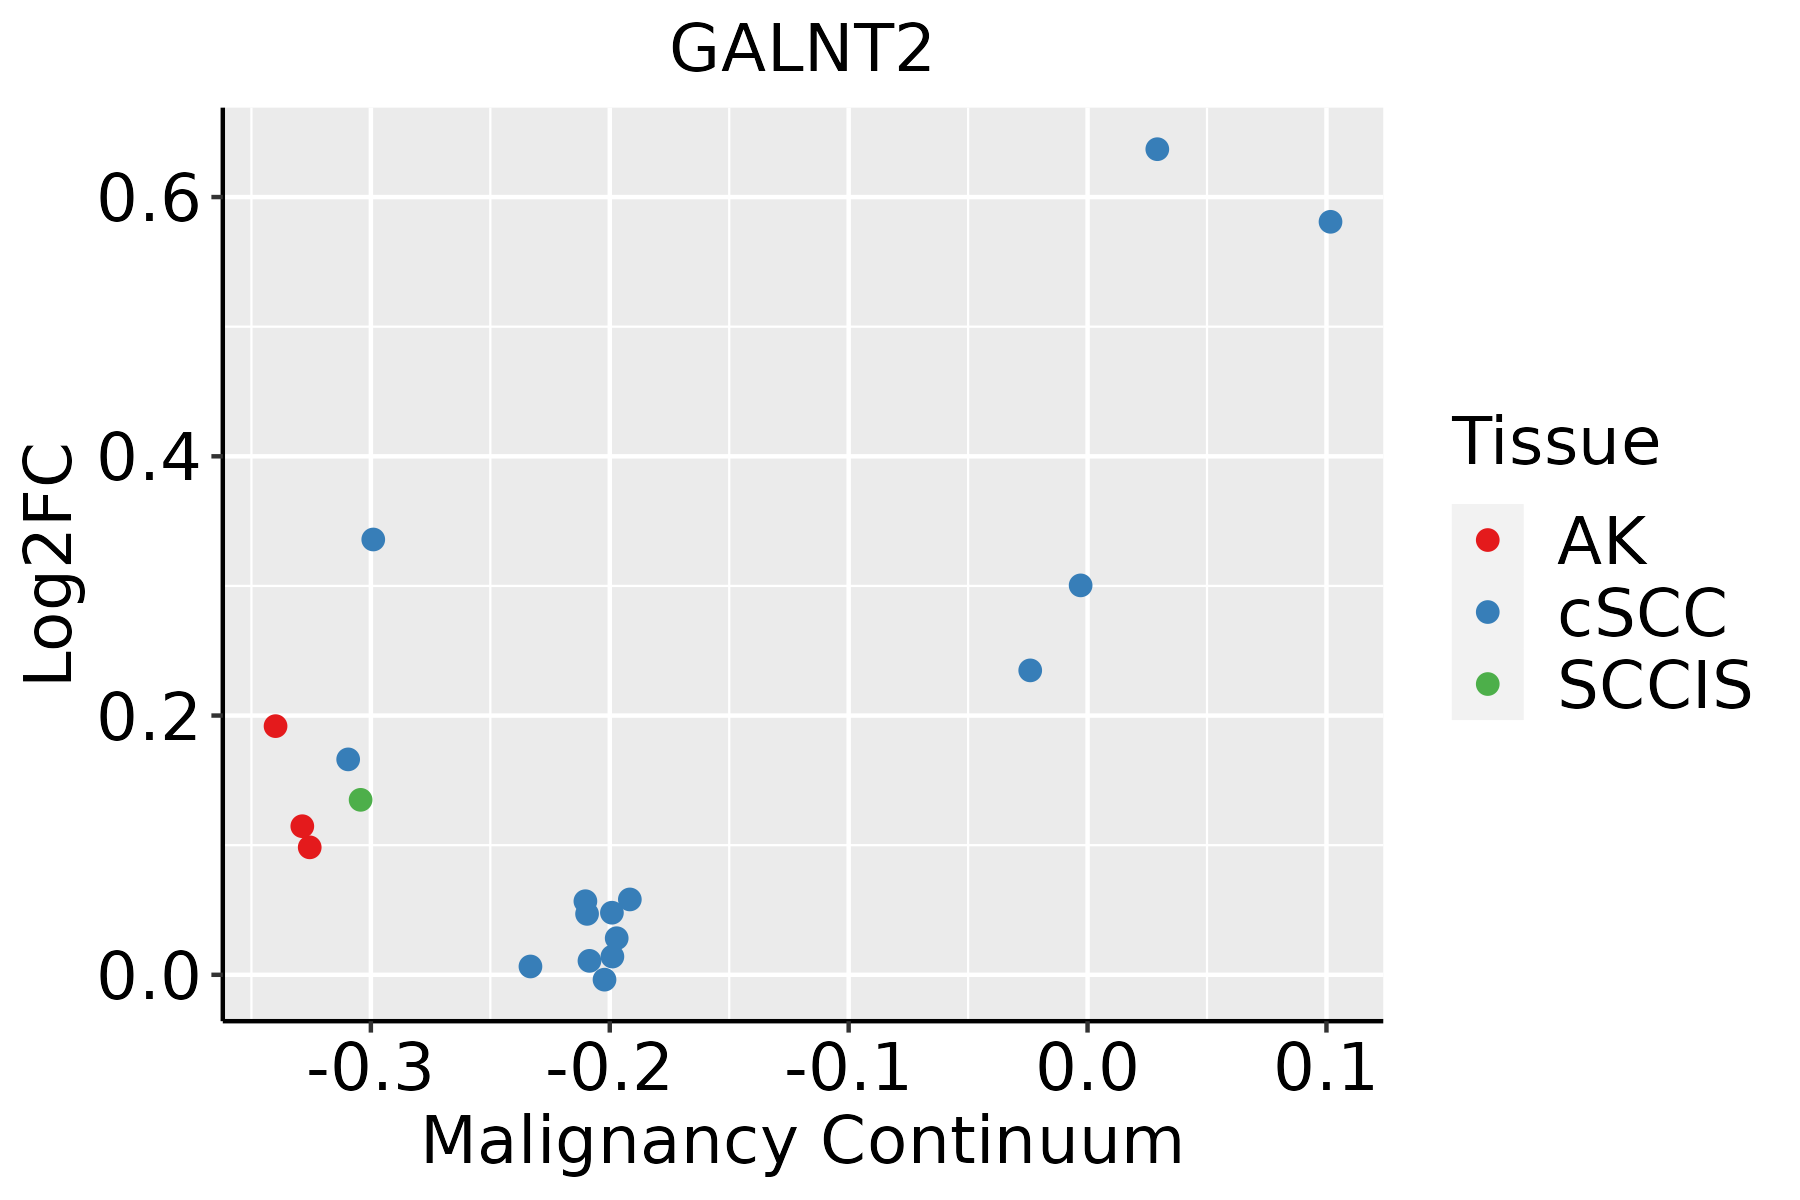 | AK: Actinic keratosis |
| cSCC: Cutaneous squamous cell carcinoma |
| SCCIS:squamous cell carcinoma in situ |
| Thyroid |  | ATC: Anaplastic thyroid cancer |
| HT: Hashimoto's thyroiditis |
| PTC: Papillary thyroid cancer |
| GO ID | Tissue | Disease Stage | Description | Gene Ratio | Bg Ratio | pvalue | p.adjust | Count |
| GO:00182096 | Cervix | CC | peptidyl-serine modification | 66/2311 | 338/18723 | 9.58e-05 | 1.25e-03 | 66 |
| GO:00516048 | Cervix | CC | protein maturation | 56/2311 | 294/18723 | 5.90e-04 | 5.59e-03 | 56 |
| GO:00182106 | Cervix | CC | peptidyl-threonine modification | 26/2311 | 125/18723 | 4.98e-03 | 2.97e-02 | 26 |
| GO:0018279 | Colorectum | AD | protein N-linked glycosylation via asparagine | 15/3918 | 23/18723 | 5.47e-06 | 1.40e-04 | 15 |
| GO:0018196 | Colorectum | AD | peptidyl-asparagine modification | 15/3918 | 24/18723 | 1.18e-05 | 2.62e-04 | 15 |
| GO:0030258 | Colorectum | AD | lipid modification | 67/3918 | 212/18723 | 1.66e-04 | 2.27e-03 | 67 |
| GO:0006487 | Colorectum | AD | protein N-linked glycosylation | 25/3918 | 65/18723 | 9.12e-04 | 8.71e-03 | 25 |
| GO:0009225 | Colorectum | AD | nucleotide-sugar metabolic process | 16/3918 | 36/18723 | 1.27e-03 | 1.12e-02 | 16 |
| GO:0006486 | Colorectum | AD | protein glycosylation | 64/3918 | 226/18723 | 4.86e-03 | 3.27e-02 | 64 |
| GO:0043413 | Colorectum | AD | macromolecule glycosylation | 64/3918 | 226/18723 | 4.86e-03 | 3.27e-02 | 64 |
| GO:0070085 | Colorectum | AD | glycosylation | 67/3918 | 240/18723 | 5.78e-03 | 3.67e-02 | 67 |
| GO:0007162 | Colorectum | SER | negative regulation of cell adhesion | 68/2897 | 303/18723 | 8.02e-04 | 1.01e-02 | 68 |
| GO:00182791 | Colorectum | SER | protein N-linked glycosylation via asparagine | 9/2897 | 23/18723 | 5.20e-03 | 3.95e-02 | 9 |
| GO:00302581 | Colorectum | SER | lipid modification | 47/2897 | 212/18723 | 6.01e-03 | 4.38e-02 | 47 |
| GO:0022408 | Colorectum | SER | negative regulation of cell-cell adhesion | 44/2897 | 196/18723 | 6.08e-03 | 4.42e-02 | 44 |
| GO:00092251 | Colorectum | SER | nucleotide-sugar metabolic process | 12/2897 | 36/18723 | 6.11e-03 | 4.42e-02 | 12 |
| GO:00181961 | Colorectum | SER | peptidyl-asparagine modification | 9/2897 | 24/18723 | 7.19e-03 | 4.99e-02 | 9 |
| GO:00182792 | Colorectum | MSS | protein N-linked glycosylation via asparagine | 13/3467 | 23/18723 | 5.21e-05 | 9.31e-04 | 13 |
| GO:00181962 | Colorectum | MSS | peptidyl-asparagine modification | 13/3467 | 24/18723 | 9.44e-05 | 1.49e-03 | 13 |
| GO:00064871 | Colorectum | MSS | protein N-linked glycosylation | 23/3467 | 65/18723 | 9.47e-04 | 9.54e-03 | 23 |
| Hugo Symbol | Variant Class | Variant Classification | dbSNP RS | HGVSc | HGVSp | HGVSp Short | SWISSPROT | BIOTYPE | SIFT | PolyPhen | Tumor Sample Barcode | Tissue | Histology | Sex | Age | Stage | Therapy Types | Drugs | Outcome |
| GALNT2 | SNV | Missense_Mutation | novel | c.615G>A | p.Met205Ile | p.M205I | Q10471 | protein_coding | tolerated(1) | benign(0.025) | TCGA-A2-A3XY-01 | Breast | breast invasive carcinoma | Female | <65 | I/II | Chemotherapy | adriamycin | PD |
| GALNT2 | SNV | Missense_Mutation | | c.483N>C | p.Lys161Asn | p.K161N | Q10471 | protein_coding | tolerated(1) | benign(0.003) | TCGA-A8-A07U-01 | Breast | breast invasive carcinoma | Female | >=65 | III/IV | Chemotherapy | 5-fluorouracil | SD |
| GALNT2 | SNV | Missense_Mutation | rs763766688 | c.1642N>A | p.Gly548Arg | p.G548R | Q10471 | protein_coding | tolerated(0.34) | benign(0.015) | TCGA-AR-A5QQ-01 | Breast | breast invasive carcinoma | Female | >=65 | III/IV | Chemotherapy | carboplatin | PD |
| GALNT2 | SNV | Missense_Mutation | novel | c.610N>T | p.Leu204Phe | p.L204F | Q10471 | protein_coding | deleterious(0) | probably_damaging(1) | TCGA-BH-A8FY-01 | Breast | breast invasive carcinoma | Female | >=65 | I/II | Unknown | Unknown | SD |
| GALNT2 | SNV | Missense_Mutation | | c.137A>G | p.Asn46Ser | p.N46S | Q10471 | protein_coding | tolerated(0.41) | benign(0) | TCGA-E9-A22B-01 | Breast | breast invasive carcinoma | Female | >=65 | I/II | Hormone Therapy | tamoxiphen | SD |
| GALNT2 | insertion | In_Frame_Ins | novel | c.1086_1087insCTTCACTTAATTTCCTGGGAATACTATCCAGCCAGAAAA | p.Arg362_Lys363insLeuHisLeuIleSerTrpGluTyrTyrProAlaArgLys | p.R362_K363insLHLISWEYYPARK | Q10471 | protein_coding | | | TCGA-A2-A0EY-01 | Breast | breast invasive carcinoma | Female | <65 | I/II | Chemotherapy | adriamycin | SD |
| GALNT2 | insertion | In_Frame_Ins | novel | c.1057_1058insTTGATGTTGAAAGCTTCTTTAGGCTCGATTACTATA | p.Pro353delinsLeuAspValGluSerPhePheArgLeuAspTyrTyrThr | p.P353delinsLDVESFFRLDYYT | Q10471 | protein_coding | | | TCGA-AN-A049-01 | Breast | breast invasive carcinoma | Female | <65 | I/II | Unknown | Unknown | SD |
| GALNT2 | SNV | Missense_Mutation | rs779465339 | c.382C>T | p.Arg128Trp | p.R128W | Q10471 | protein_coding | deleterious(0.02) | possibly_damaging(0.521) | TCGA-2W-A8YY-01 | Cervix | cervical & endocervical cancer | Female | <65 | I/II | Chemotherapy | cisplatin | CR |
| GALNT2 | SNV | Missense_Mutation | rs147219046 | c.1504C>T | p.Arg502Trp | p.R502W | Q10471 | protein_coding | tolerated(0.18) | possibly_damaging(0.744) | TCGA-2W-A8YY-01 | Cervix | cervical & endocervical cancer | Female | <65 | I/II | Chemotherapy | cisplatin | CR |
| GALNT2 | SNV | Missense_Mutation | | c.703N>A | p.Glu235Lys | p.E235K | Q10471 | protein_coding | deleterious(0.02) | probably_damaging(1) | TCGA-AA-3715-01 | Colorectum | colon adenocarcinoma | Male | >=65 | I/II | Unknown | Unknown | PD |


