
|
|||||
|
 | |
| |
| |
| |
| |
| |
|
Gene: GALNT14 |
Gene summary for GALNT14 |
| Gene information | Species | Human | Gene symbol | GALNT14 | Gene ID | 79623 |
| Gene name | polypeptide N-acetylgalactosaminyltransferase 14 | |
| Gene Alias | GALNT15 | |
| Cytomap | 2p23.1 | |
| Gene Type | protein-coding | GO ID | GO:0006464 | UniProtAcc | Q96FL9 |
Top |
Malignant transformation analysis |
| Identification of the aberrant gene expression in precancerous and cancerous lesions by comparing the gene expression of stem-like cells in diseased tissues with normal stem cells |
| Entrez ID | Symbol | Replicates | Species | Organ | Tissue | Adj P-value | Log2FC | Malignancy |
| 79623 | GALNT14 | CCI_1 | Human | Cervix | CC | 5.32e-03 | 1.11e+00 | 0.528 |
| 79623 | GALNT14 | CCI_2 | Human | Cervix | CC | 5.05e-09 | 6.92e-01 | 0.5249 |
| 79623 | GALNT14 | CCI_3 | Human | Cervix | CC | 3.00e-12 | 5.88e-01 | 0.516 |
| 79623 | GALNT14 | LZE4T | Human | Esophagus | ESCC | 3.78e-05 | 2.01e-01 | 0.0811 |
| 79623 | GALNT14 | LZE24T | Human | Esophagus | ESCC | 5.37e-08 | 2.38e-01 | 0.0596 |
| 79623 | GALNT14 | P1T-E | Human | Esophagus | ESCC | 3.23e-07 | 6.29e-01 | 0.0875 |
| 79623 | GALNT14 | P2T-E | Human | Esophagus | ESCC | 1.51e-17 | 4.14e-01 | 0.1177 |
| 79623 | GALNT14 | P4T-E | Human | Esophagus | ESCC | 2.12e-09 | 3.40e-01 | 0.1323 |
| 79623 | GALNT14 | P5T-E | Human | Esophagus | ESCC | 1.87e-03 | 1.22e-01 | 0.1327 |
| 79623 | GALNT14 | P8T-E | Human | Esophagus | ESCC | 3.10e-07 | 2.06e-01 | 0.0889 |
| 79623 | GALNT14 | P9T-E | Human | Esophagus | ESCC | 1.07e-05 | 1.48e-01 | 0.1131 |
| 79623 | GALNT14 | P10T-E | Human | Esophagus | ESCC | 4.42e-03 | 1.95e-02 | 0.116 |
| 79623 | GALNT14 | P11T-E | Human | Esophagus | ESCC | 2.36e-15 | 6.23e-01 | 0.1426 |
| 79623 | GALNT14 | P12T-E | Human | Esophagus | ESCC | 7.49e-20 | 5.25e-01 | 0.1122 |
| 79623 | GALNT14 | P15T-E | Human | Esophagus | ESCC | 1.45e-19 | 6.73e-01 | 0.1149 |
| 79623 | GALNT14 | P16T-E | Human | Esophagus | ESCC | 3.37e-03 | 9.01e-02 | 0.1153 |
| 79623 | GALNT14 | P20T-E | Human | Esophagus | ESCC | 5.83e-04 | 4.79e-02 | 0.1124 |
| 79623 | GALNT14 | P21T-E | Human | Esophagus | ESCC | 1.63e-15 | 3.33e-01 | 0.1617 |
| 79623 | GALNT14 | P22T-E | Human | Esophagus | ESCC | 1.59e-18 | 3.63e-01 | 0.1236 |
| 79623 | GALNT14 | P23T-E | Human | Esophagus | ESCC | 5.97e-26 | 7.61e-01 | 0.108 |
| Page: 1 2 3 |
| Tissue | Expression Dynamics | Abbreviation |
| Cervix |  | CC: Cervix cancer |
| HSIL_HPV: HPV-infected high-grade squamous intraepithelial lesions | ||
| N_HPV: HPV-infected normal cervix | ||
| Esophagus | 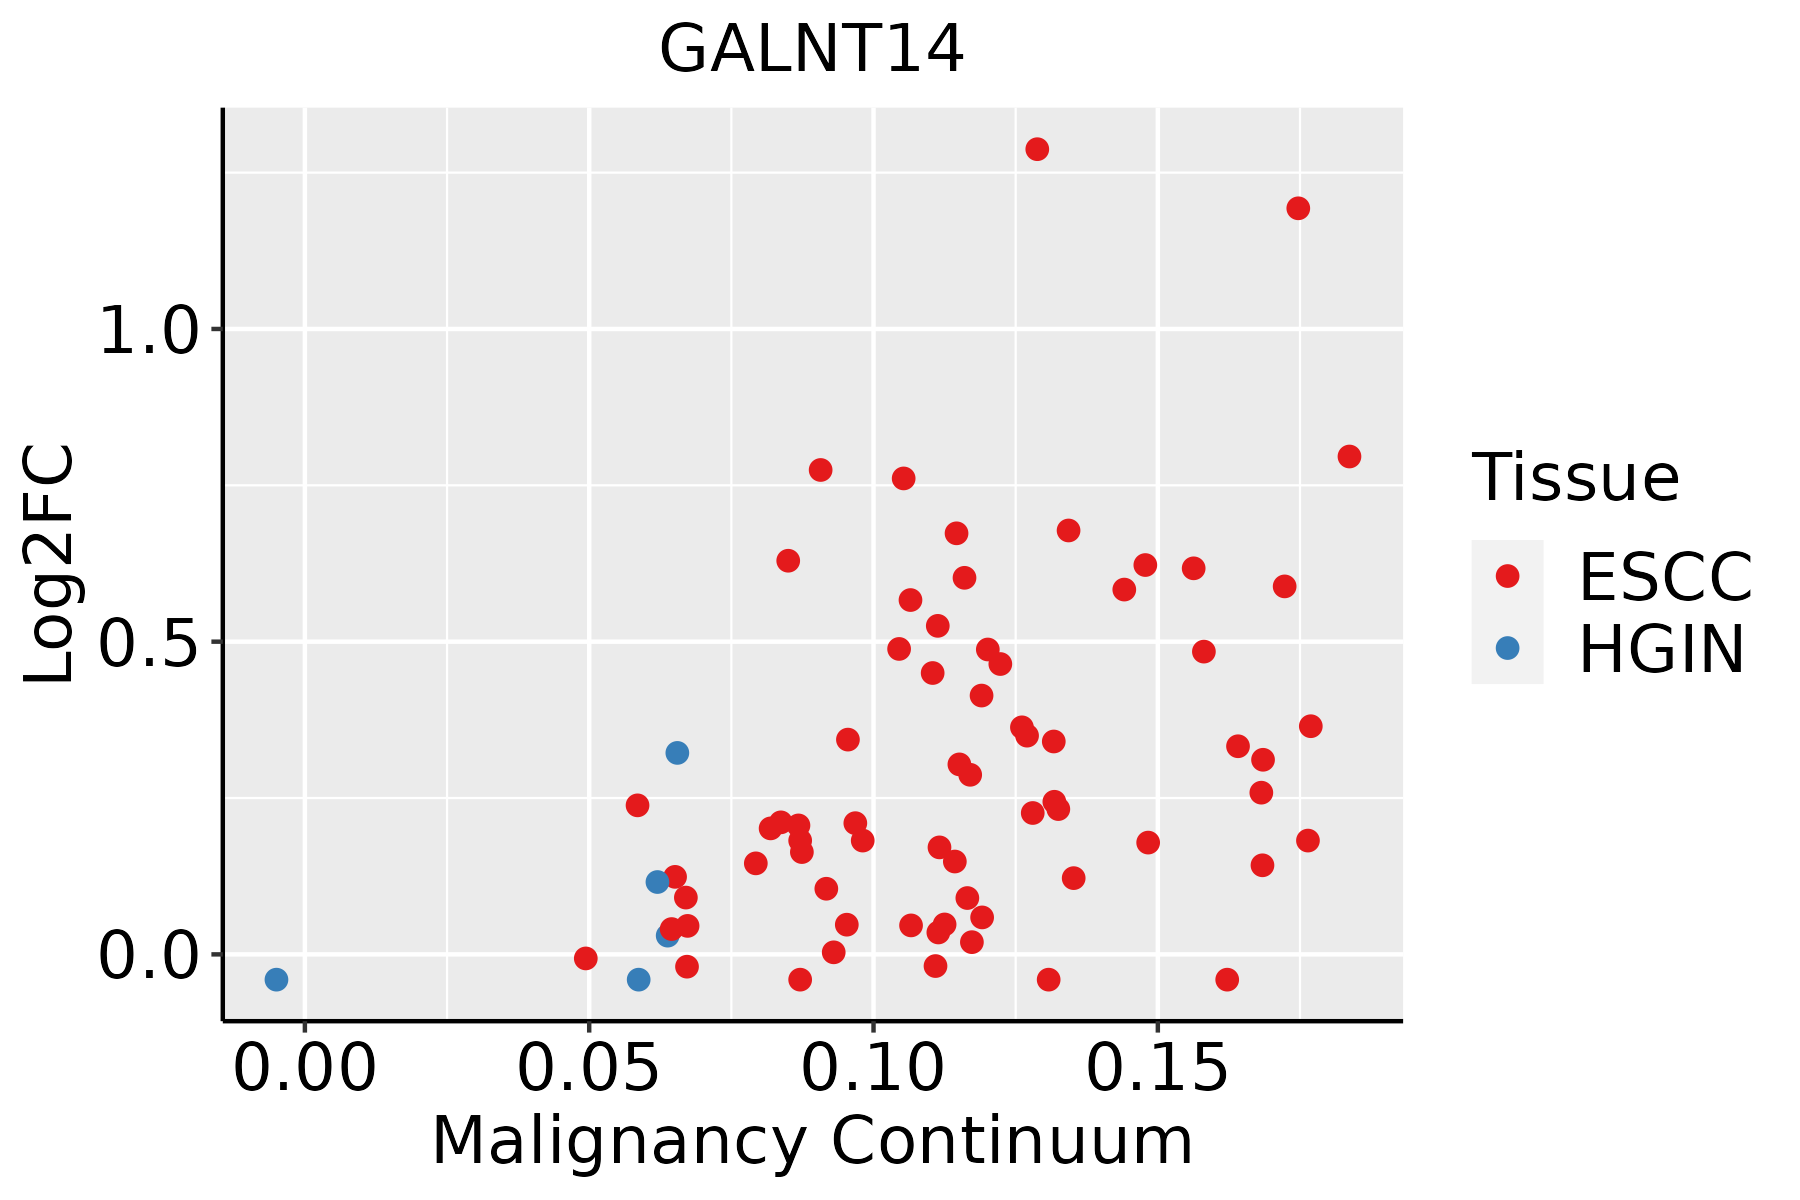 | ESCC: Esophageal squamous cell carcinoma |
| HGIN: High-grade intraepithelial neoplasias | ||
| LGIN: Low-grade intraepithelial neoplasias | ||
| Oral Cavity | 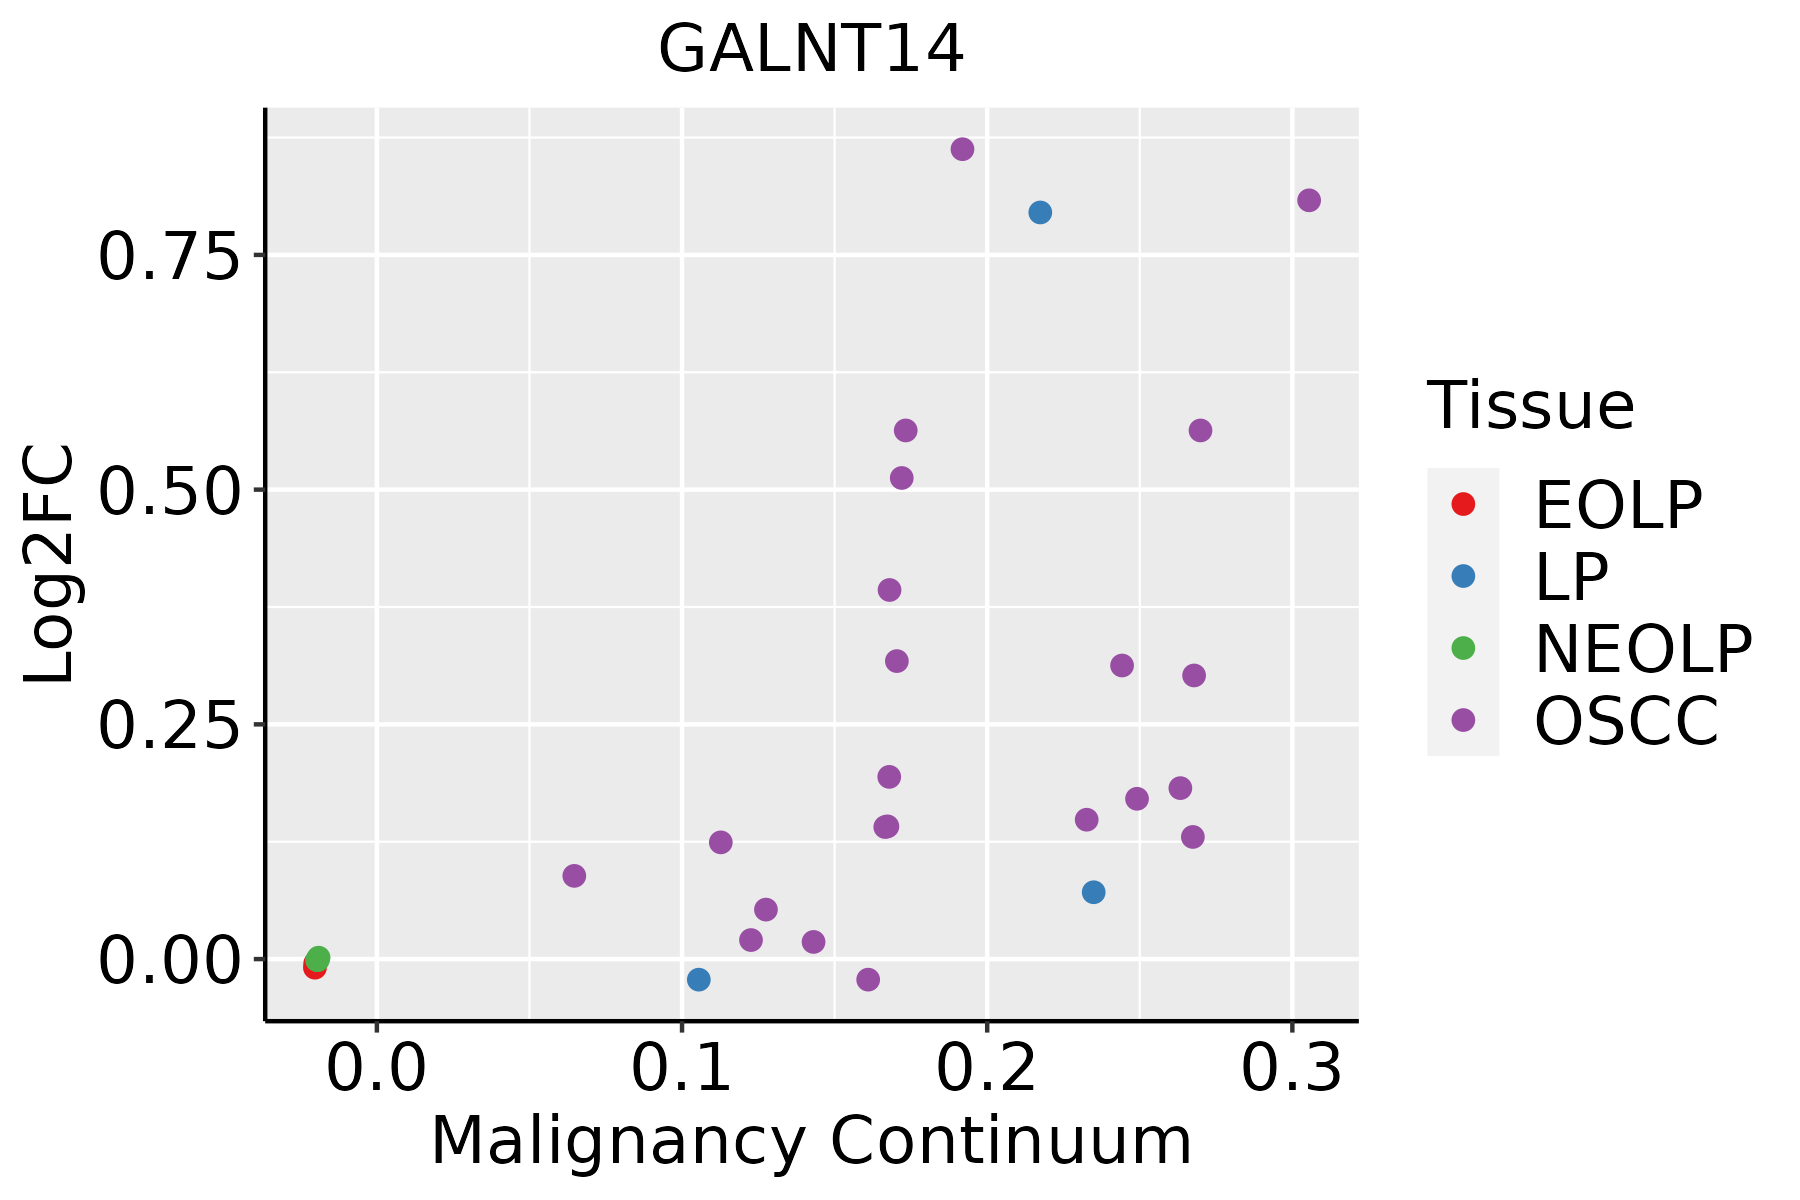 | EOLP: Erosive Oral lichen planus |
| LP: leukoplakia | ||
| NEOLP: Non-erosive oral lichen planus | ||
| OSCC: Oral squamous cell carcinoma |
| ∗log2FC in expression of this searched gene in stem-like cells from each diseased tissue sample relative to stem-like cells in normal samples in each tissue plotted against the malignancy continuum. Samples are colored based on if they are from different disease stage. |
Top |
Malignant transformation related pathway analysis |
| Find out the enriched GO biological processes and KEGG pathways involved in transition from healthy to precancer to cancer |
| Tissue | Disease Stage | Enriched GO biological Processes |
| Colorectum | AD |  |
| Colorectum | SER |  |
| Colorectum | MSS |  |
| Colorectum | MSI-H |  |
| Colorectum | FAP |  |
| ∗Top 15 enriched GO BP terms are showed in the bar plot of each disease state in each tissue. Each row represents a significant GO biological process which is colored according to the -log10(p.adjust). |
| Page: 1 2 3 4 5 6 7 8 9 |
| GO ID | Tissue | Disease Stage | Description | Gene Ratio | Bg Ratio | pvalue | p.adjust | Count |
| GO:00091002 | Esophagus | ESCC | glycoprotein metabolic process | 226/8552 | 387/18723 | 2.64e-07 | 3.94e-06 | 226 |
| GO:00700854 | Esophagus | ESCC | glycosylation | 144/8552 | 240/18723 | 5.12e-06 | 5.38e-05 | 144 |
| GO:00064865 | Esophagus | ESCC | protein glycosylation | 135/8552 | 226/18723 | 1.36e-05 | 1.24e-04 | 135 |
| GO:00434135 | Esophagus | ESCC | macromolecule glycosylation | 135/8552 | 226/18723 | 1.36e-05 | 1.24e-04 | 135 |
| GO:00091012 | Esophagus | ESCC | glycoprotein biosynthetic process | 181/8552 | 317/18723 | 2.54e-05 | 2.15e-04 | 181 |
| GO:00064931 | Esophagus | ESCC | protein O-linked glycosylation | 51/8552 | 86/18723 | 7.54e-03 | 2.70e-02 | 51 |
| GO:00091001 | Oral cavity | OSCC | glycoprotein metabolic process | 185/7305 | 387/18723 | 2.37e-04 | 1.54e-03 | 185 |
| GO:00091011 | Oral cavity | OSCC | glycoprotein biosynthetic process | 151/7305 | 317/18723 | 1.01e-03 | 5.26e-03 | 151 |
| GO:00064864 | Oral cavity | OSCC | protein glycosylation | 111/7305 | 226/18723 | 1.22e-03 | 6.10e-03 | 111 |
| GO:00434134 | Oral cavity | OSCC | macromolecule glycosylation | 111/7305 | 226/18723 | 1.22e-03 | 6.10e-03 | 111 |
| GO:00700853 | Oral cavity | OSCC | glycosylation | 117/7305 | 240/18723 | 1.29e-03 | 6.42e-03 | 117 |
| GO:007008511 | Oral cavity | LP | glycosylation | 77/4623 | 240/18723 | 5.60e-03 | 3.38e-02 | 77 |
| GO:000648611 | Oral cavity | LP | protein glycosylation | 73/4623 | 226/18723 | 5.72e-03 | 3.44e-02 | 73 |
| GO:004341311 | Oral cavity | LP | macromolecule glycosylation | 73/4623 | 226/18723 | 5.72e-03 | 3.44e-02 | 73 |
| Page: 1 |
| Pathway ID | Tissue | Disease Stage | Description | Gene Ratio | Bg Ratio | pvalue | p.adjust | qvalue | Count |
| Page: 1 |
Top |
Cell-cell communication analysis |
| Identification of potential cell-cell interactions between two cell types and their ligand-receptor pairs for different disease states |
| Ligand | Receptor | LRpair | Pathway | Tissue | Disease Stage |
| Page: 1 |
Top |
Single-cell gene regulatory network inference analysis |
| Find out the significant the regulons (TFs) and the target genes of each regulon across cell types for different disease states |
| TF | Cell Type | Tissue | Disease Stage | Target Gene | RSS | Regulon Activity |
| ∗The dot plots of a searched regulon are shown for all cell subpopulations in each disease state of each tissue based on the regulon specific score inferred using pySCENIC and by calculating the average expression. |
| Page: 1 |
Top |
Somatic mutation of malignant transformation related genes |
| Annotation of somatic variants for genes involved in malignant transformation |
| Hugo Symbol | Variant Class | Variant Classification | dbSNP RS | HGVSc | HGVSp | HGVSp Short | SWISSPROT | BIOTYPE | SIFT | PolyPhen | Tumor Sample Barcode | Tissue | Histology | Sex | Age | Stage | Therapy Types | Drugs | Outcome |
| GALNT14 | SNV | Missense_Mutation | rs142569800 | c.434C>T | p.Thr145Met | p.T145M | Q96FL9 | protein_coding | tolerated(0.29) | benign(0.003) | TCGA-5L-AAT1-01 | Breast | breast invasive carcinoma | Female | <65 | III/IV | Hormone Therapy | letrozol | SD |
| GALNT14 | SNV | Missense_Mutation | c.401N>T | p.Arg134Met | p.R134M | Q96FL9 | protein_coding | deleterious(0) | probably_damaging(1) | TCGA-A2-A0CL-01 | Breast | breast invasive carcinoma | Female | <65 | III/IV | Chemotherapy | cytoxan | SD | |
| GALNT14 | SNV | Missense_Mutation | novel | c.892N>C | p.Asp298His | p.D298H | Q96FL9 | protein_coding | tolerated(0.06) | benign(0.428) | TCGA-BH-A0B6-01 | Breast | breast invasive carcinoma | Female | <65 | I/II | Unknown | Unknown | SD |
| GALNT14 | SNV | Missense_Mutation | c.1260G>T | p.Lys420Asn | p.K420N | Q96FL9 | protein_coding | tolerated(0.17) | benign(0.003) | TCGA-EW-A1J2-01 | Breast | breast invasive carcinoma | Female | <65 | I/II | Chemotherapy | taxotere | SD | |
| GALNT14 | insertion | Frame_Shift_Ins | novel | c.616_617insTCAGTCTCCTCCTAGATAAATGGGGAATTGTGATG | p.His206LeufsTer16 | p.H206Lfs*16 | Q96FL9 | protein_coding | TCGA-A2-A04Y-01 | Breast | breast invasive carcinoma | Female | <65 | I/II | Chemotherapy | cytoxan | SD | ||
| GALNT14 | insertion | Frame_Shift_Ins | novel | c.1446_1447insGCCTG | p.Ser483AlafsTer37 | p.S483Afs*37 | Q96FL9 | protein_coding | TCGA-A8-A07P-01 | Breast | breast invasive carcinoma | Female | >=65 | I/II | Chemotherapy | 5-fluorouracil | SD | ||
| GALNT14 | insertion | Nonsense_Mutation | novel | c.677_678insTTCAAGAATGACTTTTAGGTGACTCAGGTAGTTTAAGA | p.Arg227SerfsTer7 | p.R227Sfs*7 | Q96FL9 | protein_coding | TCGA-A8-A09C-01 | Breast | breast invasive carcinoma | Female | >=65 | I/II | Unknown | Unknown | SD | ||
| GALNT14 | SNV | Missense_Mutation | c.1108N>C | p.Glu370Gln | p.E370Q | Q96FL9 | protein_coding | deleterious(0.03) | possibly_damaging(0.606) | TCGA-DR-A0ZM-01 | Cervix | cervical & endocervical cancer | Female | <65 | III/IV | Unspecific | Cisplatin | SD | |
| GALNT14 | SNV | Missense_Mutation | rs41280621 | c.173N>T | p.Ala58Val | p.A58V | Q96FL9 | protein_coding | tolerated_low_confidence(0.23) | benign(0) | TCGA-IR-A3LF-01 | Cervix | cervical & endocervical cancer | Female | <65 | I/II | Unknown | Unknown | SD |
| GALNT14 | SNV | Missense_Mutation | novel | c.598N>G | p.Leu200Val | p.L200V | Q96FL9 | protein_coding | deleterious(0) | probably_damaging(0.992) | TCGA-VS-A958-01 | Cervix | cervical & endocervical cancer | Female | <65 | I/II | Chemotherapy | cisplatin | CR |
| Page: 1 2 3 4 5 6 7 8 9 10 |
Top |
Related drugs of malignant transformation related genes |
| Identification of chemicals and drugs interact with genes involved in malignant transfromation |
| (DGIdb 4.0) |
| Entrez ID | Symbol | Category | Interaction Types | Drug Claim Name | Drug Name | PMIDs |
| 79623 | GALNT14 | ENZYME | fluorouracil | FLUOROURACIL | 31611591,21635146 | |
| 79623 | GALNT14 | ENZYME | sorafenib | SORAFENIB | 31611591 | |
| 79623 | GALNT14 | ENZYME | cisplatin | CISPLATIN | 31611591,21635146 | |
| 79623 | GALNT14 | ENZYME | mitoxantrone | MITOXANTRONE | 31611591,21635146 |
| Page: 1 |

Copyright 2023-Present -The University of Texas Health Science Center at Houston |