
|
|||||
|
 | |
| |
| |
| |
| |
| |
|
Gene: GALNT11 |
Gene summary for GALNT11 |
| Gene information | Species | Human | Gene symbol | GALNT11 | Gene ID | 63917 |
| Gene name | polypeptide N-acetylgalactosaminyltransferase 11 | |
| Gene Alias | GALNAC-T11 | |
| Cytomap | 7q36.1 | |
| Gene Type | protein-coding | GO ID | GO:0006464 | UniProtAcc | B7Z5G5 |
Top |
Malignant transformation analysis |
| Identification of the aberrant gene expression in precancerous and cancerous lesions by comparing the gene expression of stem-like cells in diseased tissues with normal stem cells |
| Entrez ID | Symbol | Replicates | Species | Organ | Tissue | Adj P-value | Log2FC | Malignancy |
| 63917 | GALNT11 | LZE4T | Human | Esophagus | ESCC | 7.75e-03 | 9.96e-02 | 0.0811 |
| 63917 | GALNT11 | LZE7T | Human | Esophagus | ESCC | 2.13e-04 | 4.13e-01 | 0.0667 |
| 63917 | GALNT11 | LZE22T | Human | Esophagus | ESCC | 2.41e-03 | 2.40e-01 | 0.068 |
| 63917 | GALNT11 | LZE24T | Human | Esophagus | ESCC | 1.00e-02 | 8.94e-02 | 0.0596 |
| 63917 | GALNT11 | P1T-E | Human | Esophagus | ESCC | 9.37e-06 | 2.76e-01 | 0.0875 |
| 63917 | GALNT11 | P2T-E | Human | Esophagus | ESCC | 4.58e-18 | 3.11e-01 | 0.1177 |
| 63917 | GALNT11 | P4T-E | Human | Esophagus | ESCC | 1.86e-12 | 1.87e-01 | 0.1323 |
| 63917 | GALNT11 | P5T-E | Human | Esophagus | ESCC | 1.03e-12 | 1.17e-01 | 0.1327 |
| 63917 | GALNT11 | P8T-E | Human | Esophagus | ESCC | 1.28e-17 | 1.98e-01 | 0.0889 |
| 63917 | GALNT11 | P9T-E | Human | Esophagus | ESCC | 4.10e-13 | 2.51e-01 | 0.1131 |
| 63917 | GALNT11 | P10T-E | Human | Esophagus | ESCC | 2.87e-31 | 5.31e-01 | 0.116 |
| 63917 | GALNT11 | P11T-E | Human | Esophagus | ESCC | 2.08e-06 | 2.92e-01 | 0.1426 |
| 63917 | GALNT11 | P12T-E | Human | Esophagus | ESCC | 2.86e-23 | 4.35e-01 | 0.1122 |
| 63917 | GALNT11 | P15T-E | Human | Esophagus | ESCC | 9.86e-24 | 7.29e-01 | 0.1149 |
| 63917 | GALNT11 | P16T-E | Human | Esophagus | ESCC | 8.44e-20 | 3.60e-01 | 0.1153 |
| 63917 | GALNT11 | P19T-E | Human | Esophagus | ESCC | 1.61e-08 | 6.45e-01 | 0.1662 |
| 63917 | GALNT11 | P20T-E | Human | Esophagus | ESCC | 1.03e-12 | 2.51e-01 | 0.1124 |
| 63917 | GALNT11 | P21T-E | Human | Esophagus | ESCC | 2.38e-46 | 9.16e-01 | 0.1617 |
| 63917 | GALNT11 | P22T-E | Human | Esophagus | ESCC | 4.53e-11 | 2.35e-01 | 0.1236 |
| 63917 | GALNT11 | P24T-E | Human | Esophagus | ESCC | 1.66e-10 | 1.74e-01 | 0.1287 |
| Page: 1 2 3 4 5 |
| Tissue | Expression Dynamics | Abbreviation |
| Esophagus | 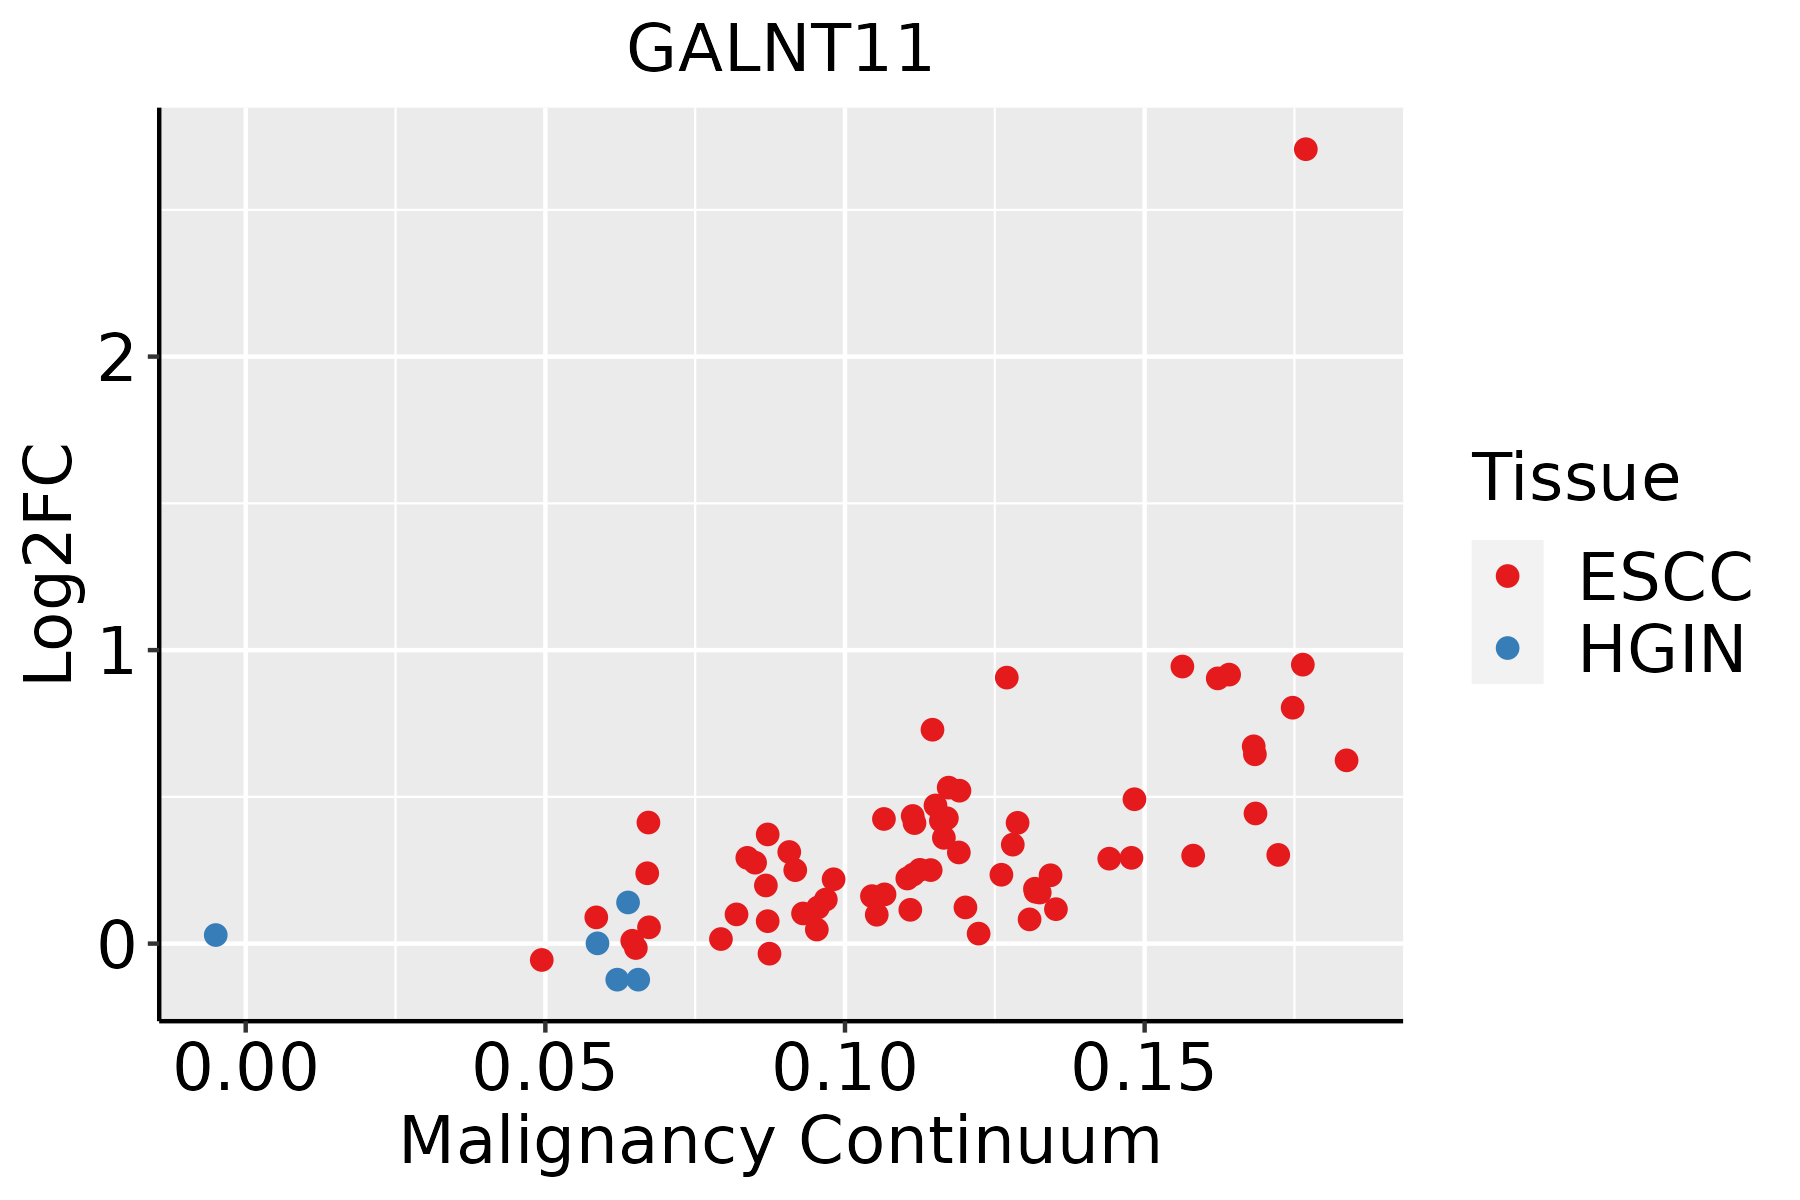 | ESCC: Esophageal squamous cell carcinoma |
| HGIN: High-grade intraepithelial neoplasias | ||
| LGIN: Low-grade intraepithelial neoplasias | ||
| Lung | 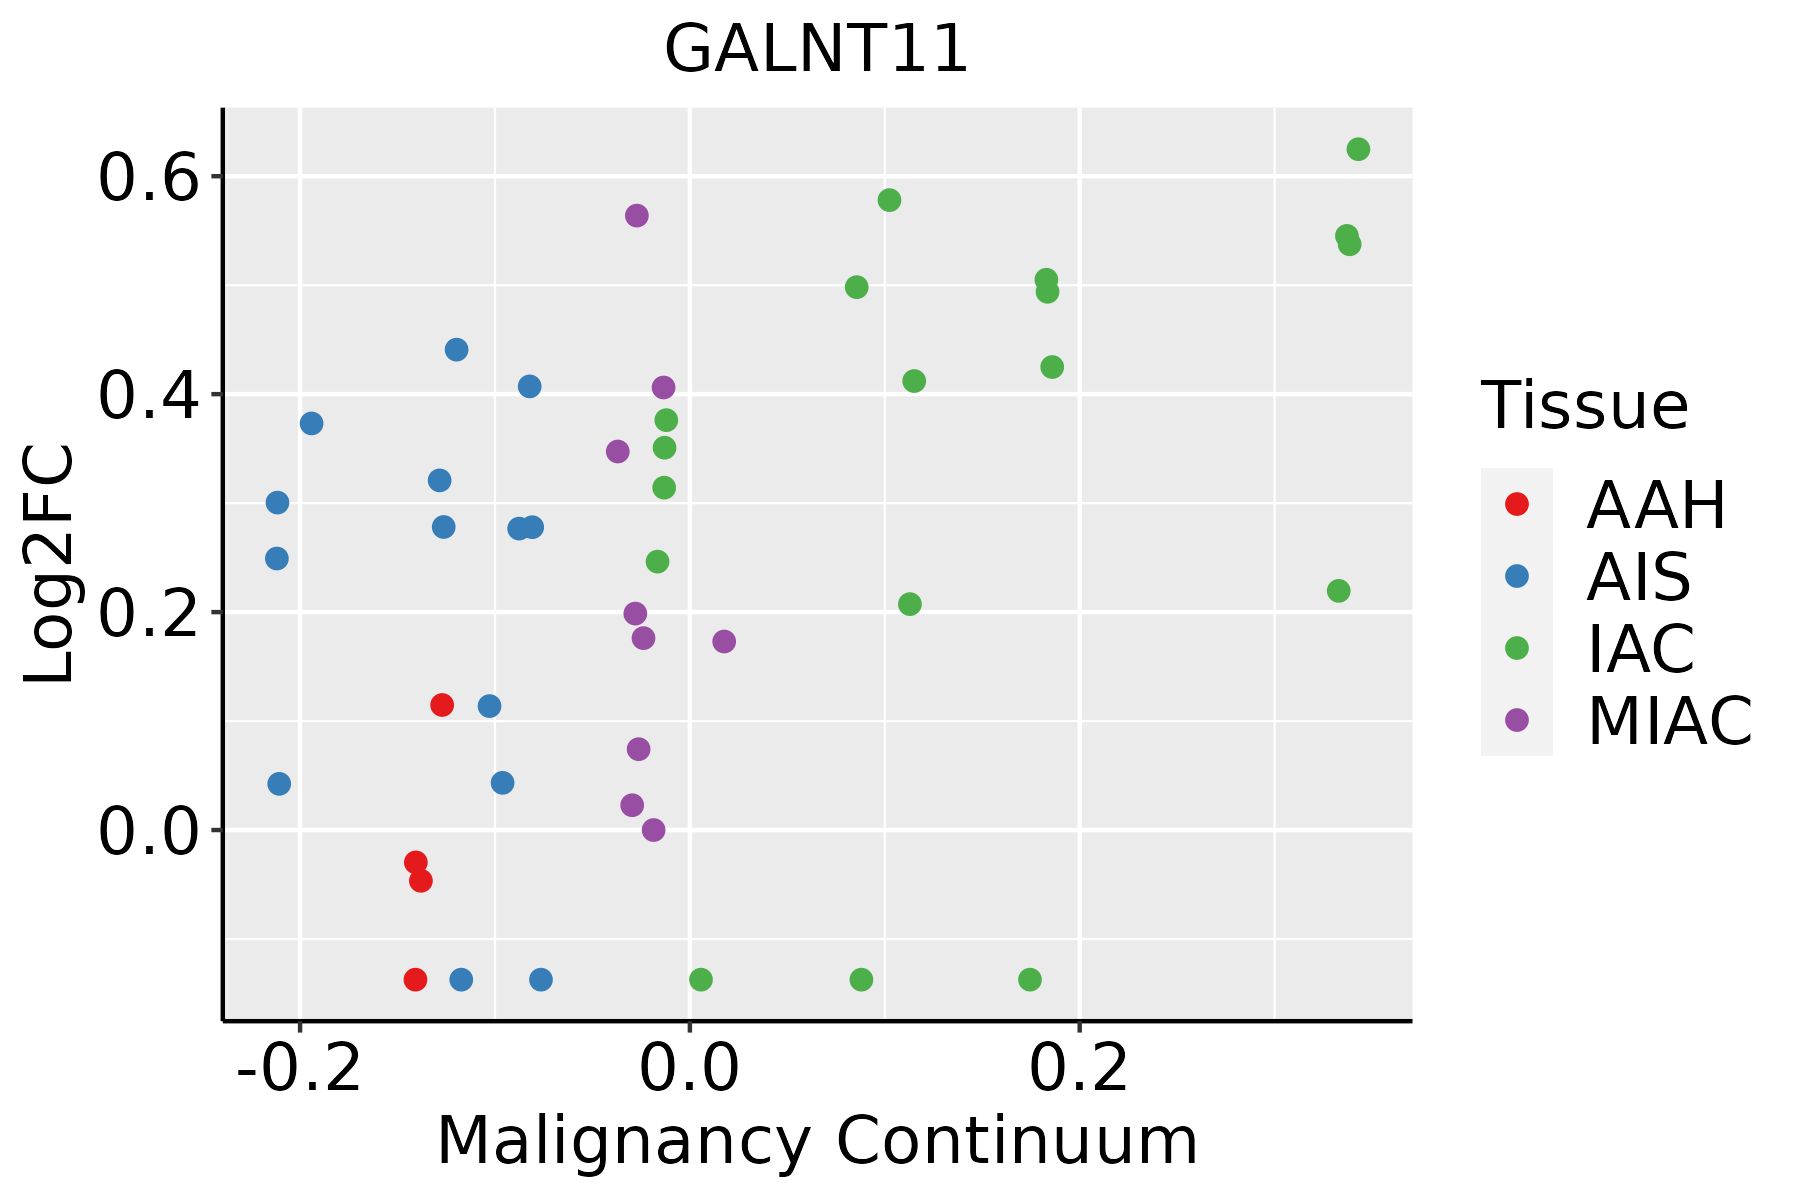 | AAH: Atypical adenomatous hyperplasia |
| AIS: Adenocarcinoma in situ | ||
| IAC: Invasive lung adenocarcinoma | ||
| MIA: Minimally invasive adenocarcinoma | ||
| Oral Cavity |  | EOLP: Erosive Oral lichen planus |
| LP: leukoplakia | ||
| NEOLP: Non-erosive oral lichen planus | ||
| OSCC: Oral squamous cell carcinoma | ||
| Thyroid | 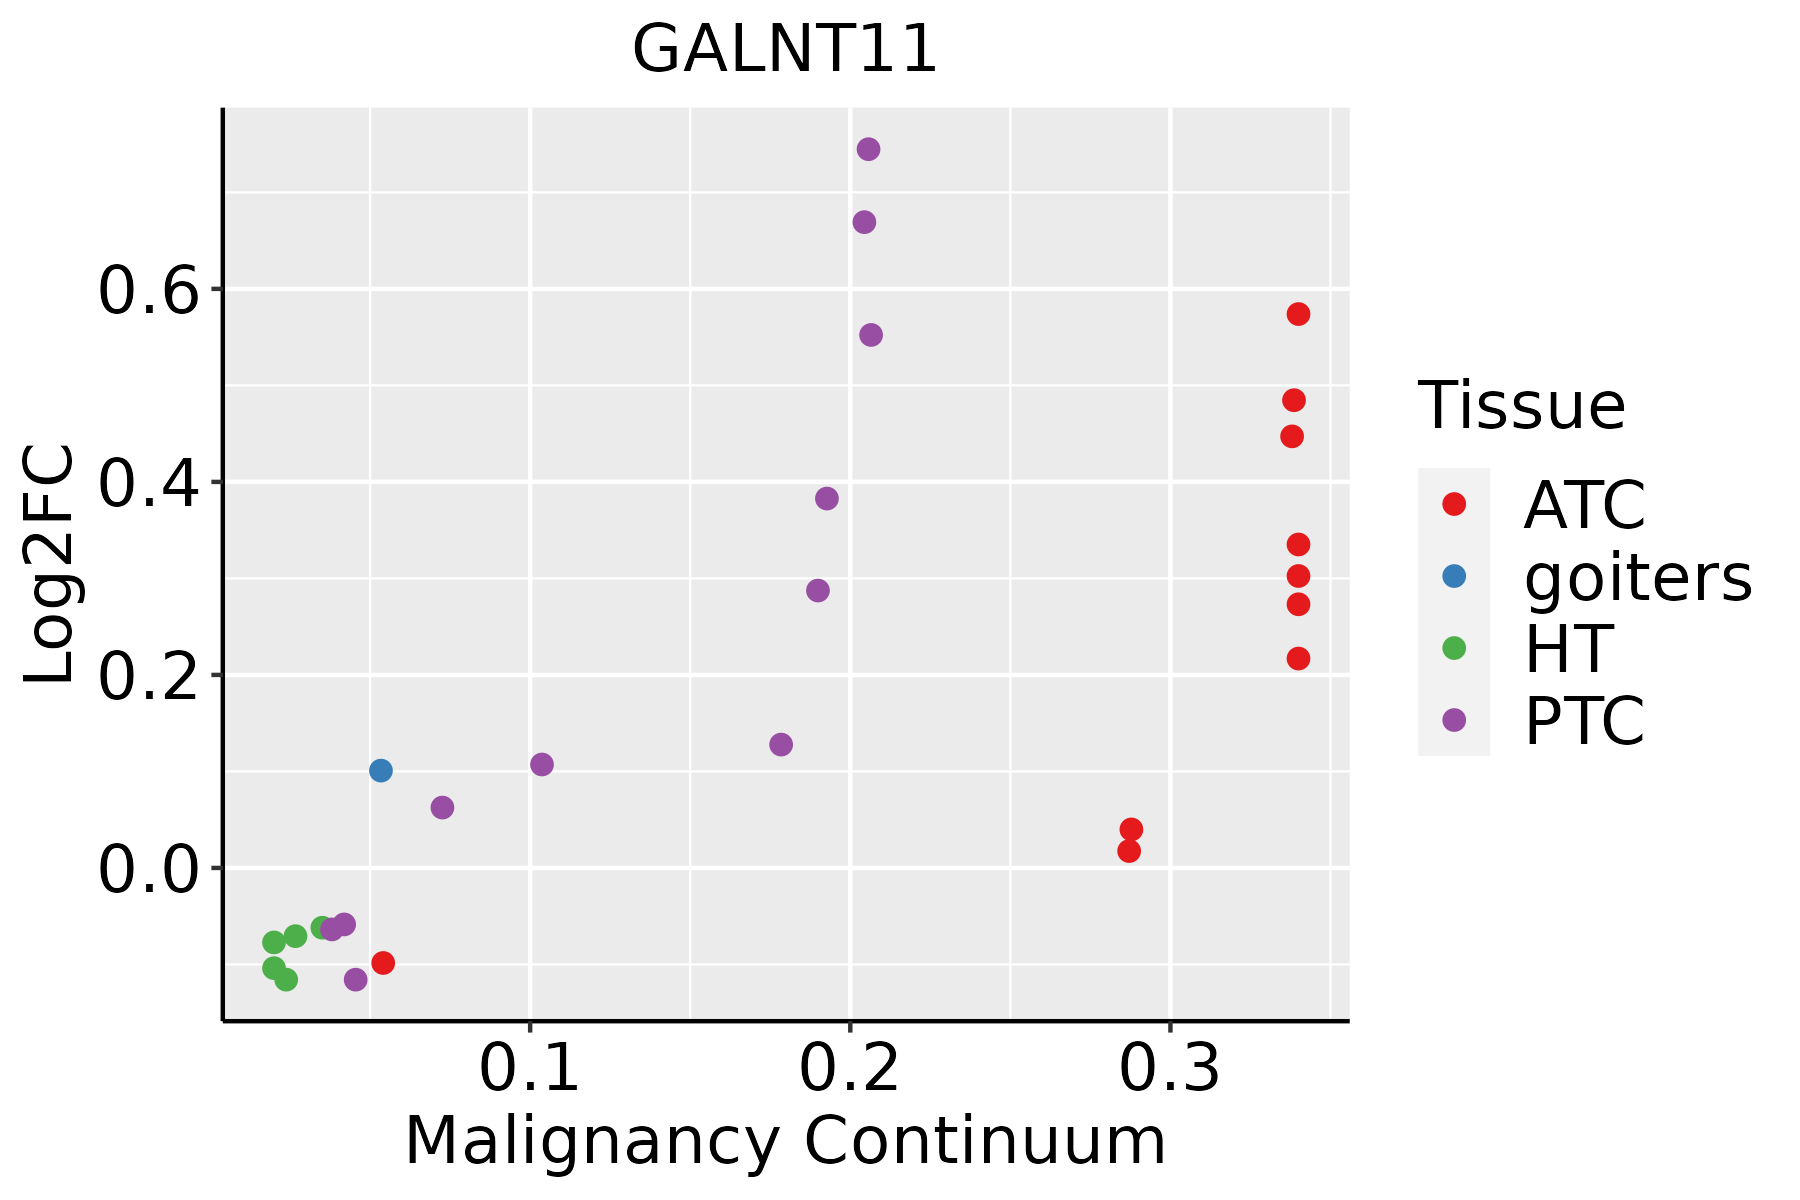 | ATC: Anaplastic thyroid cancer |
| HT: Hashimoto's thyroiditis | ||
| PTC: Papillary thyroid cancer |
| ∗log2FC in expression of this searched gene in stem-like cells from each diseased tissue sample relative to stem-like cells in normal samples in each tissue plotted against the malignancy continuum. Samples are colored based on if they are from different disease stage. |
Top |
Malignant transformation related pathway analysis |
| Find out the enriched GO biological processes and KEGG pathways involved in transition from healthy to precancer to cancer |
| Tissue | Disease Stage | Enriched GO biological Processes |
| Colorectum | AD |  |
| Colorectum | SER |  |
| Colorectum | MSS |  |
| Colorectum | MSI-H |  |
| Colorectum | FAP |  |
| ∗Top 15 enriched GO BP terms are showed in the bar plot of each disease state in each tissue. Each row represents a significant GO biological process which is colored according to the -log10(p.adjust). |
| Page: 1 2 3 4 5 6 7 8 9 |
| GO ID | Tissue | Disease Stage | Description | Gene Ratio | Bg Ratio | pvalue | p.adjust | Count |
| GO:00091002 | Esophagus | ESCC | glycoprotein metabolic process | 226/8552 | 387/18723 | 2.64e-07 | 3.94e-06 | 226 |
| GO:00700854 | Esophagus | ESCC | glycosylation | 144/8552 | 240/18723 | 5.12e-06 | 5.38e-05 | 144 |
| GO:00064865 | Esophagus | ESCC | protein glycosylation | 135/8552 | 226/18723 | 1.36e-05 | 1.24e-04 | 135 |
| GO:00434135 | Esophagus | ESCC | macromolecule glycosylation | 135/8552 | 226/18723 | 1.36e-05 | 1.24e-04 | 135 |
| GO:00072197 | Esophagus | ESCC | Notch signaling pathway | 106/8552 | 172/18723 | 1.74e-05 | 1.55e-04 | 106 |
| GO:00091012 | Esophagus | ESCC | glycoprotein biosynthetic process | 181/8552 | 317/18723 | 2.54e-05 | 2.15e-04 | 181 |
| GO:00085935 | Esophagus | ESCC | regulation of Notch signaling pathway | 59/8552 | 95/18723 | 9.12e-04 | 4.65e-03 | 59 |
| GO:00064931 | Esophagus | ESCC | protein O-linked glycosylation | 51/8552 | 86/18723 | 7.54e-03 | 2.70e-02 | 51 |
| GO:001821010 | Esophagus | ESCC | peptidyl-threonine modification | 70/8552 | 125/18723 | 1.29e-02 | 4.25e-02 | 70 |
| GO:00182105 | Lung | IAC | peptidyl-threonine modification | 33/2061 | 125/18723 | 1.22e-06 | 6.43e-05 | 33 |
| GO:0060271 | Lung | IAC | cilium assembly | 55/2061 | 337/18723 | 1.84e-03 | 1.88e-02 | 55 |
| GO:00085932 | Lung | IAC | regulation of Notch signaling pathway | 20/2061 | 95/18723 | 3.15e-03 | 2.75e-02 | 20 |
| GO:0044782 | Lung | IAC | cilium organization | 58/2061 | 368/18723 | 3.15e-03 | 2.75e-02 | 58 |
| GO:001821012 | Lung | AIS | peptidyl-threonine modification | 30/1849 | 125/18723 | 3.29e-06 | 1.74e-04 | 30 |
| GO:00085931 | Lung | AIS | regulation of Notch signaling pathway | 20/1849 | 95/18723 | 8.52e-04 | 1.17e-02 | 20 |
| GO:00072193 | Lung | AIS | Notch signaling pathway | 29/1849 | 172/18723 | 2.93e-03 | 2.92e-02 | 29 |
| GO:0006493 | Lung | AIS | protein O-linked glycosylation | 17/1849 | 86/18723 | 4.04e-03 | 3.65e-02 | 17 |
| GO:00064863 | Lung | AIS | protein glycosylation | 35/1849 | 226/18723 | 4.93e-03 | 4.27e-02 | 35 |
| GO:00434133 | Lung | AIS | macromolecule glycosylation | 35/1849 | 226/18723 | 4.93e-03 | 4.27e-02 | 35 |
| GO:00072196 | Oral cavity | OSCC | Notch signaling pathway | 92/7305 | 172/18723 | 7.84e-05 | 6.08e-04 | 92 |
| Page: 1 2 |
| Pathway ID | Tissue | Disease Stage | Description | Gene Ratio | Bg Ratio | pvalue | p.adjust | qvalue | Count |
| Page: 1 |
Top |
Cell-cell communication analysis |
| Identification of potential cell-cell interactions between two cell types and their ligand-receptor pairs for different disease states |
| Ligand | Receptor | LRpair | Pathway | Tissue | Disease Stage |
| Page: 1 |
Top |
Single-cell gene regulatory network inference analysis |
| Find out the significant the regulons (TFs) and the target genes of each regulon across cell types for different disease states |
| TF | Cell Type | Tissue | Disease Stage | Target Gene | RSS | Regulon Activity |
| ∗The dot plots of a searched regulon are shown for all cell subpopulations in each disease state of each tissue based on the regulon specific score inferred using pySCENIC and by calculating the average expression. |
| Page: 1 |
Top |
Somatic mutation of malignant transformation related genes |
| Annotation of somatic variants for genes involved in malignant transformation |
| Hugo Symbol | Variant Class | Variant Classification | dbSNP RS | HGVSc | HGVSp | HGVSp Short | SWISSPROT | BIOTYPE | SIFT | PolyPhen | Tumor Sample Barcode | Tissue | Histology | Sex | Age | Stage | Therapy Types | Drugs | Outcome |
| GALNT11 | SNV | Missense_Mutation | novel | c.1739N>A | p.Arg580Lys | p.R580K | Q8NCW6 | protein_coding | tolerated(1) | benign(0) | TCGA-5L-AAT1-01 | Breast | breast invasive carcinoma | Female | <65 | III/IV | Hormone Therapy | letrozol | SD |
| GALNT11 | SNV | Missense_Mutation | rs776670404 | c.541C>T | p.His181Tyr | p.H181Y | Q8NCW6 | protein_coding | tolerated(1) | benign(0) | TCGA-A8-A07U-01 | Breast | breast invasive carcinoma | Female | >=65 | III/IV | Chemotherapy | 5-fluorouracil | SD |
| GALNT11 | SNV | Missense_Mutation | c.942N>T | p.Glu314Asp | p.E314D | Q8NCW6 | protein_coding | tolerated(0.29) | benign(0.011) | TCGA-BH-A0HA-01 | Breast | breast invasive carcinoma | Female | <65 | I/II | Unknown | Unknown | SD | |
| GALNT11 | SNV | Missense_Mutation | c.298A>G | p.Met100Val | p.M100V | Q8NCW6 | protein_coding | tolerated(0.06) | benign(0.007) | TCGA-D8-A142-01 | Breast | breast invasive carcinoma | Female | >=65 | I/II | Chemotherapy | cyclophosphamid | SD | |
| GALNT11 | SNV | Missense_Mutation | novel | c.766N>G | p.Gln256Glu | p.Q256E | Q8NCW6 | protein_coding | tolerated(0.74) | benign(0.035) | TCGA-E2-A152-01 | Breast | breast invasive carcinoma | Female | <65 | I/II | Targeted Molecular therapy | trastuzumab | PD |
| GALNT11 | SNV | Missense_Mutation | rs766807653 | c.1168N>A | p.Glu390Lys | p.E390K | Q8NCW6 | protein_coding | tolerated(0.4) | benign(0.048) | TCGA-EW-A1OZ-01 | Breast | breast invasive carcinoma | Female | <65 | I/II | Targeted Molecular therapy | trastuzumab | SD |
| GALNT11 | SNV | Missense_Mutation | rs550164832 | c.1774G>A | p.Ala592Thr | p.A592T | Q8NCW6 | protein_coding | tolerated(0.44) | benign(0.003) | TCGA-2W-A8YY-01 | Cervix | cervical & endocervical cancer | Female | <65 | I/II | Chemotherapy | cisplatin | CR |
| GALNT11 | SNV | Missense_Mutation | rs375106713 | c.1295G>A | p.Arg432His | p.R432H | Q8NCW6 | protein_coding | deleterious(0.02) | benign(0.297) | TCGA-C5-A2M2-01 | Cervix | cervical & endocervical cancer | Female | <65 | I/II | Unknown | Unknown | SD |
| GALNT11 | SNV | Missense_Mutation | novel | c.353N>T | p.Ala118Val | p.A118V | Q8NCW6 | protein_coding | deleterious(0) | possibly_damaging(0.493) | TCGA-C5-A8ZZ-01 | Cervix | cervical & endocervical cancer | Female | <65 | I/II | Unspecific | Cisplatin | SD |
| GALNT11 | SNV | Missense_Mutation | rs753195277 | c.698C>T | p.Ala233Val | p.A233V | Q8NCW6 | protein_coding | deleterious(0) | probably_damaging(0.999) | TCGA-EK-A2RJ-01 | Cervix | cervical & endocervical cancer | Female | <65 | I/II | Unknown | Unknown | SD |
| Page: 1 2 3 4 5 6 7 |
Top |
Related drugs of malignant transformation related genes |
| Identification of chemicals and drugs interact with genes involved in malignant transfromation |
| (DGIdb 4.0) |
| Entrez ID | Symbol | Category | Interaction Types | Drug Claim Name | Drug Name | PMIDs |
| Page: 1 |

Copyright 2023-Present -The University of Texas Health Science Center at Houston |