
|
|||||
|
 | |
| |
| |
| |
| |
| |
|
Gene: GALNT10 |
Gene summary for GALNT10 |
| Gene information | Species | Human | Gene symbol | GALNT10 | Gene ID | 55568 |
| Gene name | polypeptide N-acetylgalactosaminyltransferase 10 | |
| Gene Alias | GALNACT10 | |
| Cytomap | 5q33.2 | |
| Gene Type | protein-coding | GO ID | GO:0006464 | UniProtAcc | Q86SR1 |
Top |
Malignant transformation analysis |
| Identification of the aberrant gene expression in precancerous and cancerous lesions by comparing the gene expression of stem-like cells in diseased tissues with normal stem cells |
| Entrez ID | Symbol | Replicates | Species | Organ | Tissue | Adj P-value | Log2FC | Malignancy |
| 55568 | GALNT10 | HTA11_1938_2000001011 | Human | Colorectum | AD | 7.02e-07 | 5.51e-01 | -0.0811 |
| 55568 | GALNT10 | HTA11_347_2000001011 | Human | Colorectum | AD | 6.86e-05 | 3.27e-01 | -0.1954 |
| 55568 | GALNT10 | HTA11_1391_2000001011 | Human | Colorectum | AD | 1.53e-08 | 6.51e-01 | -0.059 |
| 55568 | GALNT10 | HTA11_99999971662_82457 | Human | Colorectum | MSS | 3.50e-07 | 6.65e-01 | 0.3859 |
| 55568 | GALNT10 | A002-C-010 | Human | Colorectum | FAP | 1.68e-03 | 3.10e-01 | 0.242 |
| 55568 | GALNT10 | A015-C-203 | Human | Colorectum | FAP | 1.73e-09 | -1.76e-01 | -0.1294 |
| 55568 | GALNT10 | A002-C-201 | Human | Colorectum | FAP | 1.06e-02 | 1.90e-01 | 0.0324 |
| 55568 | GALNT10 | A002-C-203 | Human | Colorectum | FAP | 4.65e-02 | 3.77e-01 | 0.2786 |
| 55568 | GALNT10 | A001-C-119 | Human | Colorectum | FAP | 1.32e-02 | -2.82e-01 | -0.1557 |
| 55568 | GALNT10 | A001-C-108 | Human | Colorectum | FAP | 4.18e-03 | -1.14e-02 | -0.0272 |
| 55568 | GALNT10 | A002-C-205 | Human | Colorectum | FAP | 1.08e-03 | -9.97e-02 | -0.1236 |
| 55568 | GALNT10 | A015-C-006 | Human | Colorectum | FAP | 8.11e-03 | -1.28e-01 | -0.0994 |
| 55568 | GALNT10 | A015-C-106 | Human | Colorectum | FAP | 2.89e-02 | -8.98e-03 | -0.0511 |
| 55568 | GALNT10 | A002-C-114 | Human | Colorectum | FAP | 8.90e-04 | -1.14e-01 | -0.1561 |
| 55568 | GALNT10 | A015-C-104 | Human | Colorectum | FAP | 2.10e-10 | -1.40e-01 | -0.1899 |
| 55568 | GALNT10 | A001-C-014 | Human | Colorectum | FAP | 1.54e-02 | -4.64e-03 | 0.0135 |
| 55568 | GALNT10 | A002-C-016 | Human | Colorectum | FAP | 5.03e-06 | -4.20e-02 | 0.0521 |
| 55568 | GALNT10 | A002-C-116 | Human | Colorectum | FAP | 4.59e-13 | -1.83e-01 | -0.0452 |
| 55568 | GALNT10 | A014-C-008 | Human | Colorectum | FAP | 2.79e-02 | -1.72e-01 | -0.191 |
| 55568 | GALNT10 | A018-E-020 | Human | Colorectum | FAP | 1.22e-03 | -1.16e-01 | -0.2034 |
| Page: 1 2 3 |
| Tissue | Expression Dynamics | Abbreviation |
| Colorectum (GSE201348) |  | FAP: Familial adenomatous polyposis |
| CRC: Colorectal cancer | ||
| Colorectum (HTA11) |  | AD: Adenomas |
| SER: Sessile serrated lesions | ||
| MSI-H: Microsatellite-high colorectal cancer | ||
| MSS: Microsatellite stable colorectal cancer | ||
| Lung | 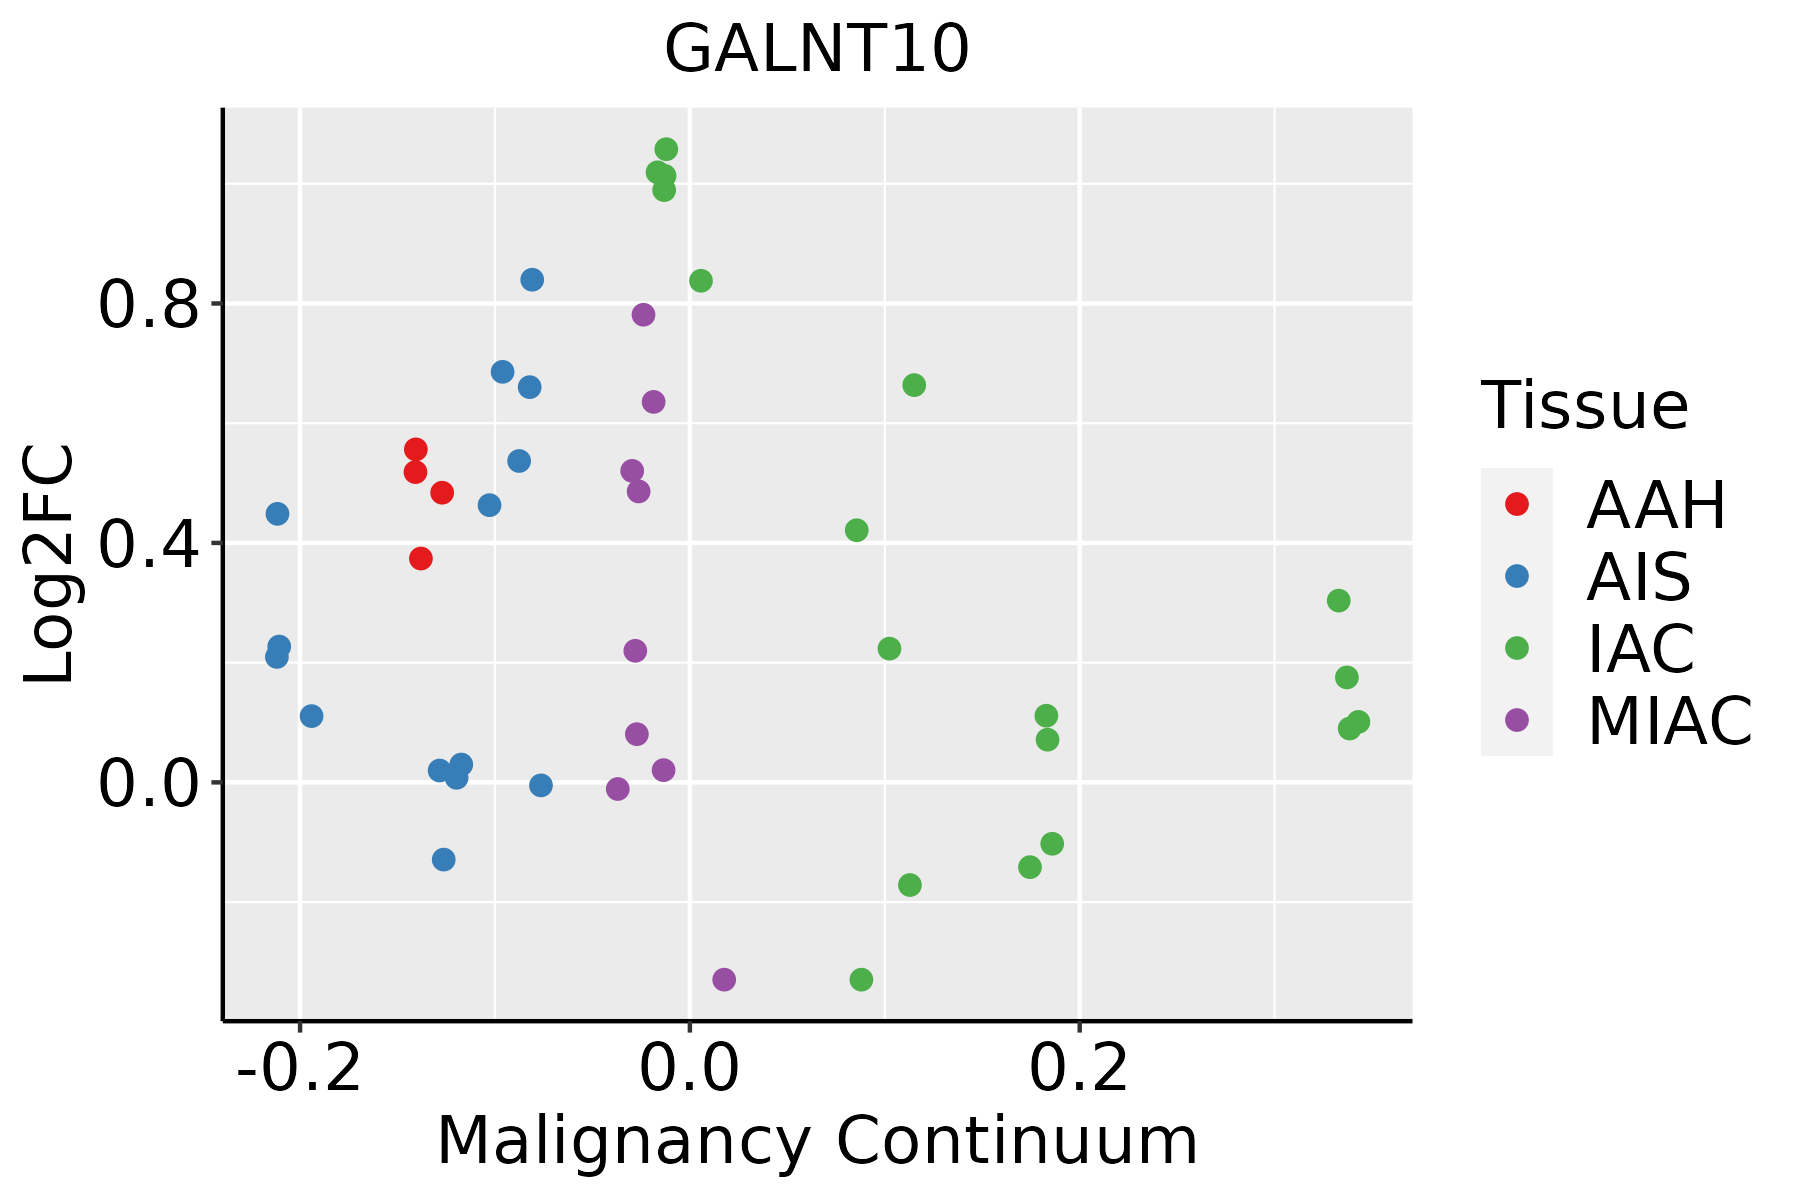 | AAH: Atypical adenomatous hyperplasia |
| AIS: Adenocarcinoma in situ | ||
| IAC: Invasive lung adenocarcinoma | ||
| MIA: Minimally invasive adenocarcinoma | ||
| Thyroid | 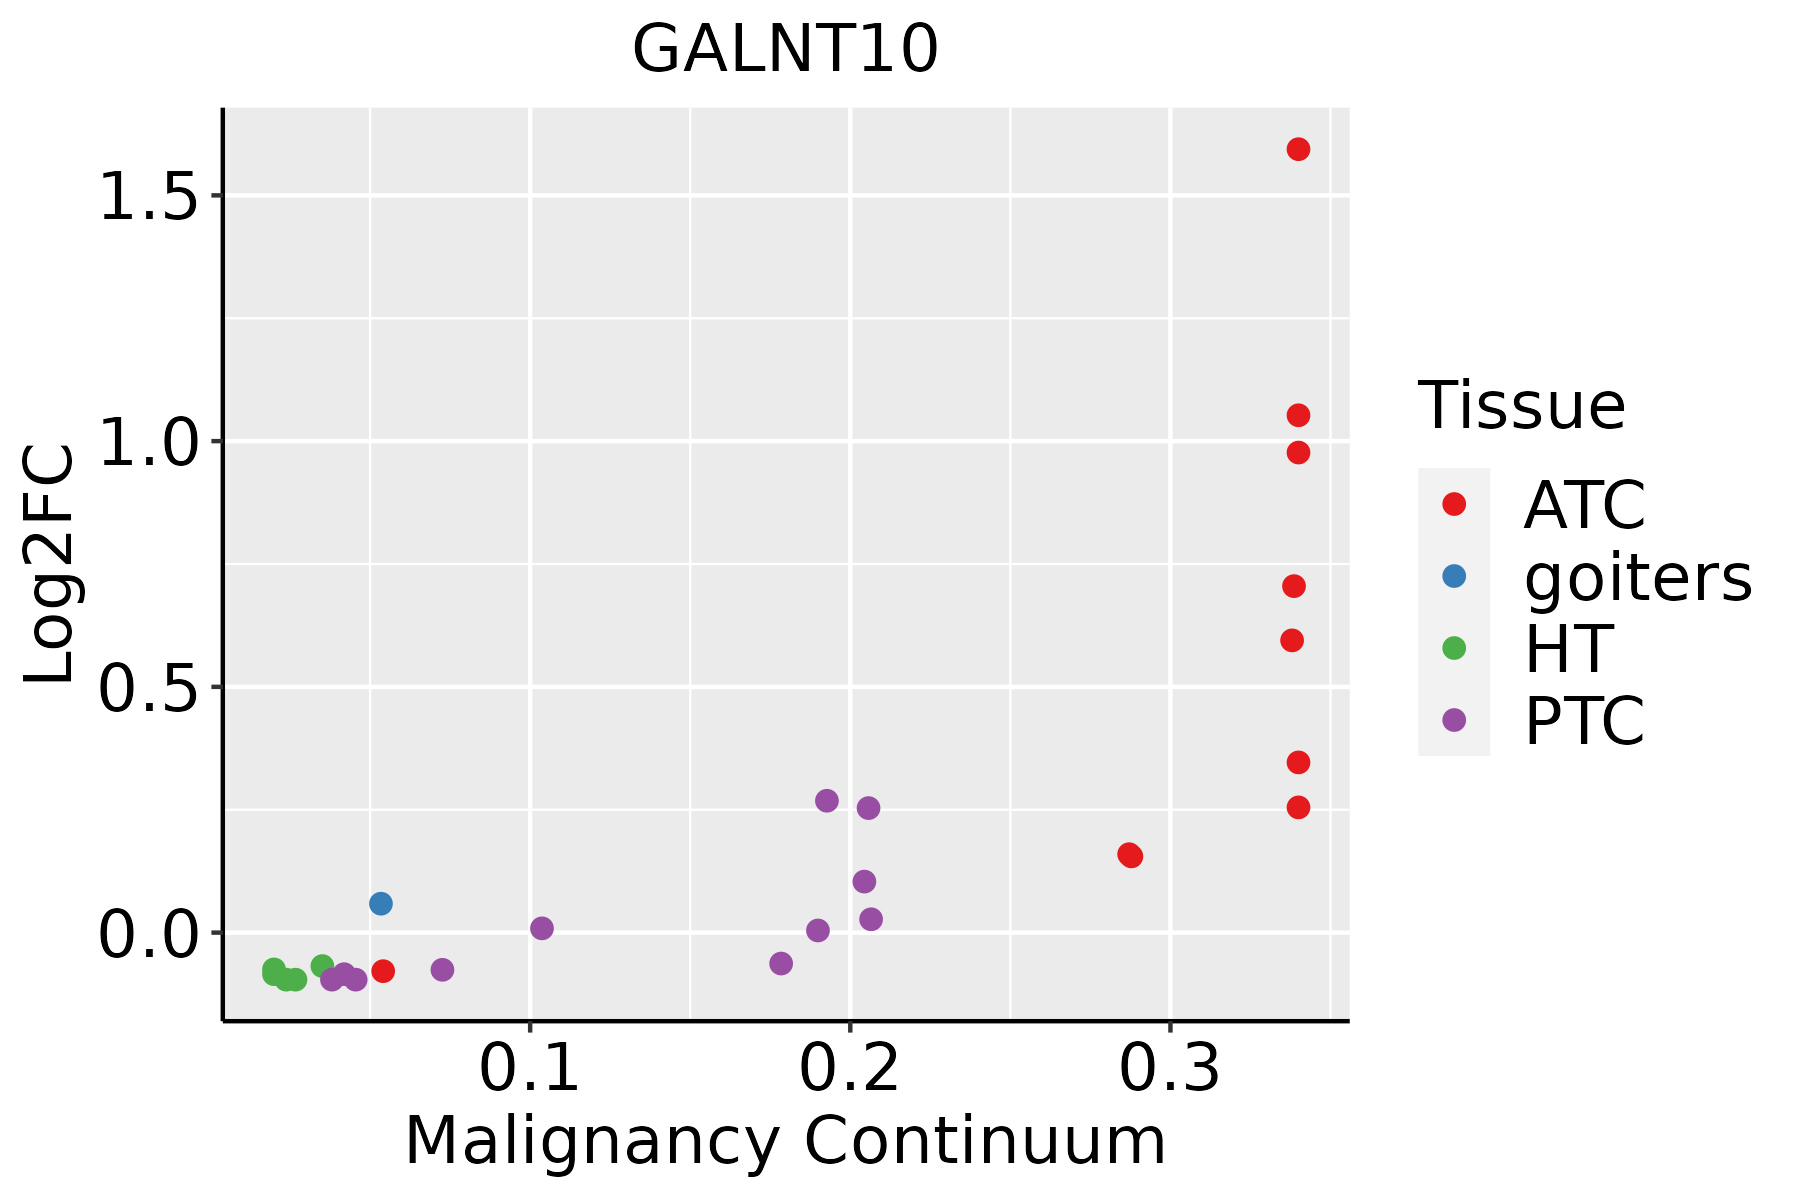 | ATC: Anaplastic thyroid cancer |
| HT: Hashimoto's thyroiditis | ||
| PTC: Papillary thyroid cancer |
| ∗log2FC in expression of this searched gene in stem-like cells from each diseased tissue sample relative to stem-like cells in normal samples in each tissue plotted against the malignancy continuum. Samples are colored based on if they are from different disease stage. |
Top |
Malignant transformation related pathway analysis |
| Find out the enriched GO biological processes and KEGG pathways involved in transition from healthy to precancer to cancer |
| Tissue | Disease Stage | Enriched GO biological Processes |
| Colorectum | AD |  |
| Colorectum | SER |  |
| Colorectum | MSS |  |
| Colorectum | MSI-H |  |
| Colorectum | FAP |  |
| ∗Top 15 enriched GO BP terms are showed in the bar plot of each disease state in each tissue. Each row represents a significant GO biological process which is colored according to the -log10(p.adjust). |
| Page: 1 2 3 4 5 6 7 8 9 |
| GO ID | Tissue | Disease Stage | Description | Gene Ratio | Bg Ratio | pvalue | p.adjust | Count |
| GO:0006486 | Colorectum | AD | protein glycosylation | 64/3918 | 226/18723 | 4.86e-03 | 3.27e-02 | 64 |
| GO:0043413 | Colorectum | AD | macromolecule glycosylation | 64/3918 | 226/18723 | 4.86e-03 | 3.27e-02 | 64 |
| GO:0070085 | Colorectum | AD | glycosylation | 67/3918 | 240/18723 | 5.78e-03 | 3.67e-02 | 67 |
| GO:00064861 | Colorectum | FAP | protein glycosylation | 48/2622 | 226/18723 | 1.85e-03 | 1.57e-02 | 48 |
| GO:00434131 | Colorectum | FAP | macromolecule glycosylation | 48/2622 | 226/18723 | 1.85e-03 | 1.57e-02 | 48 |
| GO:00700851 | Colorectum | FAP | glycosylation | 50/2622 | 240/18723 | 2.30e-03 | 1.85e-02 | 50 |
| GO:0009101 | Colorectum | FAP | glycoprotein biosynthetic process | 63/2622 | 317/18723 | 2.31e-03 | 1.86e-02 | 63 |
| GO:0006493 | Lung | AIS | protein O-linked glycosylation | 17/1849 | 86/18723 | 4.04e-03 | 3.65e-02 | 17 |
| GO:00064863 | Lung | AIS | protein glycosylation | 35/1849 | 226/18723 | 4.93e-03 | 4.27e-02 | 35 |
| GO:00434133 | Lung | AIS | macromolecule glycosylation | 35/1849 | 226/18723 | 4.93e-03 | 4.27e-02 | 35 |
| GO:00064866 | Thyroid | PTC | protein glycosylation | 94/5968 | 226/18723 | 1.25e-03 | 7.13e-03 | 94 |
| GO:00434136 | Thyroid | PTC | macromolecule glycosylation | 94/5968 | 226/18723 | 1.25e-03 | 7.13e-03 | 94 |
| GO:00700855 | Thyroid | PTC | glycosylation | 96/5968 | 240/18723 | 4.57e-03 | 2.15e-02 | 96 |
| GO:00091013 | Thyroid | PTC | glycoprotein biosynthetic process | 123/5968 | 317/18723 | 5.05e-03 | 2.33e-02 | 123 |
| GO:00091003 | Thyroid | PTC | glycoprotein metabolic process | 147/5968 | 387/18723 | 5.87e-03 | 2.64e-02 | 147 |
| GO:000648612 | Thyroid | ATC | protein glycosylation | 94/6293 | 226/18723 | 7.11e-03 | 2.82e-02 | 94 |
| GO:004341312 | Thyroid | ATC | macromolecule glycosylation | 94/6293 | 226/18723 | 7.11e-03 | 2.82e-02 | 94 |
| GO:000910011 | Thyroid | ATC | glycoprotein metabolic process | 153/6293 | 387/18723 | 7.90e-03 | 3.06e-02 | 153 |
| Page: 1 |
| Pathway ID | Tissue | Disease Stage | Description | Gene Ratio | Bg Ratio | pvalue | p.adjust | qvalue | Count |
| Page: 1 |
Top |
Cell-cell communication analysis |
| Identification of potential cell-cell interactions between two cell types and their ligand-receptor pairs for different disease states |
| Ligand | Receptor | LRpair | Pathway | Tissue | Disease Stage |
| Page: 1 |
Top |
Single-cell gene regulatory network inference analysis |
| Find out the significant the regulons (TFs) and the target genes of each regulon across cell types for different disease states |
| TF | Cell Type | Tissue | Disease Stage | Target Gene | RSS | Regulon Activity |
| ∗The dot plots of a searched regulon are shown for all cell subpopulations in each disease state of each tissue based on the regulon specific score inferred using pySCENIC and by calculating the average expression. |
| Page: 1 |
Top |
Somatic mutation of malignant transformation related genes |
| Annotation of somatic variants for genes involved in malignant transformation |
| Hugo Symbol | Variant Class | Variant Classification | dbSNP RS | HGVSc | HGVSp | HGVSp Short | SWISSPROT | BIOTYPE | SIFT | PolyPhen | Tumor Sample Barcode | Tissue | Histology | Sex | Age | Stage | Therapy Types | Drugs | Outcome |
| GALNT10 | SNV | Missense_Mutation | rs751497664 | c.1183N>A | p.Glu395Lys | p.E395K | Q86SR1 | protein_coding | deleterious(0.02) | probably_damaging(0.91) | TCGA-5L-AAT1-01 | Breast | breast invasive carcinoma | Female | <65 | III/IV | Hormone Therapy | letrozol | SD |
| GALNT10 | SNV | Missense_Mutation | c.943N>T | p.Pro315Ser | p.P315S | Q86SR1 | protein_coding | deleterious(0) | probably_damaging(1) | TCGA-AC-A23H-01 | Breast | breast invasive carcinoma | Female | >=65 | I/II | Unknown | Unknown | PD | |
| GALNT10 | SNV | Missense_Mutation | novel | c.705N>A | p.Phe235Leu | p.F235L | Q86SR1 | protein_coding | tolerated(0.05) | possibly_damaging(0.843) | TCGA-AN-A046-01 | Breast | breast invasive carcinoma | Female | >=65 | I/II | Unknown | Unknown | SD |
| GALNT10 | SNV | Missense_Mutation | rs751497664 | c.1183N>A | p.Glu395Lys | p.E395K | Q86SR1 | protein_coding | deleterious(0.02) | probably_damaging(0.91) | TCGA-AN-A046-01 | Breast | breast invasive carcinoma | Female | >=65 | I/II | Unknown | Unknown | SD |
| GALNT10 | SNV | Missense_Mutation | rs746426348 | c.662N>A | p.Arg221Gln | p.R221Q | Q86SR1 | protein_coding | deleterious(0) | probably_damaging(1) | TCGA-AA-3510-01 | Colorectum | colon adenocarcinoma | Male | >=65 | I/II | Unknown | Unknown | SD |
| GALNT10 | SNV | Missense_Mutation | rs762822794 | c.416G>A | p.Arg139His | p.R139H | Q86SR1 | protein_coding | tolerated(0.14) | benign(0.115) | TCGA-AA-3715-01 | Colorectum | colon adenocarcinoma | Male | >=65 | I/II | Unknown | Unknown | PD |
| GALNT10 | SNV | Missense_Mutation | novel | c.202N>T | p.Gly68Trp | p.G68W | Q86SR1 | protein_coding | deleterious(0.01) | possibly_damaging(0.887) | TCGA-AA-3947-01 | Colorectum | colon adenocarcinoma | Female | <65 | I/II | Unknown | Unknown | SD |
| GALNT10 | SNV | Missense_Mutation | novel | c.1180N>A | p.Ala394Thr | p.A394T | Q86SR1 | protein_coding | deleterious(0) | probably_damaging(0.951) | TCGA-AA-3947-01 | Colorectum | colon adenocarcinoma | Female | <65 | I/II | Unknown | Unknown | SD |
| GALNT10 | SNV | Missense_Mutation | novel | c.1258N>T | p.Val420Phe | p.V420F | Q86SR1 | protein_coding | deleterious(0.01) | benign(0.305) | TCGA-AA-A01D-01 | Colorectum | colon adenocarcinoma | Female | <65 | III/IV | Chemotherapy | capecitabine | PD |
| GALNT10 | SNV | Missense_Mutation | c.226G>A | p.Asp76Asn | p.D76N | Q86SR1 | protein_coding | tolerated(0.24) | benign(0.001) | TCGA-AA-A022-01 | Colorectum | colon adenocarcinoma | Female | >=65 | I/II | Unknown | Unknown | SD |
| Page: 1 2 3 4 5 6 7 |
Top |
Related drugs of malignant transformation related genes |
| Identification of chemicals and drugs interact with genes involved in malignant transfromation |
| (DGIdb 4.0) |
| Entrez ID | Symbol | Category | Interaction Types | Drug Claim Name | Drug Name | PMIDs |
| Page: 1 |

Copyright 2023-Present -The University of Texas Health Science Center at Houston |