
|
|||||
|
 | |
| |
| |
| |
| |
| |
|
Gene: GALNS |
Gene summary for GALNS |
| Gene information | Species | Human | Gene symbol | GALNS | Gene ID | 2588 |
| Gene name | galactosamine (N-acetyl)-6-sulfatase | |
| Gene Alias | GALNAC6S | |
| Cytomap | 16q24.3 | |
| Gene Type | protein-coding | GO ID | GO:0000323 | UniProtAcc | P34059 |
Top |
Malignant transformation analysis |
| Identification of the aberrant gene expression in precancerous and cancerous lesions by comparing the gene expression of stem-like cells in diseased tissues with normal stem cells |
| Entrez ID | Symbol | Replicates | Species | Organ | Tissue | Adj P-value | Log2FC | Malignancy |
| 2588 | GALNS | LZE4T | Human | Esophagus | ESCC | 2.17e-09 | 2.24e-01 | 0.0811 |
| 2588 | GALNS | LZE8T | Human | Esophagus | ESCC | 2.39e-02 | 9.54e-02 | 0.067 |
| 2588 | GALNS | LZE20T | Human | Esophagus | ESCC | 4.50e-03 | 1.04e-01 | 0.0662 |
| 2588 | GALNS | LZE21D1 | Human | Esophagus | HGIN | 1.22e-02 | 1.91e-01 | 0.0632 |
| 2588 | GALNS | LZE22T | Human | Esophagus | ESCC | 1.29e-05 | 5.01e-01 | 0.068 |
| 2588 | GALNS | LZE24T | Human | Esophagus | ESCC | 2.55e-08 | 2.41e-01 | 0.0596 |
| 2588 | GALNS | LZE21T | Human | Esophagus | ESCC | 1.59e-03 | 2.39e-01 | 0.0655 |
| 2588 | GALNS | P1T-E | Human | Esophagus | ESCC | 5.25e-06 | 2.76e-01 | 0.0875 |
| 2588 | GALNS | P2T-E | Human | Esophagus | ESCC | 4.54e-12 | 2.14e-01 | 0.1177 |
| 2588 | GALNS | P4T-E | Human | Esophagus | ESCC | 6.19e-26 | 4.86e-01 | 0.1323 |
| 2588 | GALNS | P5T-E | Human | Esophagus | ESCC | 1.20e-09 | 2.00e-01 | 0.1327 |
| 2588 | GALNS | P8T-E | Human | Esophagus | ESCC | 3.77e-27 | 4.88e-01 | 0.0889 |
| 2588 | GALNS | P9T-E | Human | Esophagus | ESCC | 8.46e-12 | 2.09e-01 | 0.1131 |
| 2588 | GALNS | P10T-E | Human | Esophagus | ESCC | 6.29e-22 | 3.42e-01 | 0.116 |
| 2588 | GALNS | P11T-E | Human | Esophagus | ESCC | 4.24e-12 | 5.01e-01 | 0.1426 |
| 2588 | GALNS | P12T-E | Human | Esophagus | ESCC | 6.20e-26 | 4.84e-01 | 0.1122 |
| 2588 | GALNS | P15T-E | Human | Esophagus | ESCC | 5.62e-43 | 8.32e-01 | 0.1149 |
| 2588 | GALNS | P16T-E | Human | Esophagus | ESCC | 3.14e-18 | 3.92e-01 | 0.1153 |
| 2588 | GALNS | P17T-E | Human | Esophagus | ESCC | 3.17e-04 | 1.85e-01 | 0.1278 |
| 2588 | GALNS | P19T-E | Human | Esophagus | ESCC | 1.03e-08 | 5.60e-01 | 0.1662 |
| Page: 1 2 3 4 5 6 |
| Tissue | Expression Dynamics | Abbreviation |
| Esophagus | 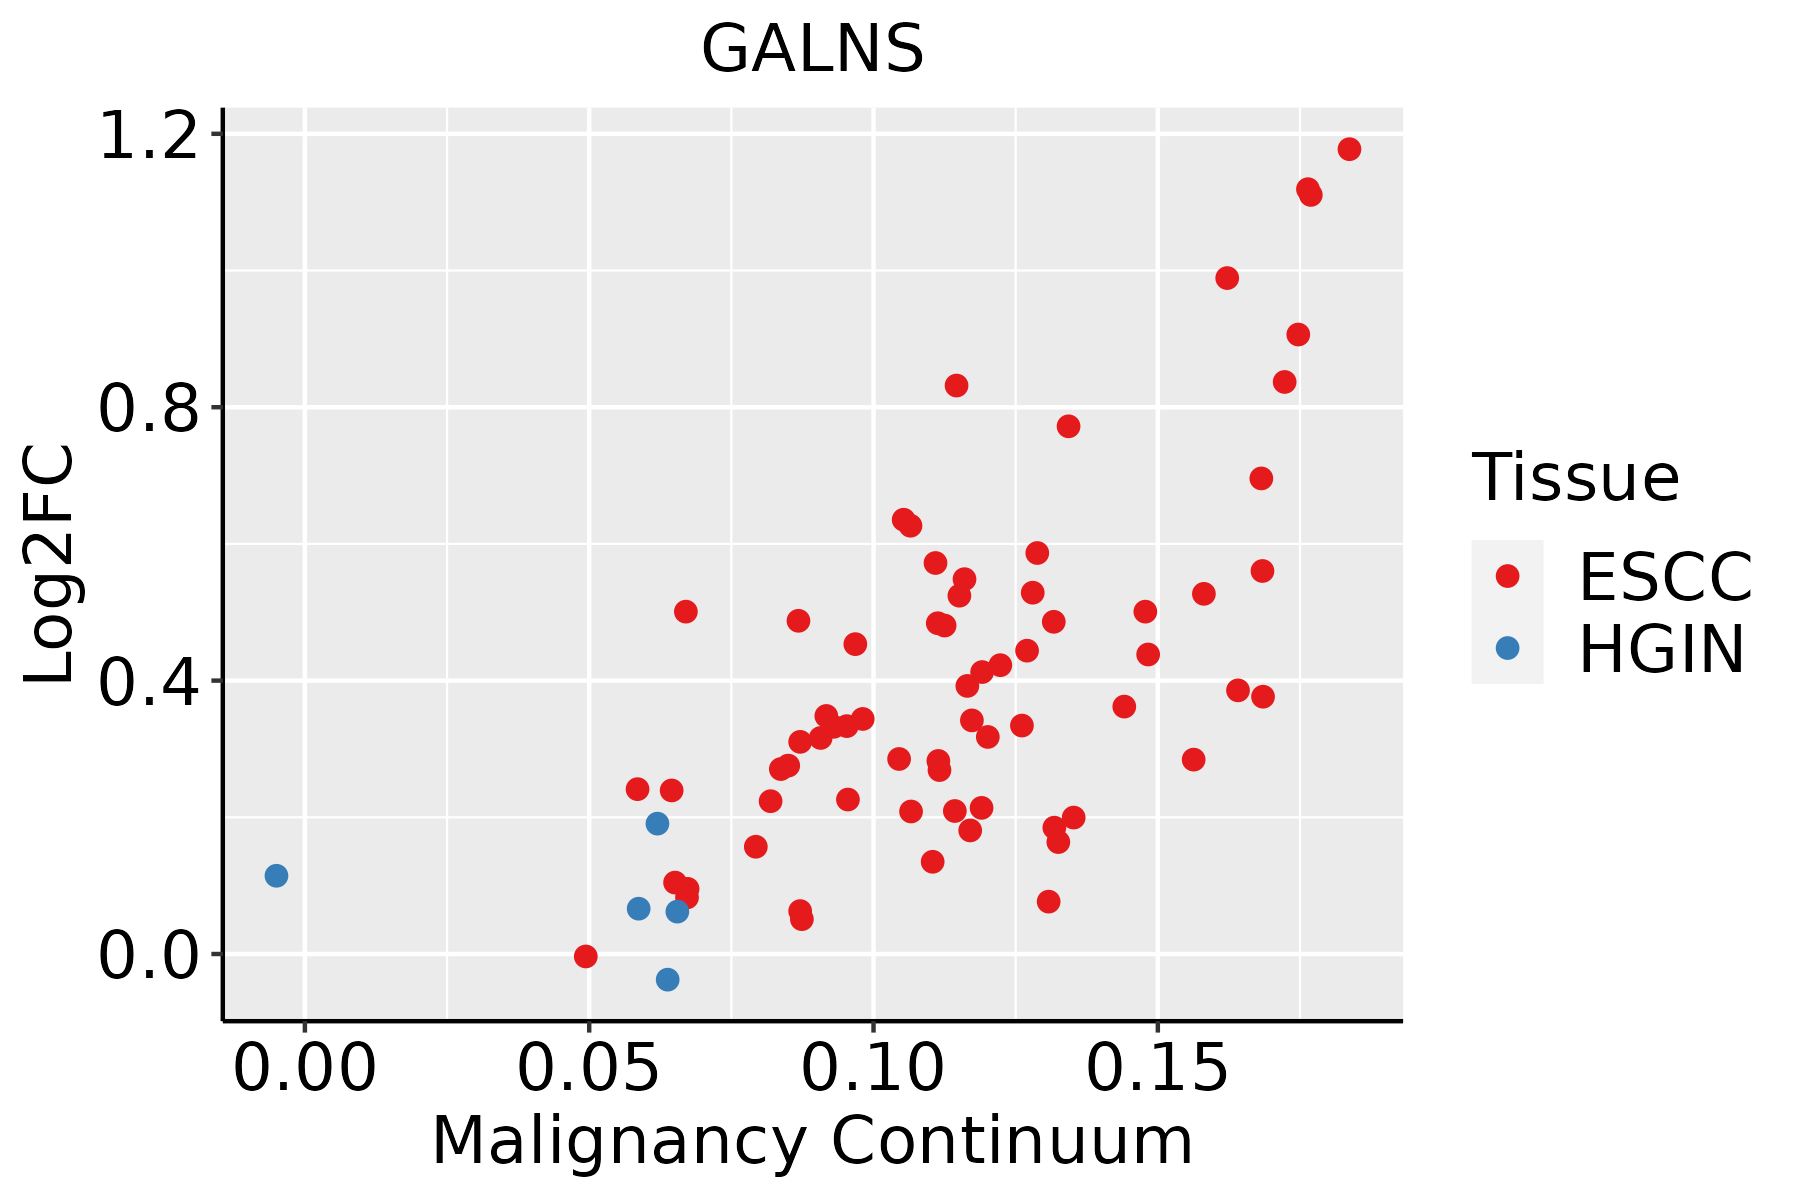 | ESCC: Esophageal squamous cell carcinoma |
| HGIN: High-grade intraepithelial neoplasias | ||
| LGIN: Low-grade intraepithelial neoplasias | ||
| Liver |  | HCC: Hepatocellular carcinoma |
| NAFLD: Non-alcoholic fatty liver disease | ||
| Oral Cavity | 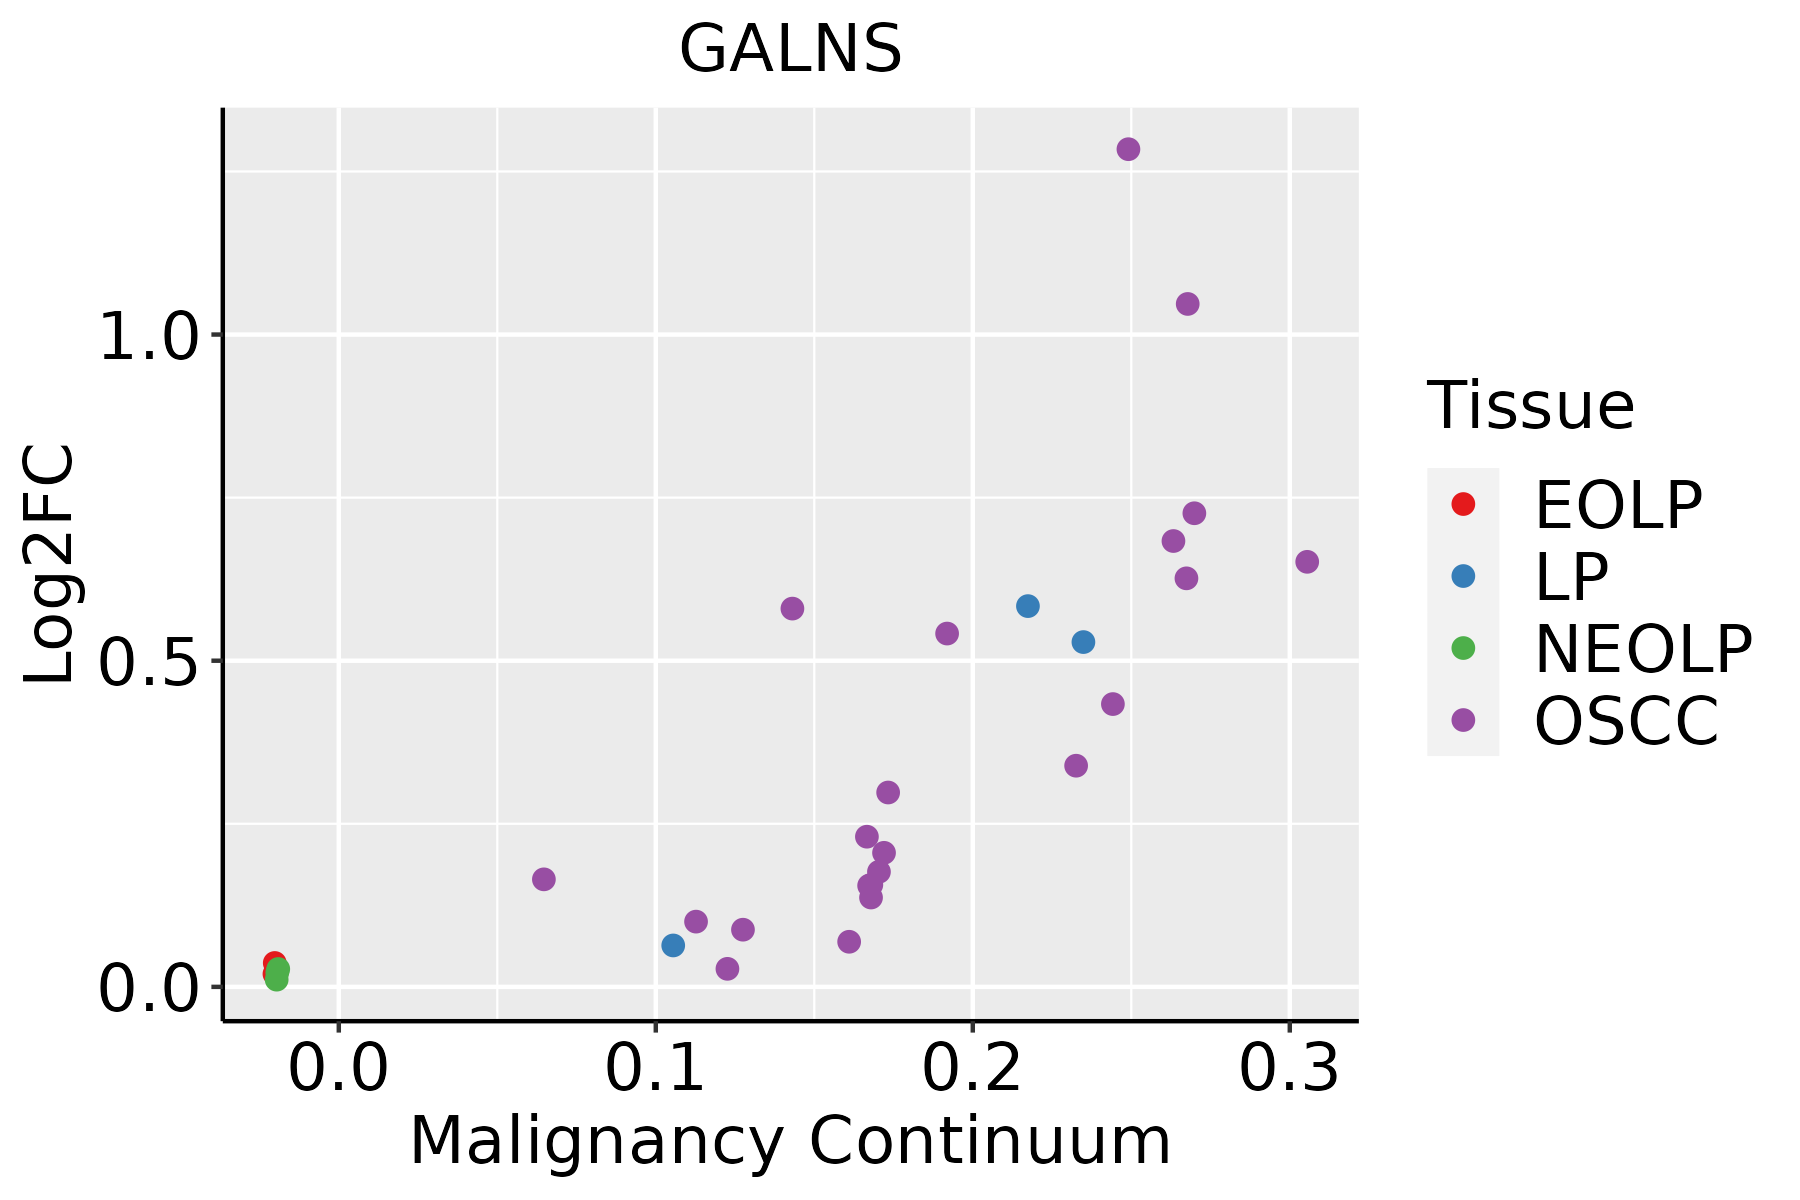 | EOLP: Erosive Oral lichen planus |
| LP: leukoplakia | ||
| NEOLP: Non-erosive oral lichen planus | ||
| OSCC: Oral squamous cell carcinoma | ||
| Thyroid | 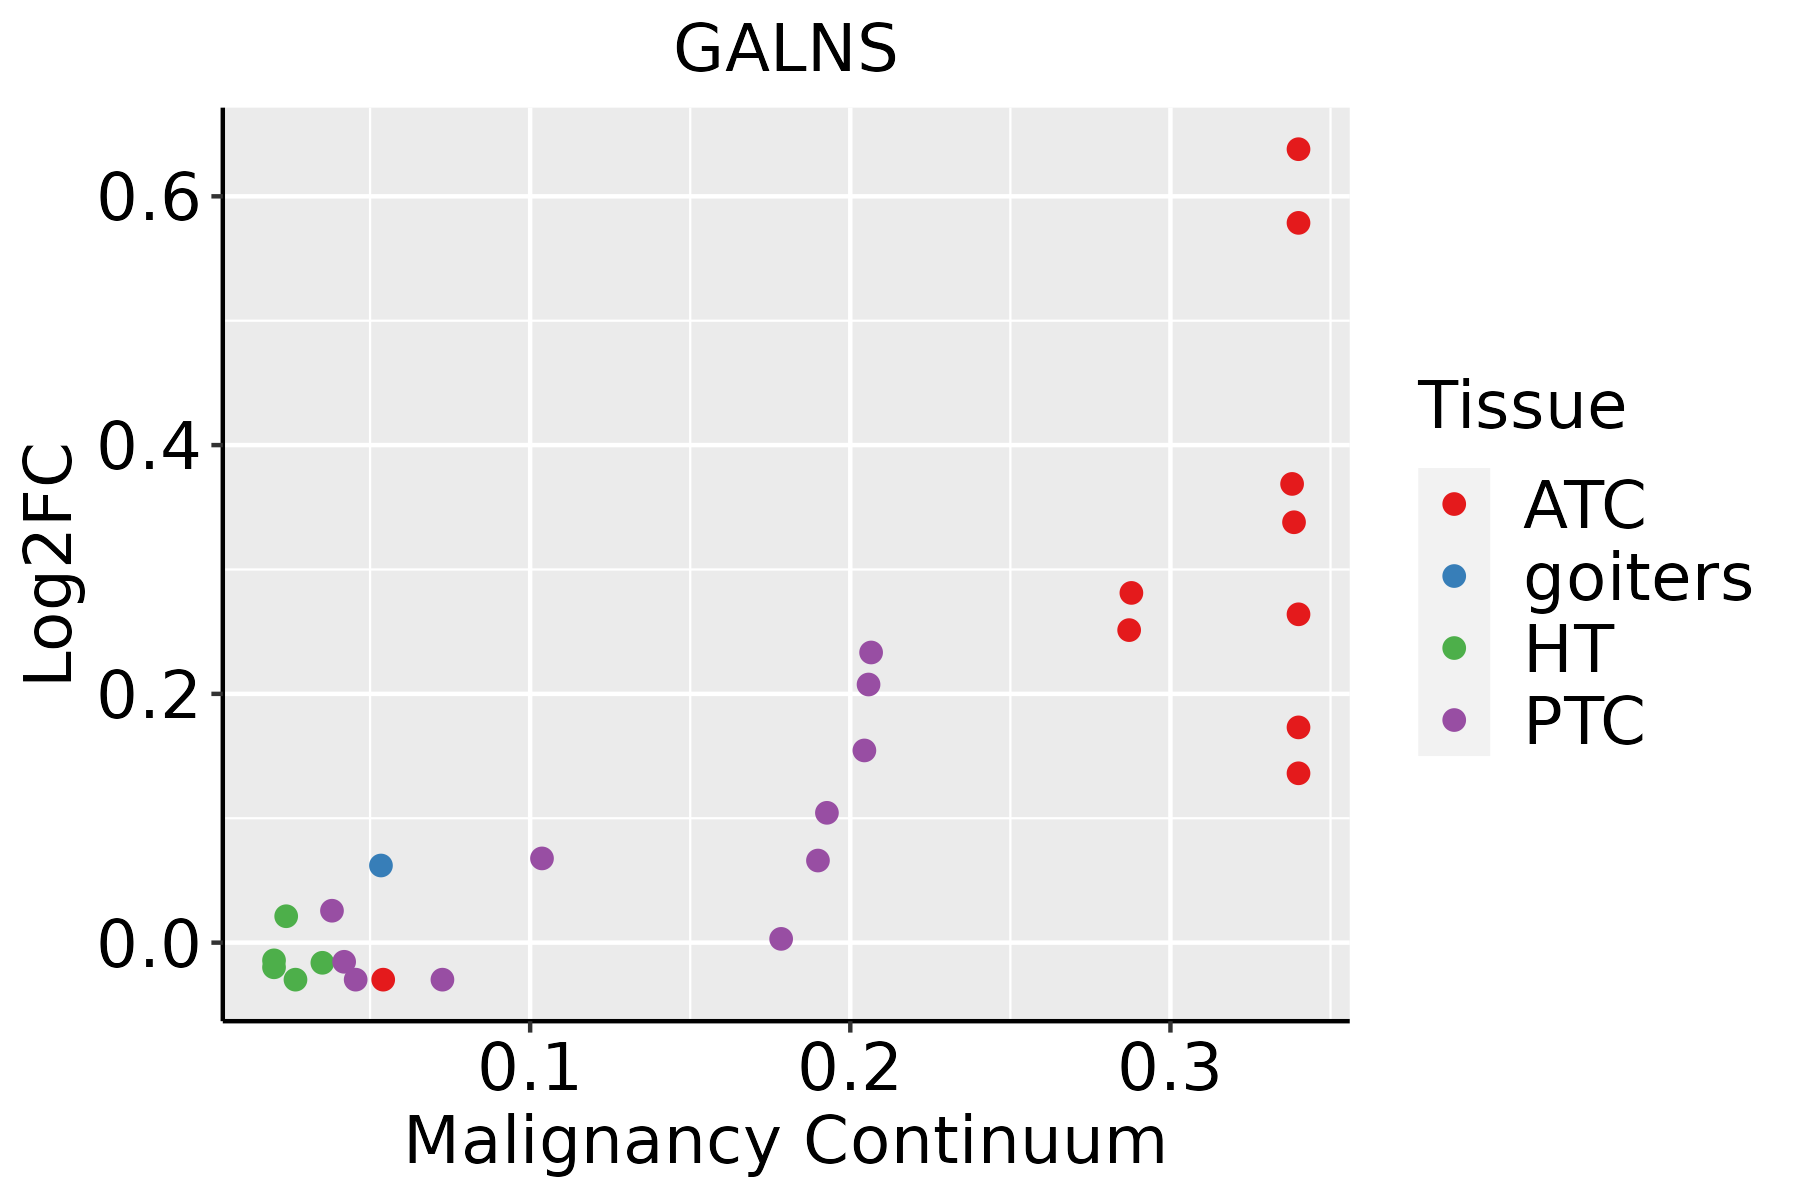 | ATC: Anaplastic thyroid cancer |
| HT: Hashimoto's thyroiditis | ||
| PTC: Papillary thyroid cancer |
| ∗log2FC in expression of this searched gene in stem-like cells from each diseased tissue sample relative to stem-like cells in normal samples in each tissue plotted against the malignancy continuum. Samples are colored based on if they are from different disease stage. |
Top |
Malignant transformation related pathway analysis |
| Find out the enriched GO biological processes and KEGG pathways involved in transition from healthy to precancer to cancer |
| Tissue | Disease Stage | Enriched GO biological Processes |
| Colorectum | AD |  |
| Colorectum | SER |  |
| Colorectum | MSS |  |
| Colorectum | MSI-H |  |
| Colorectum | FAP |  |
| ∗Top 15 enriched GO BP terms are showed in the bar plot of each disease state in each tissue. Each row represents a significant GO biological process which is colored according to the -log10(p.adjust). |
| Page: 1 2 3 4 5 6 7 8 9 |
| GO ID | Tissue | Disease Stage | Description | Gene Ratio | Bg Ratio | pvalue | p.adjust | Count |
| Page: 1 |
| Pathway ID | Tissue | Disease Stage | Description | Gene Ratio | Bg Ratio | pvalue | p.adjust | qvalue | Count |
| hsa041426 | Esophagus | HGIN | Lysosome | 33/1383 | 132/8465 | 6.65e-03 | 4.37e-02 | 3.47e-02 | 33 |
| hsa0414213 | Esophagus | HGIN | Lysosome | 33/1383 | 132/8465 | 6.65e-03 | 4.37e-02 | 3.47e-02 | 33 |
| hsa0414222 | Esophagus | ESCC | Lysosome | 102/4205 | 132/8465 | 5.11e-11 | 7.13e-10 | 3.65e-10 | 102 |
| hsa0414232 | Esophagus | ESCC | Lysosome | 102/4205 | 132/8465 | 5.11e-11 | 7.13e-10 | 3.65e-10 | 102 |
| hsa041422 | Liver | HCC | Lysosome | 100/4020 | 132/8465 | 2.32e-11 | 4.31e-10 | 2.40e-10 | 100 |
| hsa041423 | Liver | HCC | Lysosome | 100/4020 | 132/8465 | 2.32e-11 | 4.31e-10 | 2.40e-10 | 100 |
| hsa041425 | Oral cavity | OSCC | Lysosome | 87/3704 | 132/8465 | 1.97e-07 | 1.35e-06 | 6.86e-07 | 87 |
| hsa0414212 | Oral cavity | OSCC | Lysosome | 87/3704 | 132/8465 | 1.97e-07 | 1.35e-06 | 6.86e-07 | 87 |
| hsa0414221 | Oral cavity | LP | Lysosome | 67/2418 | 132/8465 | 5.13e-08 | 7.77e-07 | 5.01e-07 | 67 |
| hsa0414231 | Oral cavity | LP | Lysosome | 67/2418 | 132/8465 | 5.13e-08 | 7.77e-07 | 5.01e-07 | 67 |
| Page: 1 |
Top |
Cell-cell communication analysis |
| Identification of potential cell-cell interactions between two cell types and their ligand-receptor pairs for different disease states |
| Ligand | Receptor | LRpair | Pathway | Tissue | Disease Stage |
| Page: 1 |
Top |
Single-cell gene regulatory network inference analysis |
| Find out the significant the regulons (TFs) and the target genes of each regulon across cell types for different disease states |
| TF | Cell Type | Tissue | Disease Stage | Target Gene | RSS | Regulon Activity |
| ∗The dot plots of a searched regulon are shown for all cell subpopulations in each disease state of each tissue based on the regulon specific score inferred using pySCENIC and by calculating the average expression. |
| Page: 1 |
Top |
Somatic mutation of malignant transformation related genes |
| Annotation of somatic variants for genes involved in malignant transformation |
| Hugo Symbol | Variant Class | Variant Classification | dbSNP RS | HGVSc | HGVSp | HGVSp Short | SWISSPROT | BIOTYPE | SIFT | PolyPhen | Tumor Sample Barcode | Tissue | Histology | Sex | Age | Stage | Therapy Types | Drugs | Outcome |
| GALNS | SNV | Missense_Mutation | novel | c.857C>A | p.Thr286Lys | p.T286K | P34059 | protein_coding | deleterious(0) | probably_damaging(0.97) | TCGA-A2-A25A-01 | Breast | breast invasive carcinoma | Female | <65 | I/II | Unspecific | Cytoxan | SD |
| GALNS | SNV | Missense_Mutation | c.1528N>A | p.Pro510Thr | p.P510T | P34059 | protein_coding | tolerated_low_confidence(0.34) | benign(0.03) | TCGA-AR-A0TT-01 | Breast | breast invasive carcinoma | Female | <65 | III/IV | Chemotherapy | doxorubicin | SD | |
| GALNS | SNV | Missense_Mutation | c.752N>A | p.Arg251Gln | p.R251Q | P34059 | protein_coding | deleterious(0.03) | possibly_damaging(0.815) | TCGA-EK-A2RC-01 | Cervix | cervical & endocervical cancer | Female | <65 | I/II | Unknown | Unknown | SD | |
| GALNS | SNV | Missense_Mutation | c.943N>C | p.Glu315Gln | p.E315Q | P34059 | protein_coding | deleterious(0) | probably_damaging(0.928) | TCGA-EX-A69L-01 | Cervix | cervical & endocervical cancer | Female | <65 | I/II | Unknown | Unknown | SD | |
| GALNS | SNV | Missense_Mutation | c.1112N>T | p.Thr371Ile | p.T371I | P34059 | protein_coding | tolerated(0.21) | benign(0.03) | TCGA-A6-2684-01 | Colorectum | colon adenocarcinoma | Female | >=65 | I/II | Unknown | Unknown | PD | |
| GALNS | SNV | Missense_Mutation | rs779257235 | c.772N>A | p.Val258Ile | p.V258I | P34059 | protein_coding | tolerated(0.27) | benign(0.098) | TCGA-AA-3821-01 | Colorectum | colon adenocarcinoma | Female | >=65 | I/II | Unknown | Unknown | SD |
| GALNS | SNV | Missense_Mutation | novel | c.251C>T | p.Ala84Val | p.A84V | P34059 | protein_coding | deleterious(0) | probably_damaging(1) | TCGA-AA-3947-01 | Colorectum | colon adenocarcinoma | Female | <65 | I/II | Unknown | Unknown | SD |
| GALNS | SNV | Missense_Mutation | c.1366T>G | p.Phe456Val | p.F456V | P34059 | protein_coding | tolerated(0.64) | benign(0) | TCGA-AA-3977-01 | Colorectum | colon adenocarcinoma | Male | >=65 | I/II | Unknown | Unknown | SD | |
| GALNS | SNV | Missense_Mutation | c.1548N>T | p.Lys516Asn | p.K516N | P34059 | protein_coding | tolerated_low_confidence(0.48) | benign(0.045) | TCGA-AD-6964-01 | Colorectum | colon adenocarcinoma | Male | <65 | III/IV | Chemotherapy | folfox | PD | |
| GALNS | SNV | Missense_Mutation | rs779257235 | c.772G>A | p.Val258Ile | p.V258I | P34059 | protein_coding | tolerated(0.27) | benign(0.098) | TCGA-AZ-6601-01 | Colorectum | colon adenocarcinoma | Male | >=65 | I/II | Unknown | Unknown | PD |
| Page: 1 2 3 4 5 |
Top |
Related drugs of malignant transformation related genes |
| Identification of chemicals and drugs interact with genes involved in malignant transfromation |
| (DGIdb 4.0) |
| Entrez ID | Symbol | Category | Interaction Types | Drug Claim Name | Drug Name | PMIDs |
| 2588 | GALNS | DRUGGABLE GENOME, ENZYME | BMN-110 | ELOSULFASE ALFA | ||
| 2588 | GALNS | DRUGGABLE GENOME, ENZYME | Elosulfase alfa | |||
| 2588 | GALNS | DRUGGABLE GENOME, ENZYME | elosulfase alfa | |||
| 2588 | GALNS | DRUGGABLE GENOME, ENZYME | Elosulfase |
| Page: 1 |

Copyright 2023-Present -The University of Texas Health Science Center at Houston |