
|
|||||
|
 | |
| |
| |
| |
| |
| |
|
Gene: GALM |
Gene summary for GALM |
| Gene information | Species | Human | Gene symbol | GALM | Gene ID | 130589 |
| Gene name | galactose mutarotase | |
| Gene Alias | BLOCK25 | |
| Cytomap | 2p22.1 | |
| Gene Type | protein-coding | GO ID | GO:0005975 | UniProtAcc | Q96C23 |
Top |
Malignant transformation analysis |
| Identification of the aberrant gene expression in precancerous and cancerous lesions by comparing the gene expression of stem-like cells in diseased tissues with normal stem cells |
| Entrez ID | Symbol | Replicates | Species | Organ | Tissue | Adj P-value | Log2FC | Malignancy |
| 130589 | GALM | HTA11_2487_2000001011 | Human | Colorectum | SER | 5.39e-05 | 4.21e-01 | -0.1808 |
| 130589 | GALM | HTA11_78_2000001011 | Human | Colorectum | AD | 6.81e-06 | 4.94e-01 | -0.1088 |
| 130589 | GALM | HTA11_347_2000001011 | Human | Colorectum | AD | 4.73e-20 | 7.40e-01 | -0.1954 |
| 130589 | GALM | HTA11_3361_2000001011 | Human | Colorectum | AD | 4.01e-05 | 4.74e-01 | -0.1207 |
| 130589 | GALM | HTA11_83_2000001011 | Human | Colorectum | SER | 2.91e-11 | 7.93e-01 | -0.1526 |
| 130589 | GALM | HTA11_696_2000001011 | Human | Colorectum | AD | 1.93e-20 | 6.78e-01 | -0.1464 |
| 130589 | GALM | HTA11_866_2000001011 | Human | Colorectum | AD | 6.55e-05 | 3.43e-01 | -0.1001 |
| 130589 | GALM | HTA11_1391_2000001011 | Human | Colorectum | AD | 5.19e-12 | 6.69e-01 | -0.059 |
| 130589 | GALM | HTA11_2992_2000001011 | Human | Colorectum | SER | 1.76e-02 | 5.12e-01 | -0.1706 |
| 130589 | GALM | HTA11_546_2000001011 | Human | Colorectum | AD | 3.18e-04 | 5.97e-01 | -0.0842 |
| 130589 | GALM | HTA11_10623_2000001011 | Human | Colorectum | AD | 3.55e-07 | 7.23e-01 | -0.0177 |
| 130589 | GALM | HTA11_10711_2000001011 | Human | Colorectum | AD | 5.62e-06 | 4.57e-01 | 0.0338 |
| 130589 | GALM | HTA11_7696_3000711011 | Human | Colorectum | AD | 2.60e-05 | 3.24e-01 | 0.0674 |
| 130589 | GALM | HTA11_99999965104_69814 | Human | Colorectum | MSS | 1.89e-03 | 2.35e-01 | 0.281 |
| 130589 | GALM | A015-C-203 | Human | Colorectum | FAP | 1.07e-03 | -1.61e-01 | -0.1294 |
| 130589 | GALM | A002-C-205 | Human | Colorectum | FAP | 7.65e-04 | -1.48e-01 | -0.1236 |
| 130589 | GALM | A015-C-006 | Human | Colorectum | FAP | 3.20e-02 | -1.97e-01 | -0.0994 |
| 130589 | GALM | A015-C-104 | Human | Colorectum | FAP | 4.17e-04 | -9.49e-02 | -0.1899 |
| 130589 | GALM | A015-C-002 | Human | Colorectum | FAP | 4.52e-02 | -1.77e-01 | -0.0763 |
| 130589 | GALM | A002-C-116 | Human | Colorectum | FAP | 3.46e-05 | -1.02e-01 | -0.0452 |
| Page: 1 2 |
| Tissue | Expression Dynamics | Abbreviation |
| Colorectum (GSE201348) |  | FAP: Familial adenomatous polyposis |
| CRC: Colorectal cancer | ||
| Colorectum (HTA11) |  | AD: Adenomas |
| SER: Sessile serrated lesions | ||
| MSI-H: Microsatellite-high colorectal cancer | ||
| MSS: Microsatellite stable colorectal cancer | ||
| Liver | 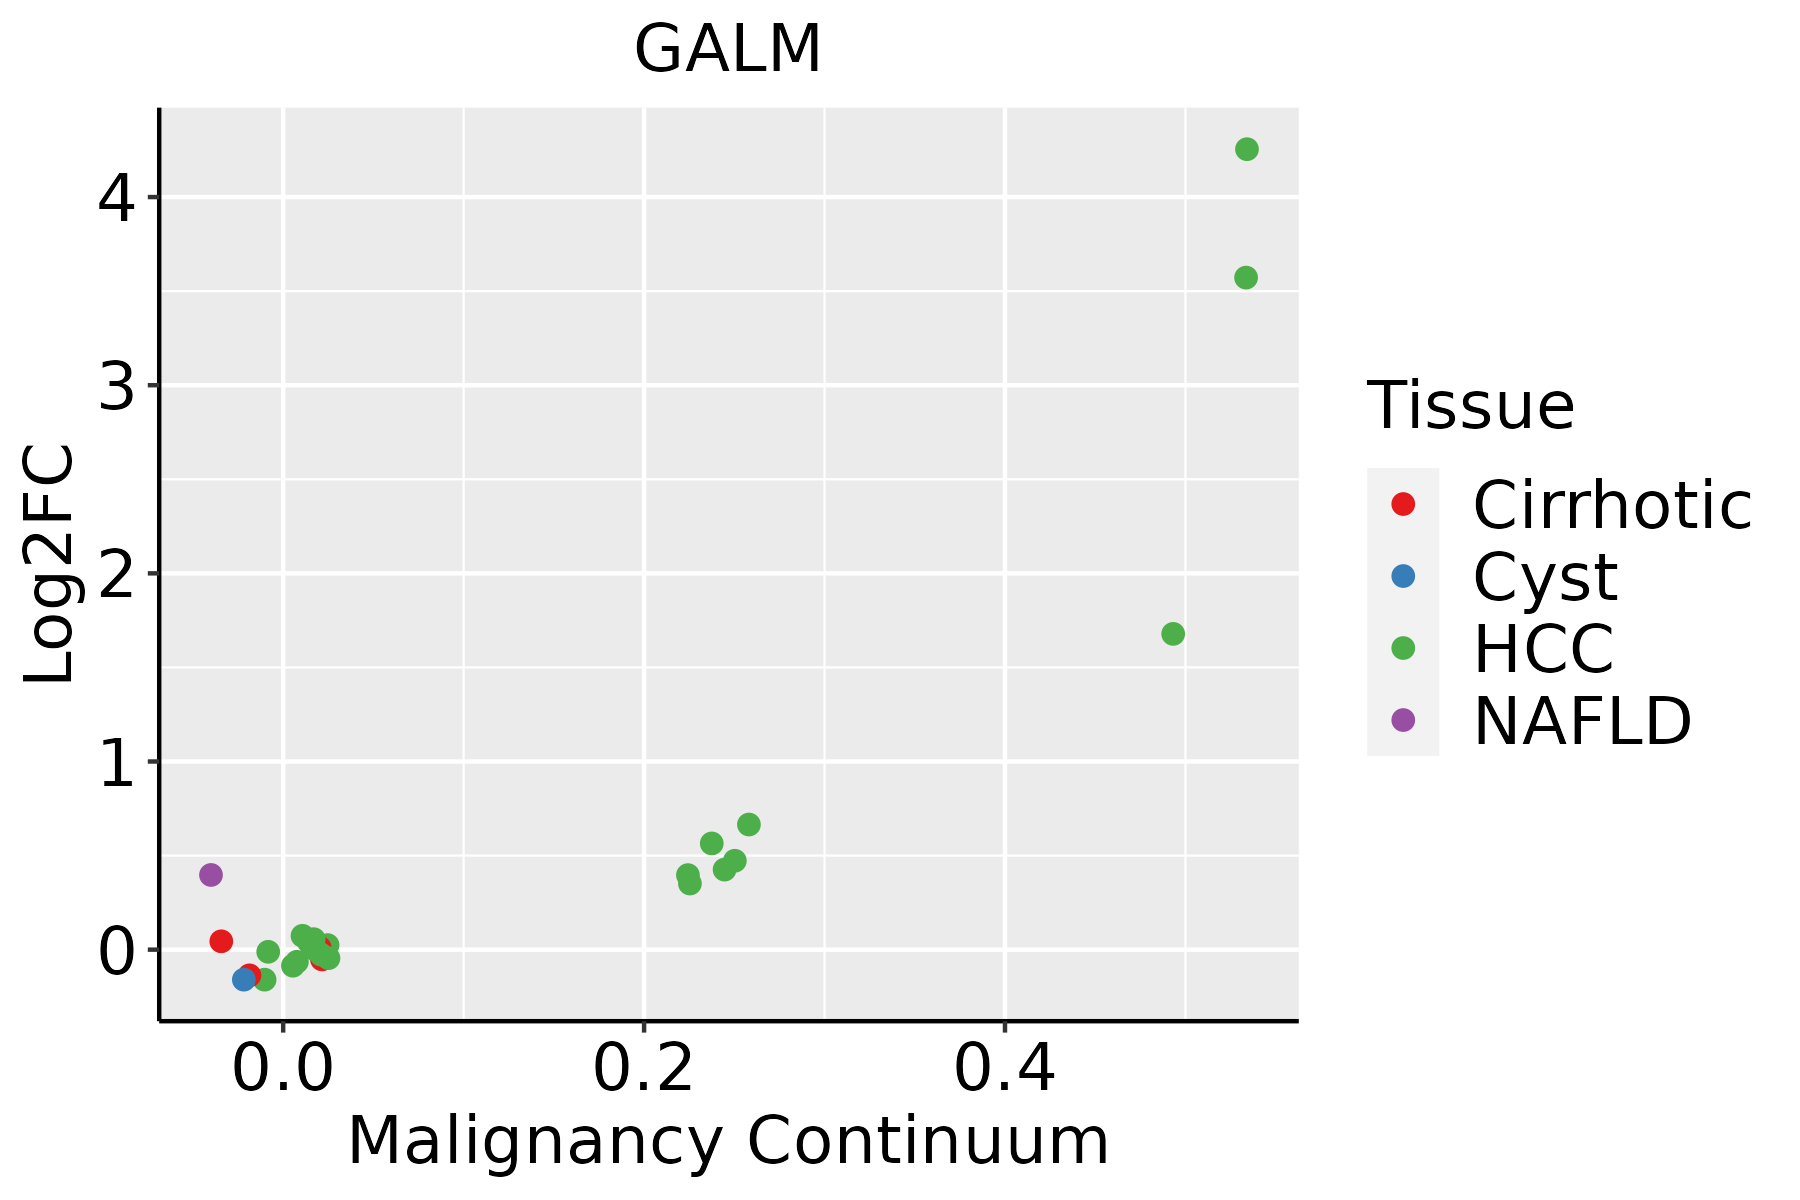 | HCC: Hepatocellular carcinoma |
| NAFLD: Non-alcoholic fatty liver disease |
| ∗log2FC in expression of this searched gene in stem-like cells from each diseased tissue sample relative to stem-like cells in normal samples in each tissue plotted against the malignancy continuum. Samples are colored based on if they are from different disease stage. |
Top |
Malignant transformation related pathway analysis |
| Find out the enriched GO biological processes and KEGG pathways involved in transition from healthy to precancer to cancer |
| Tissue | Disease Stage | Enriched GO biological Processes |
| Colorectum | AD |  |
| Colorectum | SER |  |
| Colorectum | MSS |  |
| Colorectum | MSI-H |  |
| Colorectum | FAP |  |
| ∗Top 15 enriched GO BP terms are showed in the bar plot of each disease state in each tissue. Each row represents a significant GO biological process which is colored according to the -log10(p.adjust). |
| Page: 1 2 3 4 5 6 7 8 9 |
| GO ID | Tissue | Disease Stage | Description | Gene Ratio | Bg Ratio | pvalue | p.adjust | Count |
| GO:0044282 | Colorectum | AD | small molecule catabolic process | 118/3918 | 376/18723 | 1.05e-06 | 3.55e-05 | 118 |
| GO:0016052 | Colorectum | AD | carbohydrate catabolic process | 56/3918 | 154/18723 | 7.01e-06 | 1.73e-04 | 56 |
| GO:0019318 | Colorectum | AD | hexose metabolic process | 77/3918 | 237/18723 | 1.96e-05 | 4.01e-04 | 77 |
| GO:0005996 | Colorectum | AD | monosaccharide metabolic process | 80/3918 | 257/18723 | 7.31e-05 | 1.17e-03 | 80 |
| GO:0006006 | Colorectum | AD | glucose metabolic process | 62/3918 | 196/18723 | 2.76e-04 | 3.39e-03 | 62 |
| GO:0019320 | Colorectum | AD | hexose catabolic process | 14/3918 | 34/18723 | 5.86e-03 | 3.69e-02 | 14 |
| GO:0006012 | Colorectum | AD | galactose metabolic process | 6/3918 | 10/18723 | 8.03e-03 | 4.73e-02 | 6 |
| GO:00442821 | Colorectum | SER | small molecule catabolic process | 87/2897 | 376/18723 | 5.31e-05 | 1.27e-03 | 87 |
| GO:00193181 | Colorectum | SER | hexose metabolic process | 56/2897 | 237/18723 | 6.19e-04 | 8.42e-03 | 56 |
| GO:00059961 | Colorectum | SER | monosaccharide metabolic process | 59/2897 | 257/18723 | 9.65e-04 | 1.15e-02 | 59 |
| GO:00160521 | Colorectum | SER | carbohydrate catabolic process | 38/2897 | 154/18723 | 1.92e-03 | 1.93e-02 | 38 |
| GO:00060061 | Colorectum | SER | glucose metabolic process | 46/2897 | 196/18723 | 2.08e-03 | 2.05e-02 | 46 |
| GO:00160522 | Colorectum | MSS | carbohydrate catabolic process | 45/3467 | 154/18723 | 7.93e-04 | 8.36e-03 | 45 |
| GO:00442822 | Colorectum | MSS | small molecule catabolic process | 94/3467 | 376/18723 | 9.85e-04 | 9.86e-03 | 94 |
| GO:00193182 | Colorectum | MSS | hexose metabolic process | 63/3467 | 237/18723 | 1.32e-03 | 1.25e-02 | 63 |
| GO:00059962 | Colorectum | MSS | monosaccharide metabolic process | 66/3467 | 257/18723 | 2.61e-03 | 2.06e-02 | 66 |
| GO:00060121 | Colorectum | MSS | galactose metabolic process | 6/3467 | 10/18723 | 4.25e-03 | 3.04e-02 | 6 |
| GO:00060062 | Colorectum | MSS | glucose metabolic process | 51/3467 | 196/18723 | 5.67e-03 | 3.85e-02 | 51 |
| GO:00160523 | Colorectum | FAP | carbohydrate catabolic process | 44/2622 | 154/18723 | 1.82e-06 | 7.42e-05 | 44 |
| GO:00193183 | Colorectum | FAP | hexose metabolic process | 58/2622 | 237/18723 | 1.09e-05 | 3.08e-04 | 58 |
| Page: 1 2 3 |
| Pathway ID | Tissue | Disease Stage | Description | Gene Ratio | Bg Ratio | pvalue | p.adjust | qvalue | Count |
| hsa00010 | Colorectum | AD | Glycolysis / Gluconeogenesis | 34/2092 | 67/8465 | 3.63e-06 | 4.34e-05 | 2.77e-05 | 34 |
| hsa000101 | Colorectum | AD | Glycolysis / Gluconeogenesis | 34/2092 | 67/8465 | 3.63e-06 | 4.34e-05 | 2.77e-05 | 34 |
| hsa000102 | Colorectum | SER | Glycolysis / Gluconeogenesis | 24/1580 | 67/8465 | 6.62e-04 | 5.36e-03 | 3.89e-03 | 24 |
| hsa000103 | Colorectum | SER | Glycolysis / Gluconeogenesis | 24/1580 | 67/8465 | 6.62e-04 | 5.36e-03 | 3.89e-03 | 24 |
| hsa000104 | Colorectum | MSS | Glycolysis / Gluconeogenesis | 28/1875 | 67/8465 | 2.36e-04 | 1.81e-03 | 1.11e-03 | 28 |
| hsa000105 | Colorectum | MSS | Glycolysis / Gluconeogenesis | 28/1875 | 67/8465 | 2.36e-04 | 1.81e-03 | 1.11e-03 | 28 |
| hsa000106 | Colorectum | FAP | Glycolysis / Gluconeogenesis | 24/1404 | 67/8465 | 1.05e-04 | 9.46e-04 | 5.76e-04 | 24 |
| hsa00052 | Colorectum | FAP | Galactose metabolism | 12/1404 | 32/8465 | 3.61e-03 | 1.53e-02 | 9.29e-03 | 12 |
| hsa000107 | Colorectum | FAP | Glycolysis / Gluconeogenesis | 24/1404 | 67/8465 | 1.05e-04 | 9.46e-04 | 5.76e-04 | 24 |
| hsa000521 | Colorectum | FAP | Galactose metabolism | 12/1404 | 32/8465 | 3.61e-03 | 1.53e-02 | 9.29e-03 | 12 |
| hsa000109 | Liver | Cirrhotic | Glycolysis / Gluconeogenesis | 32/2530 | 67/8465 | 1.50e-03 | 7.80e-03 | 4.81e-03 | 32 |
| hsa0001012 | Liver | Cirrhotic | Glycolysis / Gluconeogenesis | 32/2530 | 67/8465 | 1.50e-03 | 7.80e-03 | 4.81e-03 | 32 |
| hsa0001022 | Liver | HCC | Glycolysis / Gluconeogenesis | 43/4020 | 67/8465 | 4.26e-03 | 1.29e-02 | 7.15e-03 | 43 |
| hsa0001032 | Liver | HCC | Glycolysis / Gluconeogenesis | 43/4020 | 67/8465 | 4.26e-03 | 1.29e-02 | 7.15e-03 | 43 |
| Page: 1 |
Top |
Cell-cell communication analysis |
| Identification of potential cell-cell interactions between two cell types and their ligand-receptor pairs for different disease states |
| Ligand | Receptor | LRpair | Pathway | Tissue | Disease Stage |
| Page: 1 |
Top |
Single-cell gene regulatory network inference analysis |
| Find out the significant the regulons (TFs) and the target genes of each regulon across cell types for different disease states |
| TF | Cell Type | Tissue | Disease Stage | Target Gene | RSS | Regulon Activity |
| ∗The dot plots of a searched regulon are shown for all cell subpopulations in each disease state of each tissue based on the regulon specific score inferred using pySCENIC and by calculating the average expression. |
| Page: 1 |
Top |
Somatic mutation of malignant transformation related genes |
| Annotation of somatic variants for genes involved in malignant transformation |
| Hugo Symbol | Variant Class | Variant Classification | dbSNP RS | HGVSc | HGVSp | HGVSp Short | SWISSPROT | BIOTYPE | SIFT | PolyPhen | Tumor Sample Barcode | Tissue | Histology | Sex | Age | Stage | Therapy Types | Drugs | Outcome |
| GALM | SNV | Missense_Mutation | rs570948999 | c.812T>C | p.Val271Ala | p.V271A | Q96C23 | protein_coding | deleterious(0.01) | possibly_damaging(0.714) | TCGA-BH-A18G-01 | Breast | breast invasive carcinoma | Female | >=65 | I/II | Unknown | Unknown | SD |
| GALM | SNV | Missense_Mutation | c.158C>G | p.Ser53Trp | p.S53W | Q96C23 | protein_coding | deleterious(0.01) | possibly_damaging(0.85) | TCGA-Q1-A5R2-01 | Cervix | cervical & endocervical cancer | Female | <65 | I/II | Chemotherapy | cisplatin | PR | |
| GALM | SNV | Missense_Mutation | novel | c.409G>A | p.Glu137Lys | p.E137K | Q96C23 | protein_coding | deleterious(0) | probably_damaging(0.979) | TCGA-ZJ-AAX8-01 | Cervix | cervical & endocervical cancer | Female | <65 | III/IV | Unknown | Unknown | SD |
| GALM | SNV | Missense_Mutation | c.212A>G | p.Tyr71Cys | p.Y71C | Q96C23 | protein_coding | deleterious(0.01) | probably_damaging(0.98) | TCGA-AA-3864-01 | Colorectum | colon adenocarcinoma | Male | >=65 | I/II | Unknown | Unknown | SD | |
| GALM | SNV | Missense_Mutation | novel | c.20C>T | p.Ala7Val | p.A7V | Q96C23 | protein_coding | tolerated(0.11) | benign(0.001) | TCGA-AA-A00N-01 | Colorectum | colon adenocarcinoma | Male | >=65 | I/II | Unknown | Unknown | PD |
| GALM | SNV | Missense_Mutation | rs778733977 | c.667N>A | p.Asp223Asn | p.D223N | Q96C23 | protein_coding | deleterious(0.01) | probably_damaging(0.994) | TCGA-CA-6717-01 | Colorectum | colon adenocarcinoma | Male | <65 | I/II | Chemotherapy | oxaliplatin | CR |
| GALM | SNV | Missense_Mutation | c.959N>C | p.Phe320Ser | p.F320S | Q96C23 | protein_coding | deleterious(0) | probably_damaging(1) | TCGA-CK-6746-01 | Colorectum | colon adenocarcinoma | Female | >=65 | I/II | Unknown | Unknown | SD | |
| GALM | SNV | Missense_Mutation | c.361C>T | p.Arg121Trp | p.R121W | Q96C23 | protein_coding | deleterious(0) | possibly_damaging(0.502) | TCGA-G4-6321-01 | Colorectum | colon adenocarcinoma | Female | <65 | III/IV | Chemotherapy | fluorouracil | SD | |
| GALM | insertion | In_Frame_Ins | novel | c.434_435insTGCCATATTTCAATATTT | p.Lys145delinsAsnAlaIlePheGlnTyrLeu | p.K145delinsNAIFQYL | Q96C23 | protein_coding | TCGA-AM-5820-01 | Colorectum | colon adenocarcinoma | Female | <65 | I/II | Unknown | Unknown | SD | ||
| GALM | SNV | Missense_Mutation | novel | c.934N>T | p.Pro312Ser | p.P312S | Q96C23 | protein_coding | deleterious(0) | probably_damaging(1) | TCGA-AX-A1CE-01 | Endometrium | uterine corpus endometrioid carcinoma | Female | <65 | I/II | Unspecific | Paclitaxel | SD |
| Page: 1 2 3 |
Top |
Related drugs of malignant transformation related genes |
| Identification of chemicals and drugs interact with genes involved in malignant transfromation |
| (DGIdb 4.0) |
| Entrez ID | Symbol | Category | Interaction Types | Drug Claim Name | Drug Name | PMIDs |
| Page: 1 |

Copyright 2023-Present -The University of Texas Health Science Center at Houston |