
|
|||||
|
 | |
| |
| |
| |
| |
| |
|
Gene: GALK2 |
Gene summary for GALK2 |
| Gene information | Species | Human | Gene symbol | GALK2 | Gene ID | 2585 |
| Gene name | galactokinase 2 | |
| Gene Alias | GK2 | |
| Cytomap | 15q21.1-q21.2 | |
| Gene Type | protein-coding | GO ID | GO:0005975 | UniProtAcc | Q01415 |
Top |
Malignant transformation analysis |
| Identification of the aberrant gene expression in precancerous and cancerous lesions by comparing the gene expression of stem-like cells in diseased tissues with normal stem cells |
| Entrez ID | Symbol | Replicates | Species | Organ | Tissue | Adj P-value | Log2FC | Malignancy |
| 2585 | GALK2 | LZE4T | Human | Esophagus | ESCC | 3.19e-11 | 3.54e-01 | 0.0811 |
| 2585 | GALK2 | LZE8T | Human | Esophagus | ESCC | 1.15e-05 | 1.94e-01 | 0.067 |
| 2585 | GALK2 | LZE22T | Human | Esophagus | ESCC | 1.81e-02 | 2.47e-01 | 0.068 |
| 2585 | GALK2 | LZE24T | Human | Esophagus | ESCC | 5.43e-13 | 2.44e-01 | 0.0596 |
| 2585 | GALK2 | LZE21T | Human | Esophagus | ESCC | 2.92e-03 | 2.16e-01 | 0.0655 |
| 2585 | GALK2 | P1T-E | Human | Esophagus | ESCC | 2.82e-06 | 2.35e-01 | 0.0875 |
| 2585 | GALK2 | P2T-E | Human | Esophagus | ESCC | 1.71e-10 | 1.03e-01 | 0.1177 |
| 2585 | GALK2 | P4T-E | Human | Esophagus | ESCC | 2.36e-27 | 5.24e-01 | 0.1323 |
| 2585 | GALK2 | P5T-E | Human | Esophagus | ESCC | 3.17e-12 | 1.79e-01 | 0.1327 |
| 2585 | GALK2 | P8T-E | Human | Esophagus | ESCC | 9.20e-18 | 2.60e-01 | 0.0889 |
| 2585 | GALK2 | P9T-E | Human | Esophagus | ESCC | 1.96e-14 | 2.11e-01 | 0.1131 |
| 2585 | GALK2 | P10T-E | Human | Esophagus | ESCC | 1.92e-22 | 3.83e-01 | 0.116 |
| 2585 | GALK2 | P11T-E | Human | Esophagus | ESCC | 7.79e-16 | 4.05e-01 | 0.1426 |
| 2585 | GALK2 | P12T-E | Human | Esophagus | ESCC | 2.74e-22 | 3.68e-01 | 0.1122 |
| 2585 | GALK2 | P15T-E | Human | Esophagus | ESCC | 4.99e-22 | 3.73e-01 | 0.1149 |
| 2585 | GALK2 | P16T-E | Human | Esophagus | ESCC | 2.76e-17 | 2.66e-01 | 0.1153 |
| 2585 | GALK2 | P17T-E | Human | Esophagus | ESCC | 1.25e-02 | 1.13e-01 | 0.1278 |
| 2585 | GALK2 | P19T-E | Human | Esophagus | ESCC | 4.48e-09 | 5.37e-01 | 0.1662 |
| 2585 | GALK2 | P20T-E | Human | Esophagus | ESCC | 1.07e-19 | 2.81e-01 | 0.1124 |
| 2585 | GALK2 | P21T-E | Human | Esophagus | ESCC | 2.38e-10 | 1.39e-01 | 0.1617 |
| Page: 1 2 3 4 |
| Tissue | Expression Dynamics | Abbreviation |
| Esophagus | 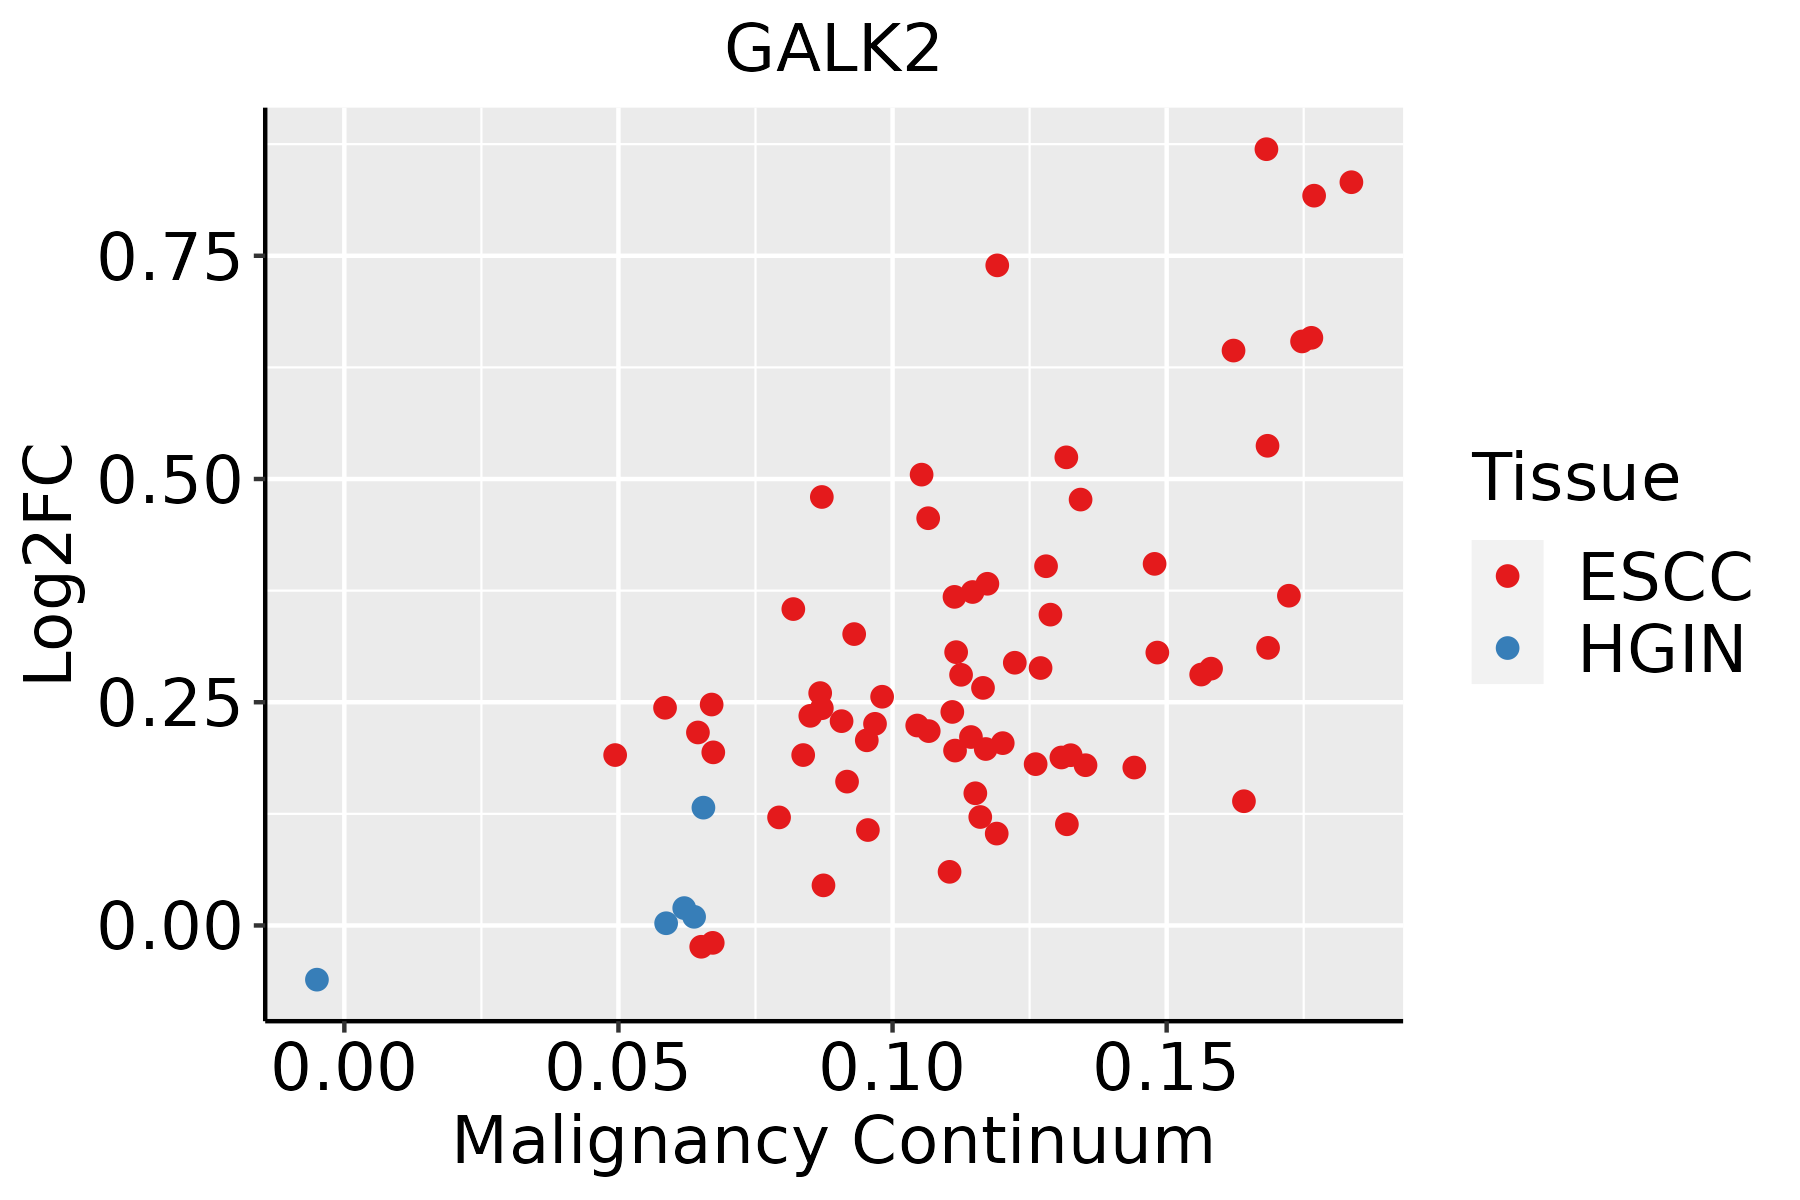 | ESCC: Esophageal squamous cell carcinoma |
| HGIN: High-grade intraepithelial neoplasias | ||
| LGIN: Low-grade intraepithelial neoplasias | ||
| Oral Cavity | 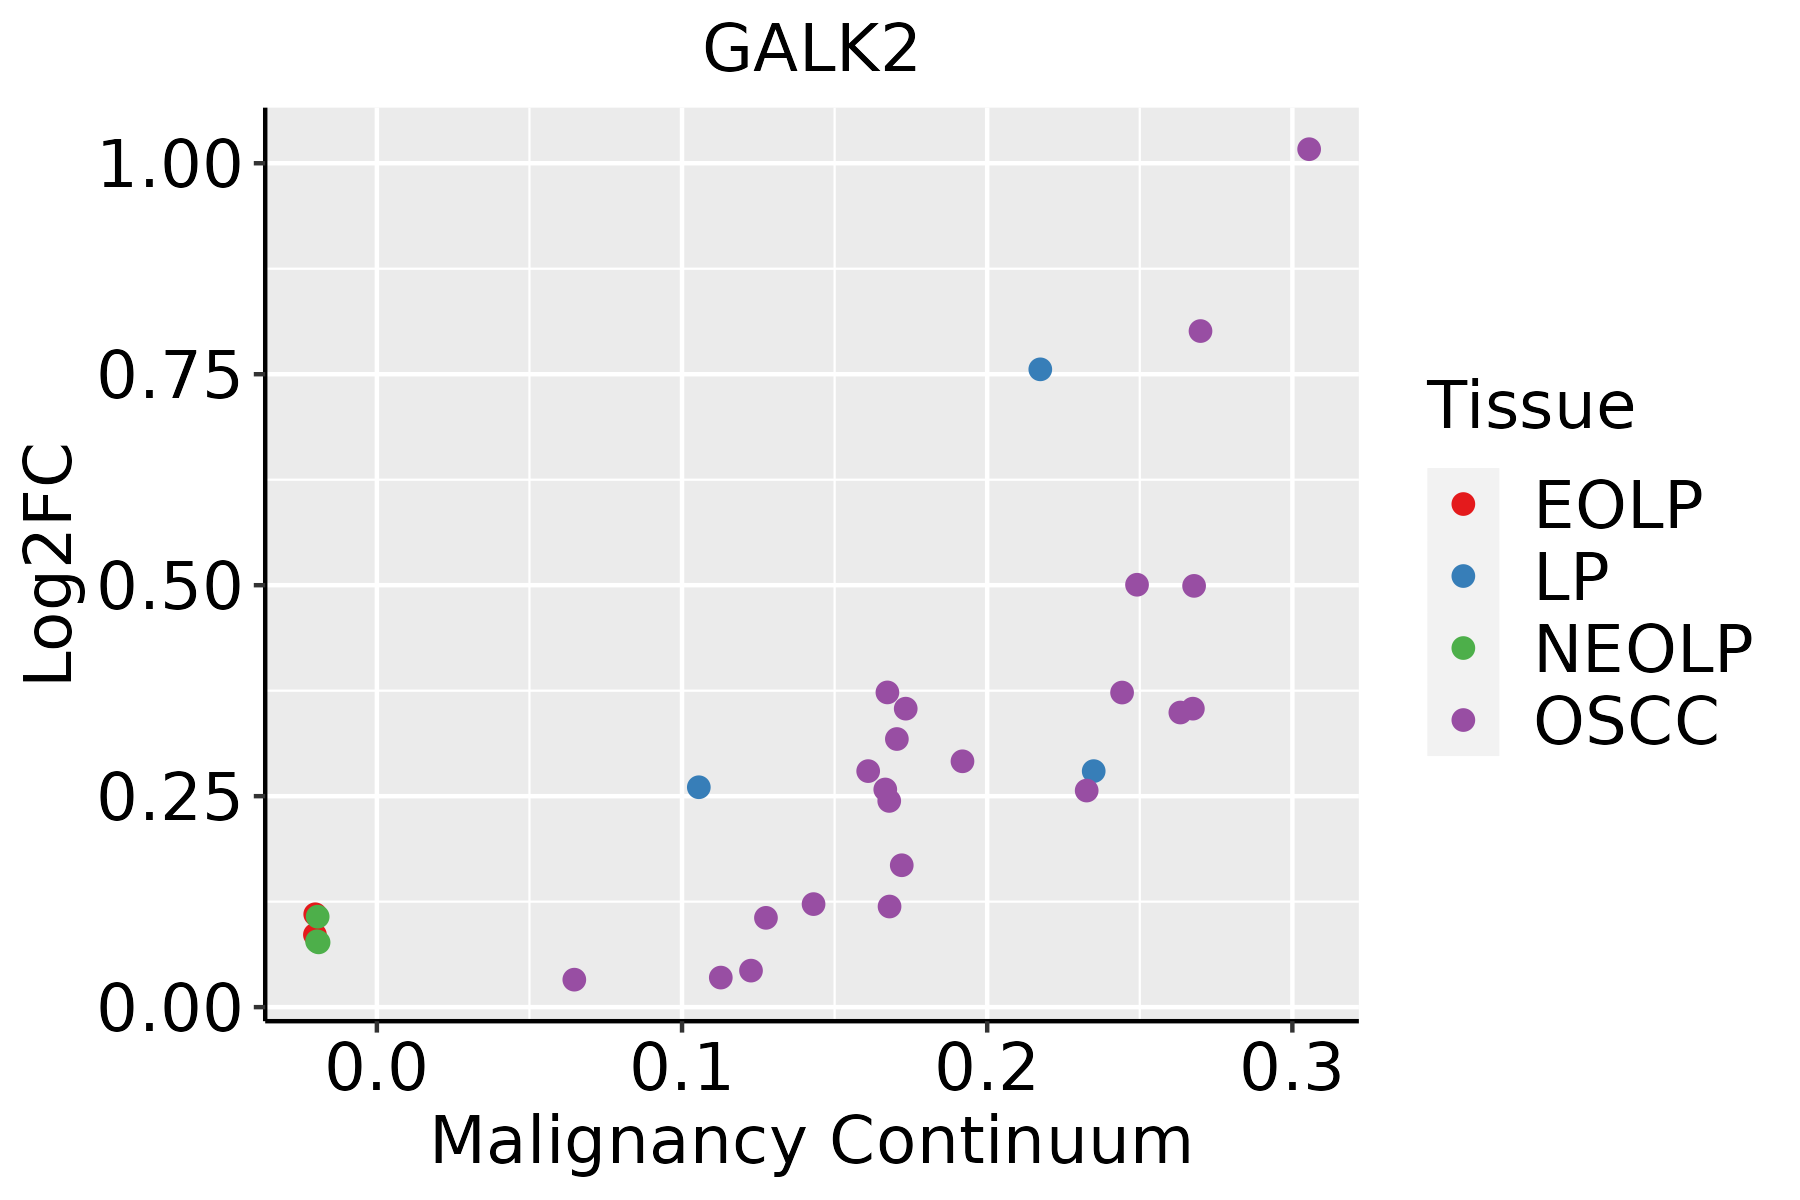 | EOLP: Erosive Oral lichen planus |
| LP: leukoplakia | ||
| NEOLP: Non-erosive oral lichen planus | ||
| OSCC: Oral squamous cell carcinoma |
| ∗log2FC in expression of this searched gene in stem-like cells from each diseased tissue sample relative to stem-like cells in normal samples in each tissue plotted against the malignancy continuum. Samples are colored based on if they are from different disease stage. |
Top |
Malignant transformation related pathway analysis |
| Find out the enriched GO biological processes and KEGG pathways involved in transition from healthy to precancer to cancer |
| Tissue | Disease Stage | Enriched GO biological Processes |
| Colorectum | AD |  |
| Colorectum | SER |  |
| Colorectum | MSS |  |
| Colorectum | MSI-H |  |
| Colorectum | FAP |  |
| ∗Top 15 enriched GO BP terms are showed in the bar plot of each disease state in each tissue. Each row represents a significant GO biological process which is colored according to the -log10(p.adjust). |
| Page: 1 2 3 4 5 6 7 8 9 |
| GO ID | Tissue | Disease Stage | Description | Gene Ratio | Bg Ratio | pvalue | p.adjust | Count |
| GO:00059969 | Esophagus | ESCC | monosaccharide metabolic process | 159/8552 | 257/18723 | 1.11e-07 | 1.81e-06 | 159 |
| GO:00193189 | Esophagus | ESCC | hexose metabolic process | 147/8552 | 237/18723 | 2.63e-07 | 3.94e-06 | 147 |
| GO:00442626 | Esophagus | ESCC | cellular carbohydrate metabolic process | 160/8552 | 283/18723 | 1.43e-04 | 9.66e-04 | 160 |
| GO:00059968 | Oral cavity | OSCC | monosaccharide metabolic process | 129/7305 | 257/18723 | 1.63e-04 | 1.13e-03 | 129 |
| GO:00193188 | Oral cavity | OSCC | hexose metabolic process | 118/7305 | 237/18723 | 4.53e-04 | 2.73e-03 | 118 |
| GO:00442625 | Oral cavity | OSCC | cellular carbohydrate metabolic process | 130/7305 | 283/18723 | 9.98e-03 | 3.49e-02 | 130 |
| GO:000599613 | Oral cavity | LP | monosaccharide metabolic process | 86/4623 | 257/18723 | 9.13e-04 | 7.79e-03 | 86 |
| GO:001931813 | Oral cavity | LP | hexose metabolic process | 78/4623 | 237/18723 | 2.55e-03 | 1.80e-02 | 78 |
| Page: 1 |
| Pathway ID | Tissue | Disease Stage | Description | Gene Ratio | Bg Ratio | pvalue | p.adjust | qvalue | Count |
| hsa012505 | Esophagus | ESCC | Biosynthesis of nucleotide sugars | 28/4205 | 37/8465 | 1.10e-03 | 3.42e-03 | 1.75e-03 | 28 |
| hsa005202 | Esophagus | ESCC | Amino sugar and nucleotide sugar metabolism | 35/4205 | 49/8465 | 1.60e-03 | 4.88e-03 | 2.50e-03 | 35 |
| hsa0125012 | Esophagus | ESCC | Biosynthesis of nucleotide sugars | 28/4205 | 37/8465 | 1.10e-03 | 3.42e-03 | 1.75e-03 | 28 |
| hsa0052011 | Esophagus | ESCC | Amino sugar and nucleotide sugar metabolism | 35/4205 | 49/8465 | 1.60e-03 | 4.88e-03 | 2.50e-03 | 35 |
| hsa00520 | Oral cavity | OSCC | Amino sugar and nucleotide sugar metabolism | 34/3704 | 49/8465 | 2.48e-04 | 8.08e-04 | 4.11e-04 | 34 |
| hsa012504 | Oral cavity | OSCC | Biosynthesis of nucleotide sugars | 25/3704 | 37/8465 | 2.93e-03 | 7.49e-03 | 3.81e-03 | 25 |
| hsa005201 | Oral cavity | OSCC | Amino sugar and nucleotide sugar metabolism | 34/3704 | 49/8465 | 2.48e-04 | 8.08e-04 | 4.11e-04 | 34 |
| hsa0125011 | Oral cavity | OSCC | Biosynthesis of nucleotide sugars | 25/3704 | 37/8465 | 2.93e-03 | 7.49e-03 | 3.81e-03 | 25 |
| Page: 1 |
Top |
Cell-cell communication analysis |
| Identification of potential cell-cell interactions between two cell types and their ligand-receptor pairs for different disease states |
| Ligand | Receptor | LRpair | Pathway | Tissue | Disease Stage |
| Page: 1 |
Top |
Single-cell gene regulatory network inference analysis |
| Find out the significant the regulons (TFs) and the target genes of each regulon across cell types for different disease states |
| TF | Cell Type | Tissue | Disease Stage | Target Gene | RSS | Regulon Activity |
| ∗The dot plots of a searched regulon are shown for all cell subpopulations in each disease state of each tissue based on the regulon specific score inferred using pySCENIC and by calculating the average expression. |
| Page: 1 |
Top |
Somatic mutation of malignant transformation related genes |
| Annotation of somatic variants for genes involved in malignant transformation |
| Hugo Symbol | Variant Class | Variant Classification | dbSNP RS | HGVSc | HGVSp | HGVSp Short | SWISSPROT | BIOTYPE | SIFT | PolyPhen | Tumor Sample Barcode | Tissue | Histology | Sex | Age | Stage | Therapy Types | Drugs | Outcome |
| GALK2 | SNV | Missense_Mutation | novel | c.245C>T | p.Ala82Val | p.A82V | Q01415 | protein_coding | tolerated(0.11) | benign(0.01) | TCGA-AN-A046-01 | Breast | breast invasive carcinoma | Female | >=65 | I/II | Unknown | Unknown | SD |
| GALK2 | SNV | Missense_Mutation | c.145G>A | p.Glu49Lys | p.E49K | Q01415 | protein_coding | deleterious(0) | probably_damaging(1) | TCGA-C8-A1HM-01 | Breast | breast invasive carcinoma | Female | >=65 | I/II | Chemotherapy | doxorubicin | CR | |
| GALK2 | SNV | Missense_Mutation | c.389N>A | p.Met130Lys | p.M130K | Q01415 | protein_coding | deleterious(0) | possibly_damaging(0.469) | TCGA-D8-A1J8-01 | Breast | breast invasive carcinoma | Female | >=65 | I/II | Hormone Therapy | nolvadex | SD | |
| GALK2 | SNV | Missense_Mutation | novel | c.142N>A | p.Gly48Arg | p.G48R | Q01415 | protein_coding | deleterious(0.01) | probably_damaging(1) | TCGA-2W-A8YY-01 | Cervix | cervical & endocervical cancer | Female | <65 | I/II | Chemotherapy | cisplatin | CR |
| GALK2 | SNV | Missense_Mutation | c.273N>A | p.Phe91Leu | p.F91L | Q01415 | protein_coding | tolerated(0.09) | benign(0.132) | TCGA-MU-A51Y-01 | Cervix | cervical & endocervical cancer | Female | <65 | I/II | Unknown | Unknown | SD | |
| GALK2 | SNV | Missense_Mutation | novel | c.434N>G | p.Ser145Cys | p.S145C | Q01415 | protein_coding | deleterious(0) | probably_damaging(1) | TCGA-ZX-AA5X-01 | Cervix | cervical & endocervical cancer | Female | <65 | III/IV | Unknown | Unknown | SD |
| GALK2 | SNV | Missense_Mutation | c.868N>T | p.Leu290Phe | p.L290F | Q01415 | protein_coding | tolerated(0.19) | benign(0.333) | TCGA-A6-5657-01 | Colorectum | colon adenocarcinoma | Male | >=65 | III/IV | Ancillary | leucovorin | SD | |
| GALK2 | SNV | Missense_Mutation | rs375693032 | c.1114N>T | p.Arg372Trp | p.R372W | Q01415 | protein_coding | deleterious(0) | probably_damaging(0.987) | TCGA-AA-3862-01 | Colorectum | colon adenocarcinoma | Male | >=65 | I/II | Unknown | Unknown | SD |
| GALK2 | SNV | Missense_Mutation | rs201091452 | c.743N>A | p.Arg248Gln | p.R248Q | Q01415 | protein_coding | deleterious(0.02) | possibly_damaging(0.815) | TCGA-AA-3877-01 | Colorectum | colon adenocarcinoma | Female | >=65 | I/II | Unknown | Unknown | SD |
| GALK2 | SNV | Missense_Mutation | c.745N>A | p.Leu249Met | p.L249M | Q01415 | protein_coding | deleterious(0.01) | probably_damaging(0.99) | TCGA-AU-6004-01 | Colorectum | colon adenocarcinoma | Female | >=65 | I/II | Unknown | Unknown | SD |
| Page: 1 2 3 4 5 |
Top |
Related drugs of malignant transformation related genes |
| Identification of chemicals and drugs interact with genes involved in malignant transfromation |
| (DGIdb 4.0) |
| Entrez ID | Symbol | Category | Interaction Types | Drug Claim Name | Drug Name | PMIDs |
| Page: 1 |

Copyright 2023-Present -The University of Texas Health Science Center at Houston |