
|
|||||
|
 | |
| |
| |
| |
| |
| |
|
Gene: GALK1 |
Gene summary for GALK1 |
| Gene information | Species | Human | Gene symbol | GALK1 | Gene ID | 2584 |
| Gene name | galactokinase 1 | |
| Gene Alias | GALK | |
| Cytomap | 17q25.1 | |
| Gene Type | protein-coding | GO ID | GO:0005975 | UniProtAcc | P51570 |
Top |
Malignant transformation analysis |
| Identification of the aberrant gene expression in precancerous and cancerous lesions by comparing the gene expression of stem-like cells in diseased tissues with normal stem cells |
| Entrez ID | Symbol | Replicates | Species | Organ | Tissue | Adj P-value | Log2FC | Malignancy |
| 2584 | GALK1 | LZE4T | Human | Esophagus | ESCC | 1.57e-05 | 1.42e-01 | 0.0811 |
| 2584 | GALK1 | LZE7T | Human | Esophagus | ESCC | 1.02e-07 | 3.95e-01 | 0.0667 |
| 2584 | GALK1 | LZE8T | Human | Esophagus | ESCC | 5.80e-03 | 1.35e-01 | 0.067 |
| 2584 | GALK1 | LZE24T | Human | Esophagus | ESCC | 8.42e-25 | 5.41e-01 | 0.0596 |
| 2584 | GALK1 | LZE21T | Human | Esophagus | ESCC | 1.09e-04 | 3.01e-01 | 0.0655 |
| 2584 | GALK1 | LZE6T | Human | Esophagus | ESCC | 1.30e-03 | 1.84e-01 | 0.0845 |
| 2584 | GALK1 | P2T-E | Human | Esophagus | ESCC | 4.17e-31 | 4.57e-01 | 0.1177 |
| 2584 | GALK1 | P4T-E | Human | Esophagus | ESCC | 1.47e-19 | 3.95e-01 | 0.1323 |
| 2584 | GALK1 | P5T-E | Human | Esophagus | ESCC | 4.73e-12 | 2.29e-01 | 0.1327 |
| 2584 | GALK1 | P8T-E | Human | Esophagus | ESCC | 3.53e-14 | 2.89e-01 | 0.0889 |
| 2584 | GALK1 | P9T-E | Human | Esophagus | ESCC | 1.18e-09 | 2.82e-01 | 0.1131 |
| 2584 | GALK1 | P10T-E | Human | Esophagus | ESCC | 2.76e-10 | 1.83e-01 | 0.116 |
| 2584 | GALK1 | P11T-E | Human | Esophagus | ESCC | 7.51e-11 | 5.06e-01 | 0.1426 |
| 2584 | GALK1 | P12T-E | Human | Esophagus | ESCC | 5.53e-30 | 4.62e-01 | 0.1122 |
| 2584 | GALK1 | P15T-E | Human | Esophagus | ESCC | 2.58e-20 | 4.47e-01 | 0.1149 |
| 2584 | GALK1 | P16T-E | Human | Esophagus | ESCC | 4.65e-24 | 3.78e-01 | 0.1153 |
| 2584 | GALK1 | P17T-E | Human | Esophagus | ESCC | 7.99e-11 | 3.09e-01 | 0.1278 |
| 2584 | GALK1 | P19T-E | Human | Esophagus | ESCC | 7.34e-07 | 4.98e-01 | 0.1662 |
| 2584 | GALK1 | P20T-E | Human | Esophagus | ESCC | 3.67e-50 | 9.51e-01 | 0.1124 |
| 2584 | GALK1 | P21T-E | Human | Esophagus | ESCC | 5.14e-26 | 4.86e-01 | 0.1617 |
| Page: 1 2 3 4 5 |
| Tissue | Expression Dynamics | Abbreviation |
| Esophagus | 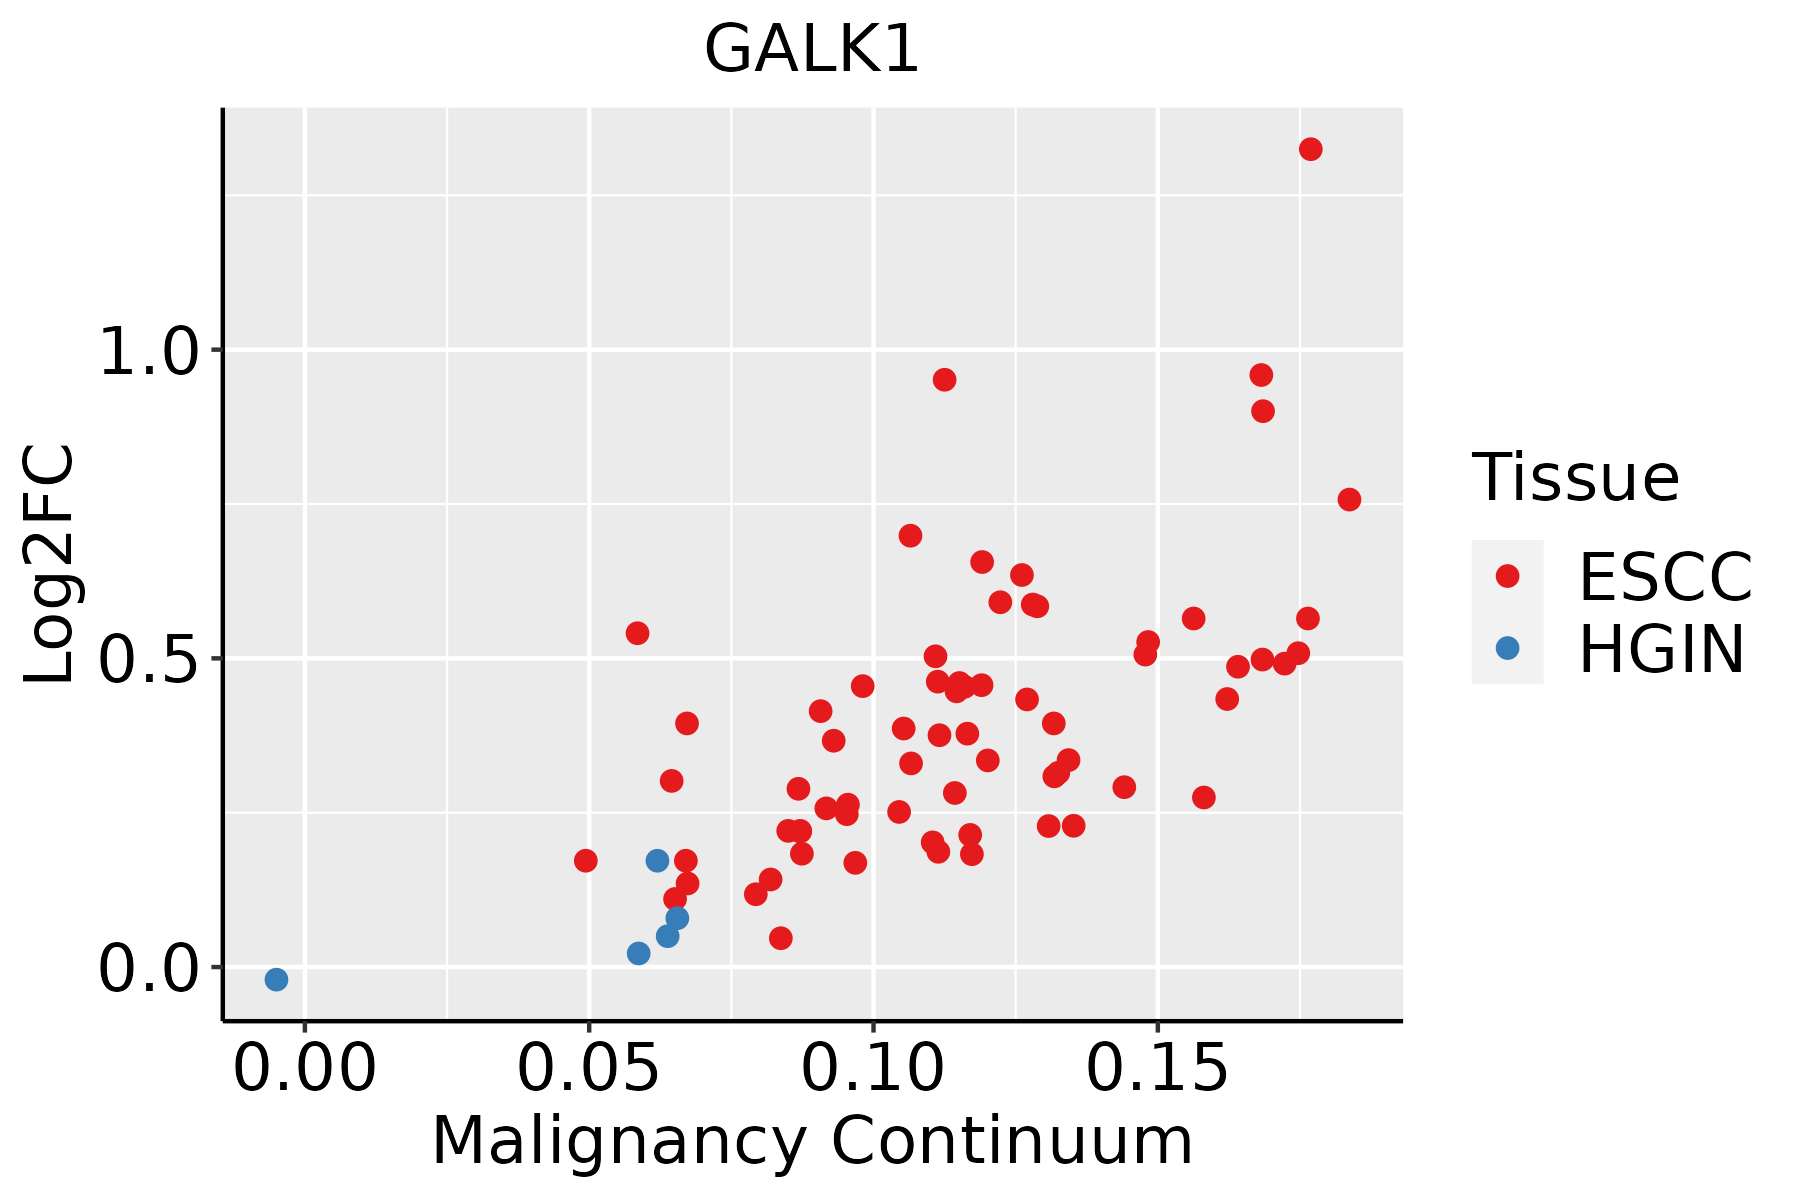 | ESCC: Esophageal squamous cell carcinoma |
| HGIN: High-grade intraepithelial neoplasias | ||
| LGIN: Low-grade intraepithelial neoplasias | ||
| Liver |  | HCC: Hepatocellular carcinoma |
| NAFLD: Non-alcoholic fatty liver disease | ||
| Oral Cavity | 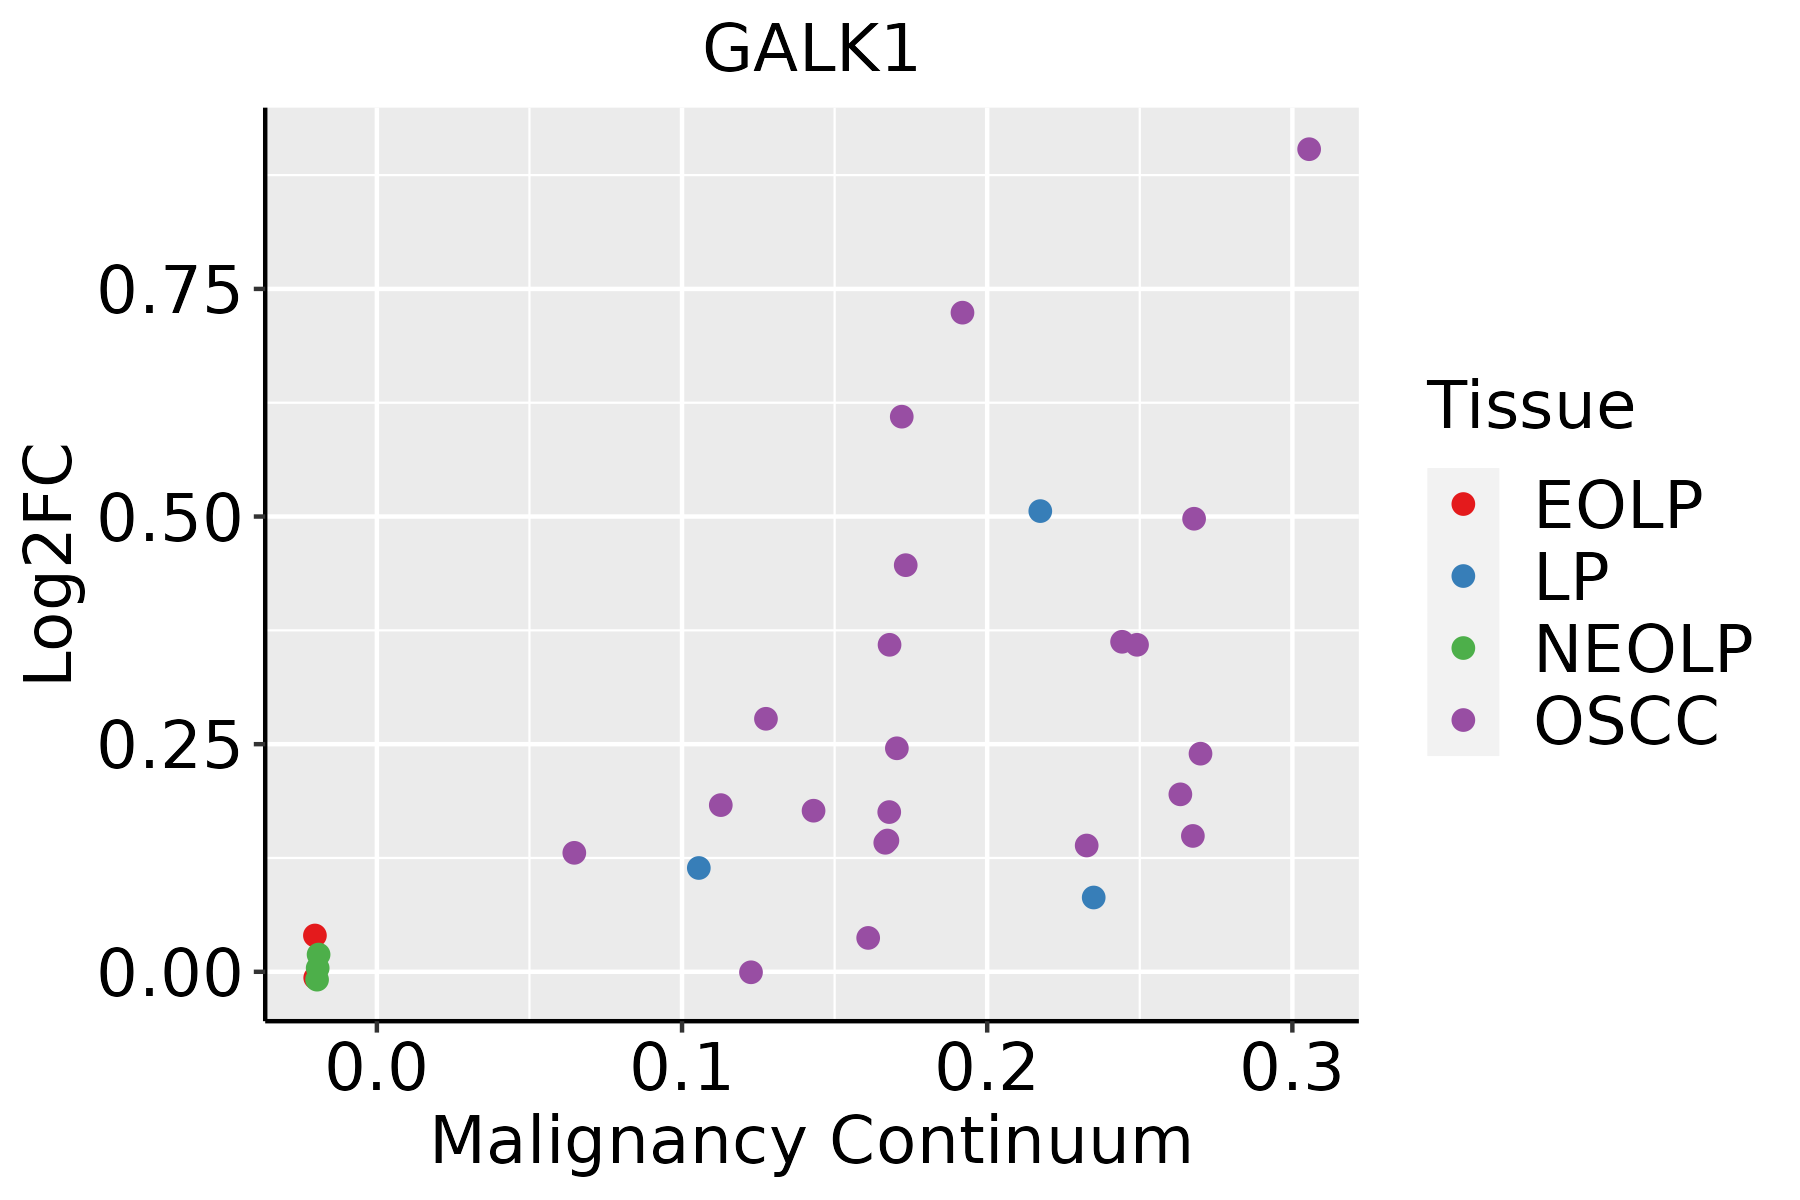 | EOLP: Erosive Oral lichen planus |
| LP: leukoplakia | ||
| NEOLP: Non-erosive oral lichen planus | ||
| OSCC: Oral squamous cell carcinoma | ||
| Thyroid | 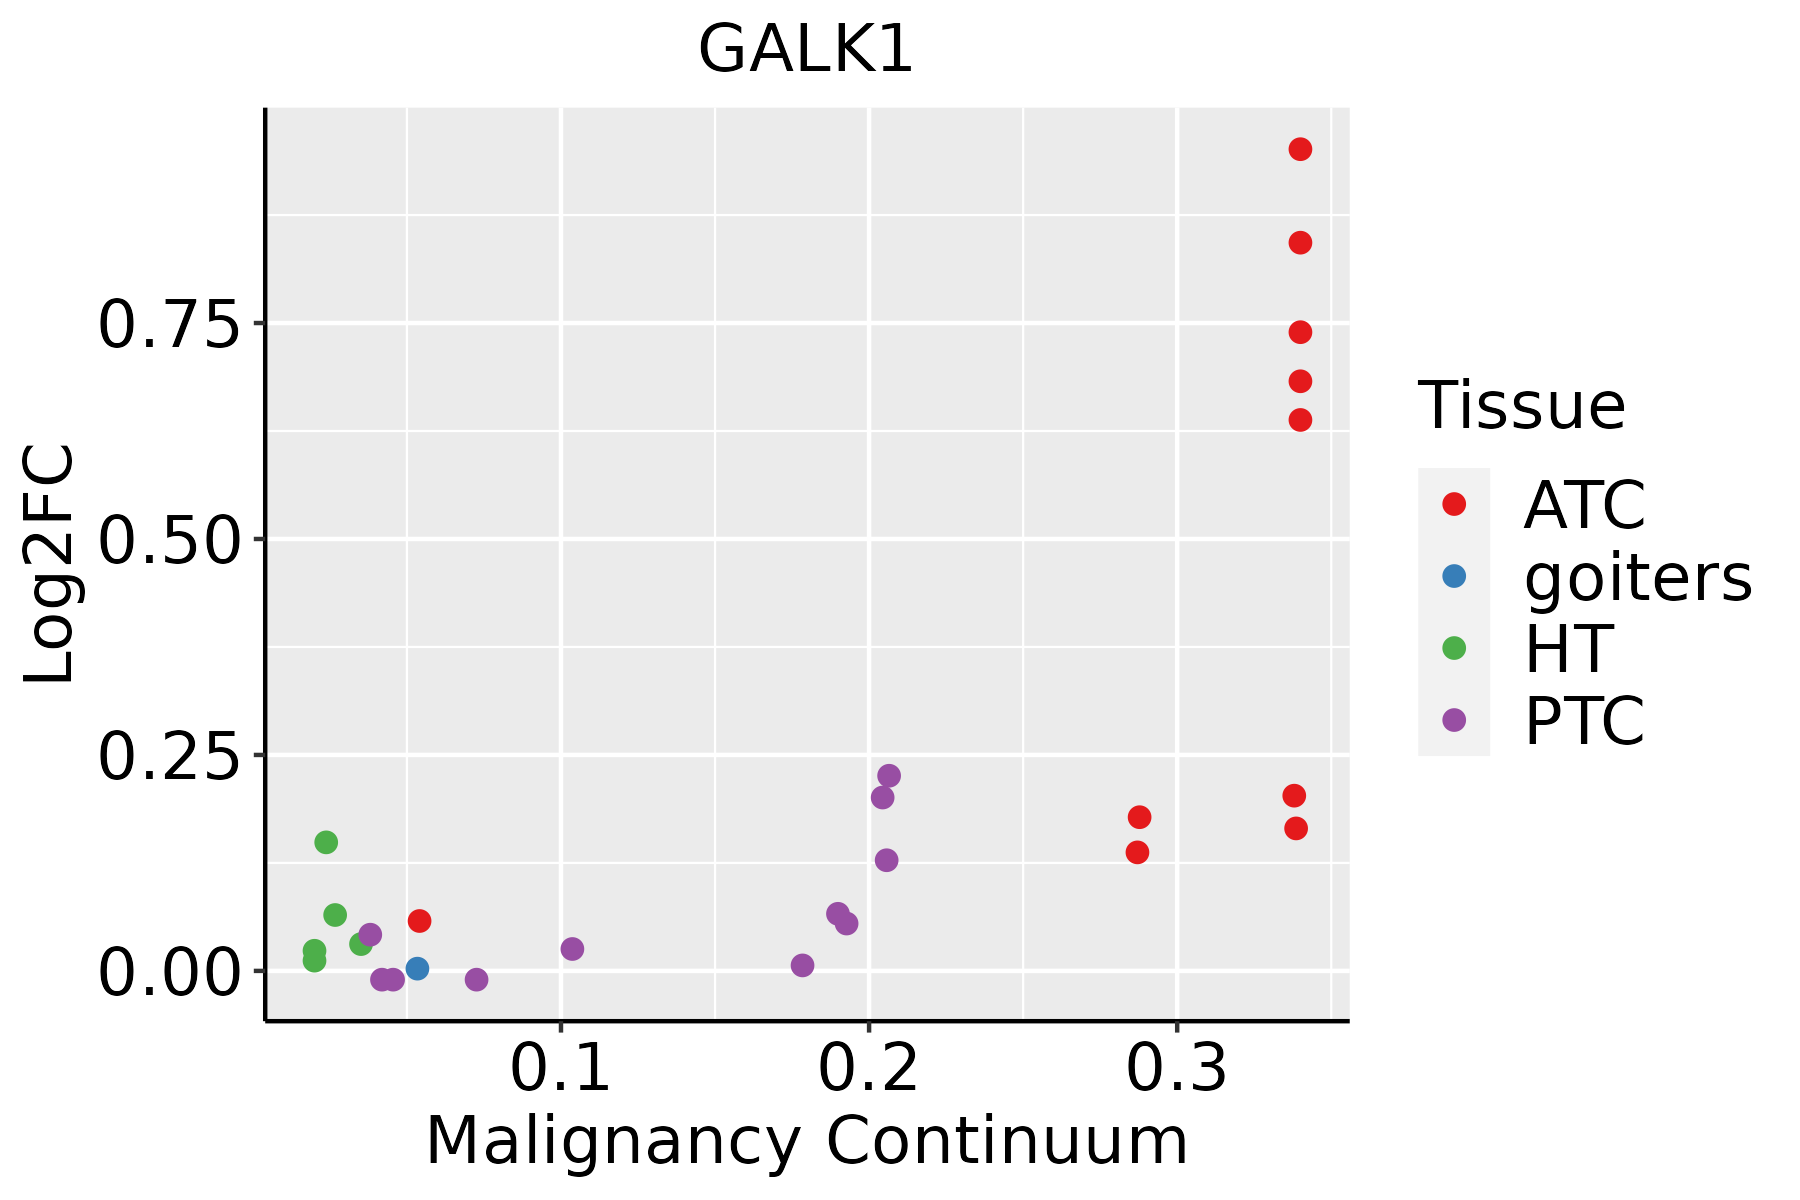 | ATC: Anaplastic thyroid cancer |
| HT: Hashimoto's thyroiditis | ||
| PTC: Papillary thyroid cancer |
| ∗log2FC in expression of this searched gene in stem-like cells from each diseased tissue sample relative to stem-like cells in normal samples in each tissue plotted against the malignancy continuum. Samples are colored based on if they are from different disease stage. |
Top |
Malignant transformation related pathway analysis |
| Find out the enriched GO biological processes and KEGG pathways involved in transition from healthy to precancer to cancer |
| Tissue | Disease Stage | Enriched GO biological Processes |
| Colorectum | AD |  |
| Colorectum | SER |  |
| Colorectum | MSS |  |
| Colorectum | MSI-H |  |
| Colorectum | FAP |  |
| ∗Top 15 enriched GO BP terms are showed in the bar plot of each disease state in each tissue. Each row represents a significant GO biological process which is colored according to the -log10(p.adjust). |
| Page: 1 2 3 4 5 6 7 8 9 |
| GO ID | Tissue | Disease Stage | Description | Gene Ratio | Bg Ratio | pvalue | p.adjust | Count |
| GO:0006091110 | Esophagus | ESCC | generation of precursor metabolites and energy | 331/8552 | 490/18723 | 3.86e-23 | 8.45e-21 | 331 |
| GO:0046034111 | Esophagus | ESCC | ATP metabolic process | 189/8552 | 277/18723 | 1.99e-14 | 1.04e-12 | 189 |
| GO:0006753110 | Esophagus | ESCC | nucleoside phosphate metabolic process | 288/8552 | 497/18723 | 1.80e-08 | 3.50e-07 | 288 |
| GO:0019693111 | Esophagus | ESCC | ribose phosphate metabolic process | 234/8552 | 396/18723 | 4.24e-08 | 7.76e-07 | 234 |
| GO:0009117111 | Esophagus | ESCC | nucleotide metabolic process | 282/8552 | 489/18723 | 4.70e-08 | 8.50e-07 | 282 |
| GO:00059969 | Esophagus | ESCC | monosaccharide metabolic process | 159/8552 | 257/18723 | 1.11e-07 | 1.81e-06 | 159 |
| GO:00193189 | Esophagus | ESCC | hexose metabolic process | 147/8552 | 237/18723 | 2.63e-07 | 3.94e-06 | 147 |
| GO:0009259111 | Esophagus | ESCC | ribonucleotide metabolic process | 224/8552 | 385/18723 | 4.41e-07 | 6.00e-06 | 224 |
| GO:0072521111 | Esophagus | ESCC | purine-containing compound metabolic process | 238/8552 | 416/18723 | 1.20e-06 | 1.49e-05 | 238 |
| GO:0009150111 | Esophagus | ESCC | purine ribonucleotide metabolic process | 213/8552 | 368/18723 | 1.40e-06 | 1.69e-05 | 213 |
| GO:0006163111 | Esophagus | ESCC | purine nucleotide metabolic process | 226/8552 | 396/18723 | 2.81e-06 | 3.21e-05 | 226 |
| GO:00060668 | Esophagus | ESCC | alcohol metabolic process | 202/8552 | 353/18723 | 7.32e-06 | 7.26e-05 | 202 |
| GO:00442626 | Esophagus | ESCC | cellular carbohydrate metabolic process | 160/8552 | 283/18723 | 1.43e-04 | 9.66e-04 | 160 |
| GO:000913219 | Esophagus | ESCC | nucleoside diphosphate metabolic process | 77/8552 | 124/18723 | 1.65e-04 | 1.09e-03 | 77 |
| GO:000918520 | Esophagus | ESCC | ribonucleoside diphosphate metabolic process | 66/8552 | 106/18723 | 4.21e-04 | 2.39e-03 | 66 |
| GO:001605216 | Esophagus | ESCC | carbohydrate catabolic process | 91/8552 | 154/18723 | 5.39e-04 | 2.97e-03 | 91 |
| GO:000913520 | Esophagus | ESCC | purine nucleoside diphosphate metabolic process | 63/8552 | 103/18723 | 1.10e-03 | 5.52e-03 | 63 |
| GO:000917920 | Esophagus | ESCC | purine ribonucleoside diphosphate metabolic process | 63/8552 | 103/18723 | 1.10e-03 | 5.52e-03 | 63 |
| GO:00442827 | Esophagus | ESCC | small molecule catabolic process | 201/8552 | 376/18723 | 1.35e-03 | 6.41e-03 | 201 |
| GO:004693919 | Esophagus | ESCC | nucleotide phosphorylation | 61/8552 | 101/18723 | 2.03e-03 | 9.08e-03 | 61 |
| Page: 1 2 3 4 5 6 7 8 |
| Pathway ID | Tissue | Disease Stage | Description | Gene Ratio | Bg Ratio | pvalue | p.adjust | qvalue | Count |
| hsa012505 | Esophagus | ESCC | Biosynthesis of nucleotide sugars | 28/4205 | 37/8465 | 1.10e-03 | 3.42e-03 | 1.75e-03 | 28 |
| hsa005202 | Esophagus | ESCC | Amino sugar and nucleotide sugar metabolism | 35/4205 | 49/8465 | 1.60e-03 | 4.88e-03 | 2.50e-03 | 35 |
| hsa0125012 | Esophagus | ESCC | Biosynthesis of nucleotide sugars | 28/4205 | 37/8465 | 1.10e-03 | 3.42e-03 | 1.75e-03 | 28 |
| hsa0052011 | Esophagus | ESCC | Amino sugar and nucleotide sugar metabolism | 35/4205 | 49/8465 | 1.60e-03 | 4.88e-03 | 2.50e-03 | 35 |
| Page: 1 |
Top |
Cell-cell communication analysis |
| Identification of potential cell-cell interactions between two cell types and their ligand-receptor pairs for different disease states |
| Ligand | Receptor | LRpair | Pathway | Tissue | Disease Stage |
| Page: 1 |
Top |
Single-cell gene regulatory network inference analysis |
| Find out the significant the regulons (TFs) and the target genes of each regulon across cell types for different disease states |
| TF | Cell Type | Tissue | Disease Stage | Target Gene | RSS | Regulon Activity |
| ∗The dot plots of a searched regulon are shown for all cell subpopulations in each disease state of each tissue based on the regulon specific score inferred using pySCENIC and by calculating the average expression. |
| Page: 1 |
Top |
Somatic mutation of malignant transformation related genes |
| Annotation of somatic variants for genes involved in malignant transformation |
| Hugo Symbol | Variant Class | Variant Classification | dbSNP RS | HGVSc | HGVSp | HGVSp Short | SWISSPROT | BIOTYPE | SIFT | PolyPhen | Tumor Sample Barcode | Tissue | Histology | Sex | Age | Stage | Therapy Types | Drugs | Outcome |
| GALK1 | SNV | Missense_Mutation | c.236C>G | p.Ser79Cys | p.S79C | P51570 | protein_coding | tolerated(0.18) | benign(0.018) | TCGA-DG-A2KM-01 | Cervix | cervical & endocervical cancer | Female | <65 | I/II | Chemotherapy | cisplatin | SD | |
| GALK1 | SNV | Missense_Mutation | c.236C>T | p.Ser79Phe | p.S79F | P51570 | protein_coding | tolerated(0.1) | benign(0.075) | TCGA-JW-A5VL-01 | Cervix | cervical & endocervical cancer | Female | <65 | I/II | Unknown | Unknown | SD | |
| GALK1 | SNV | Missense_Mutation | c.236N>G | p.Ser79Cys | p.S79C | P51570 | protein_coding | tolerated(0.18) | benign(0.018) | TCGA-Q1-A5R2-01 | Cervix | cervical & endocervical cancer | Female | <65 | I/II | Chemotherapy | cisplatin | PR | |
| GALK1 | SNV | Missense_Mutation | novel | c.50G>A | p.Arg17Gln | p.R17Q | P51570 | protein_coding | tolerated(0.37) | benign(0.006) | TCGA-5M-AAT6-01 | Colorectum | colon adenocarcinoma | Female | <65 | III/IV | Unknown | Unknown | PD |
| GALK1 | SNV | Missense_Mutation | c.508T>C | p.Cys170Arg | p.C170R | P51570 | protein_coding | deleterious(0) | probably_damaging(0.999) | TCGA-D5-6928-01 | Colorectum | colon adenocarcinoma | Male | >=65 | I/II | Unknown | Unknown | SD | |
| GALK1 | SNV | Missense_Mutation | novel | c.151N>A | p.Leu51Met | p.L51M | P51570 | protein_coding | deleterious(0.01) | possibly_damaging(0.809) | TCGA-A5-A1OF-01 | Endometrium | uterine corpus endometrioid carcinoma | Female | <65 | I/II | Unknown | Unknown | SD |
| GALK1 | SNV | Missense_Mutation | novel | c.919N>G | p.Met307Val | p.M307V | P51570 | protein_coding | deleterious(0) | probably_damaging(0.983) | TCGA-AX-A0J0-01 | Endometrium | uterine corpus endometrioid carcinoma | Female | <65 | I/II | Unknown | Unknown | SD |
| GALK1 | SNV | Missense_Mutation | rs376343759 | c.718C>T | p.Arg240Trp | p.R240W | P51570 | protein_coding | deleterious(0) | possibly_damaging(0.673) | TCGA-B5-A3FC-01 | Endometrium | uterine corpus endometrioid carcinoma | Female | <65 | I/II | Unknown | Unknown | SD |
| GALK1 | SNV | Missense_Mutation | novel | c.364N>A | p.Leu122Ile | p.L122I | P51570 | protein_coding | tolerated(0.22) | benign(0) | TCGA-DF-A2KU-01 | Endometrium | uterine corpus endometrioid carcinoma | Female | Unknown | I/II | Unknown | Unknown | SD |
| GALK1 | SNV | Missense_Mutation | novel | c.174N>T | p.Glu58Asp | p.E58D | P51570 | protein_coding | tolerated(0.05) | benign(0.005) | TCGA-EY-A215-01 | Endometrium | uterine corpus endometrioid carcinoma | Female | <65 | I/II | Unknown | Unknown | SD |
| Page: 1 2 3 |
Top |
Related drugs of malignant transformation related genes |
| Identification of chemicals and drugs interact with genes involved in malignant transfromation |
| (DGIdb 4.0) |
| Entrez ID | Symbol | Category | Interaction Types | Drug Claim Name | Drug Name | PMIDs |
| 2584 | GALK1 | ENZYME, DRUGGABLE GENOME, KINASE | GNF-PF-67 | CHEMBL578512 | ||
| 2584 | GALK1 | ENZYME, DRUGGABLE GENOME, KINASE | GNF-PF-2272 | CHEMBL601757 | ||
| 2584 | GALK1 | ENZYME, DRUGGABLE GENOME, KINASE | HEXACHLOROPHENE | HEXACHLOROPHENE | ||
| 2584 | GALK1 | ENZYME, DRUGGABLE GENOME, KINASE | QUERCETIN | QUERCETIN | ||
| 2584 | GALK1 | ENZYME, DRUGGABLE GENOME, KINASE | DNDI1417080 | CHEMBL1498652 | ||
| 2584 | GALK1 | ENZYME, DRUGGABLE GENOME, KINASE | NSC-95397 | CHEMBL429095 | ||
| 2584 | GALK1 | ENZYME, DRUGGABLE GENOME, KINASE | AURINTRICARBOXYLIC ACID | AURINTRICARBOXYLIC ACID | ||
| 2584 | GALK1 | ENZYME, DRUGGABLE GENOME, KINASE | PYRANTEL PAMOATE | PYRANTEL PAMOATE | ||
| 2584 | GALK1 | ENZYME, DRUGGABLE GENOME, KINASE | TRICETIN | TRICETIN | ||
| 2584 | GALK1 | ENZYME, DRUGGABLE GENOME, KINASE | 9,10-PHENANTHRENEQUINONE | 9,10-PHENANTHRENEQUINONE |
| Page: 1 2 |

Copyright 2023-Present -The University of Texas Health Science Center at Houston |