
|
|||||
|
 | |
| |
| |
| |
| |
| |
|
Gene: GALE |
Gene summary for GALE |
| Gene information | Species | Human | Gene symbol | GALE | Gene ID | 2582 |
| Gene name | UDP-galactose-4-epimerase | |
| Gene Alias | SDR1E1 | |
| Cytomap | 1p36.11 | |
| Gene Type | protein-coding | GO ID | GO:0005975 | UniProtAcc | Q14376 |
Top |
Malignant transformation analysis |
| Identification of the aberrant gene expression in precancerous and cancerous lesions by comparing the gene expression of stem-like cells in diseased tissues with normal stem cells |
| Entrez ID | Symbol | Replicates | Species | Organ | Tissue | Adj P-value | Log2FC | Malignancy |
| 2582 | GALE | HTA11_2487_2000001011 | Human | Colorectum | SER | 1.87e-06 | 5.47e-01 | -0.1808 |
| 2582 | GALE | HTA11_347_2000001011 | Human | Colorectum | AD | 1.87e-03 | 2.84e-01 | -0.1954 |
| 2582 | GALE | HTA11_411_2000001011 | Human | Colorectum | SER | 1.99e-05 | 1.12e+00 | -0.2602 |
| 2582 | GALE | HTA11_2112_2000001011 | Human | Colorectum | SER | 4.15e-05 | 1.02e+00 | -0.2196 |
| 2582 | GALE | HTA11_696_2000001011 | Human | Colorectum | AD | 2.67e-02 | 3.17e-01 | -0.1464 |
| 2582 | GALE | HTA11_1391_2000001011 | Human | Colorectum | AD | 3.73e-04 | 3.49e-01 | -0.059 |
| 2582 | GALE | HTA11_99999971662_82457 | Human | Colorectum | MSS | 3.04e-05 | 3.65e-01 | 0.3859 |
| 2582 | GALE | A015-C-104 | Human | Colorectum | FAP | 1.01e-02 | -3.66e-02 | -0.1899 |
| 2582 | GALE | A002-C-116 | Human | Colorectum | FAP | 5.94e-03 | -1.06e-01 | -0.0452 |
| 2582 | GALE | LZE4T | Human | Esophagus | ESCC | 1.32e-02 | 5.23e-02 | 0.0811 |
| 2582 | GALE | LZE5T | Human | Esophagus | ESCC | 8.77e-05 | 3.10e-01 | 0.0514 |
| 2582 | GALE | LZE8T | Human | Esophagus | ESCC | 2.04e-07 | 2.28e-01 | 0.067 |
| 2582 | GALE | LZE20T | Human | Esophagus | ESCC | 1.23e-13 | 4.29e-01 | 0.0662 |
| 2582 | GALE | LZE22T | Human | Esophagus | ESCC | 5.89e-05 | 2.01e-01 | 0.068 |
| 2582 | GALE | LZE24T | Human | Esophagus | ESCC | 1.05e-11 | 2.38e-01 | 0.0596 |
| 2582 | GALE | LZE6T | Human | Esophagus | ESCC | 4.22e-04 | 3.31e-01 | 0.0845 |
| 2582 | GALE | P1T-E | Human | Esophagus | ESCC | 2.59e-06 | 5.35e-01 | 0.0875 |
| 2582 | GALE | P2T-E | Human | Esophagus | ESCC | 5.37e-22 | 3.58e-01 | 0.1177 |
| 2582 | GALE | P4T-E | Human | Esophagus | ESCC | 6.17e-04 | 1.30e-01 | 0.1323 |
| 2582 | GALE | P5T-E | Human | Esophagus | ESCC | 5.47e-20 | 4.26e-01 | 0.1327 |
| Page: 1 2 3 4 5 6 7 |
| Tissue | Expression Dynamics | Abbreviation |
| Colorectum (GSE201348) |  | FAP: Familial adenomatous polyposis |
| CRC: Colorectal cancer | ||
| Colorectum (HTA11) |  | AD: Adenomas |
| SER: Sessile serrated lesions | ||
| MSI-H: Microsatellite-high colorectal cancer | ||
| MSS: Microsatellite stable colorectal cancer | ||
| Esophagus |  | ESCC: Esophageal squamous cell carcinoma |
| HGIN: High-grade intraepithelial neoplasias | ||
| LGIN: Low-grade intraepithelial neoplasias | ||
| Liver | 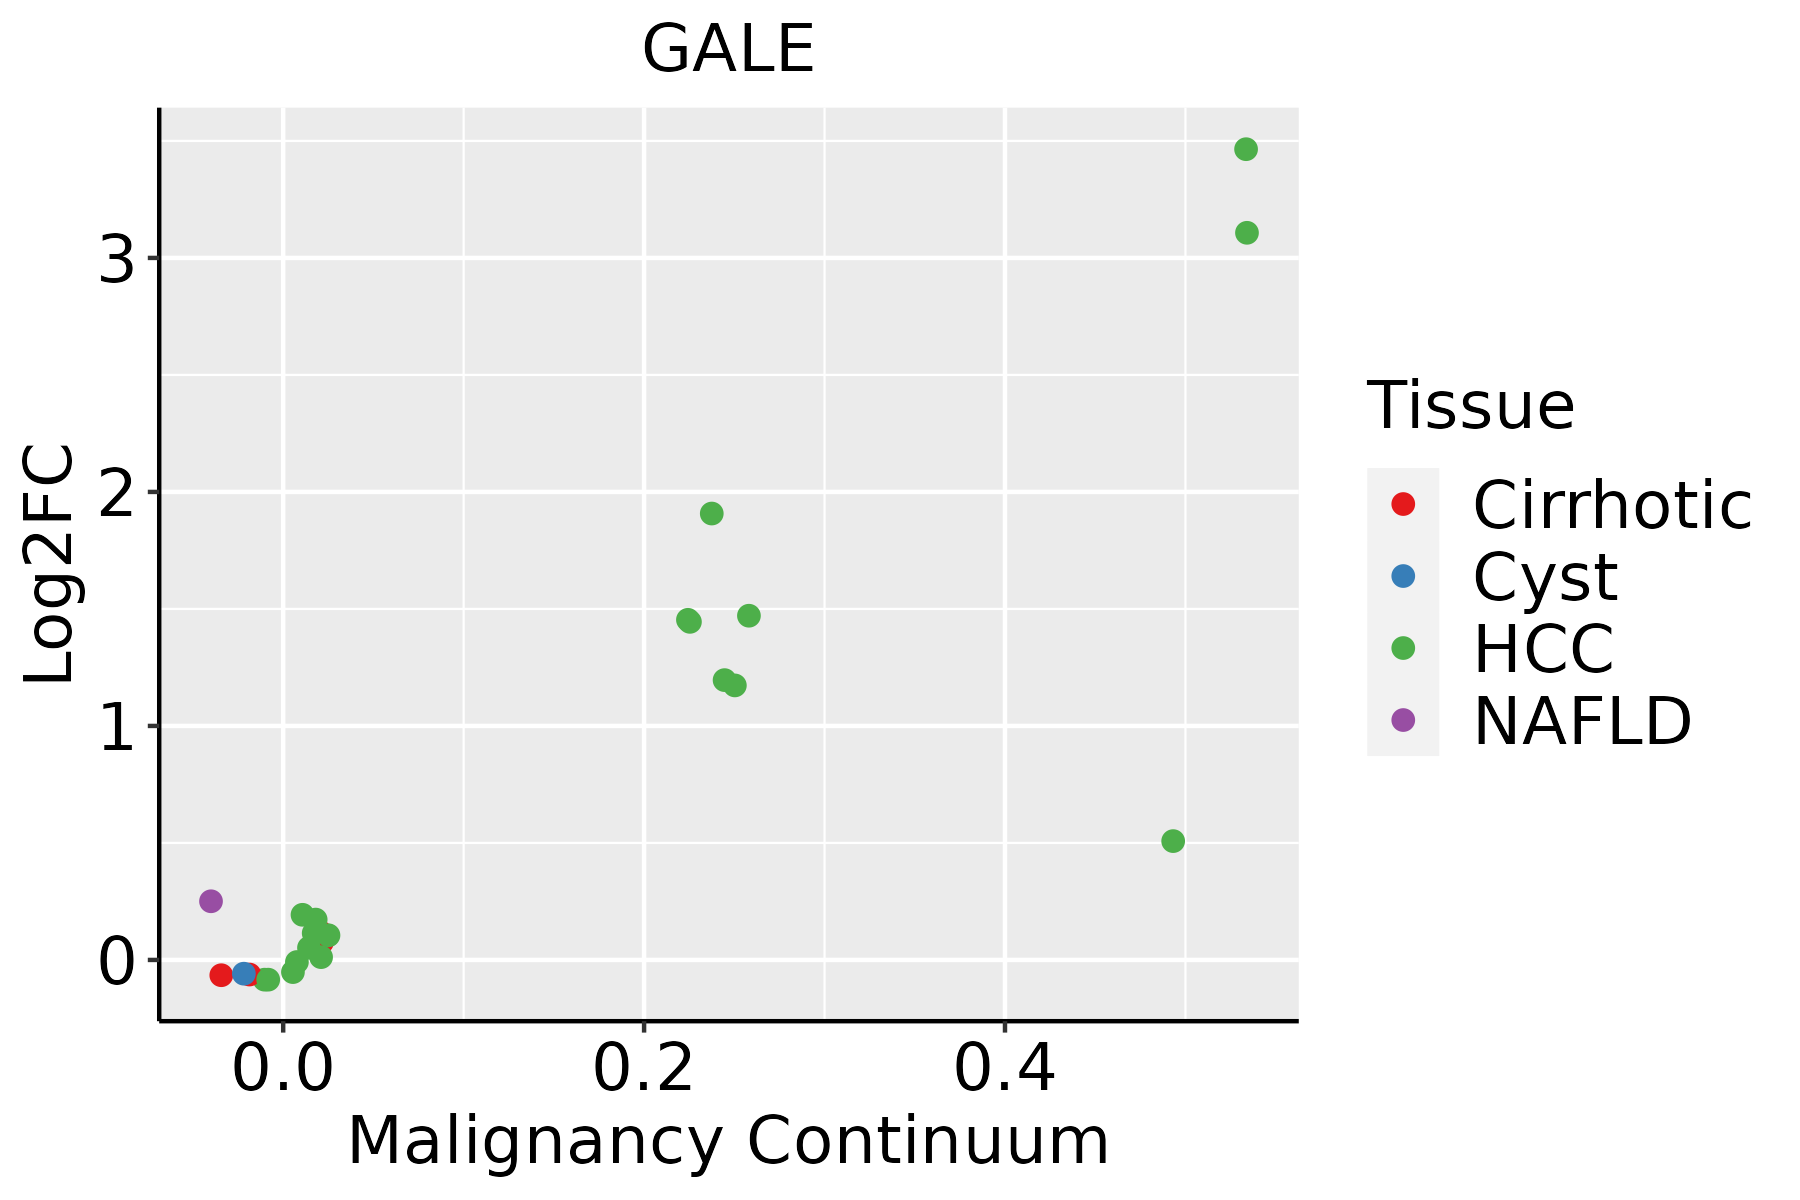 | HCC: Hepatocellular carcinoma |
| NAFLD: Non-alcoholic fatty liver disease | ||
| Oral Cavity | 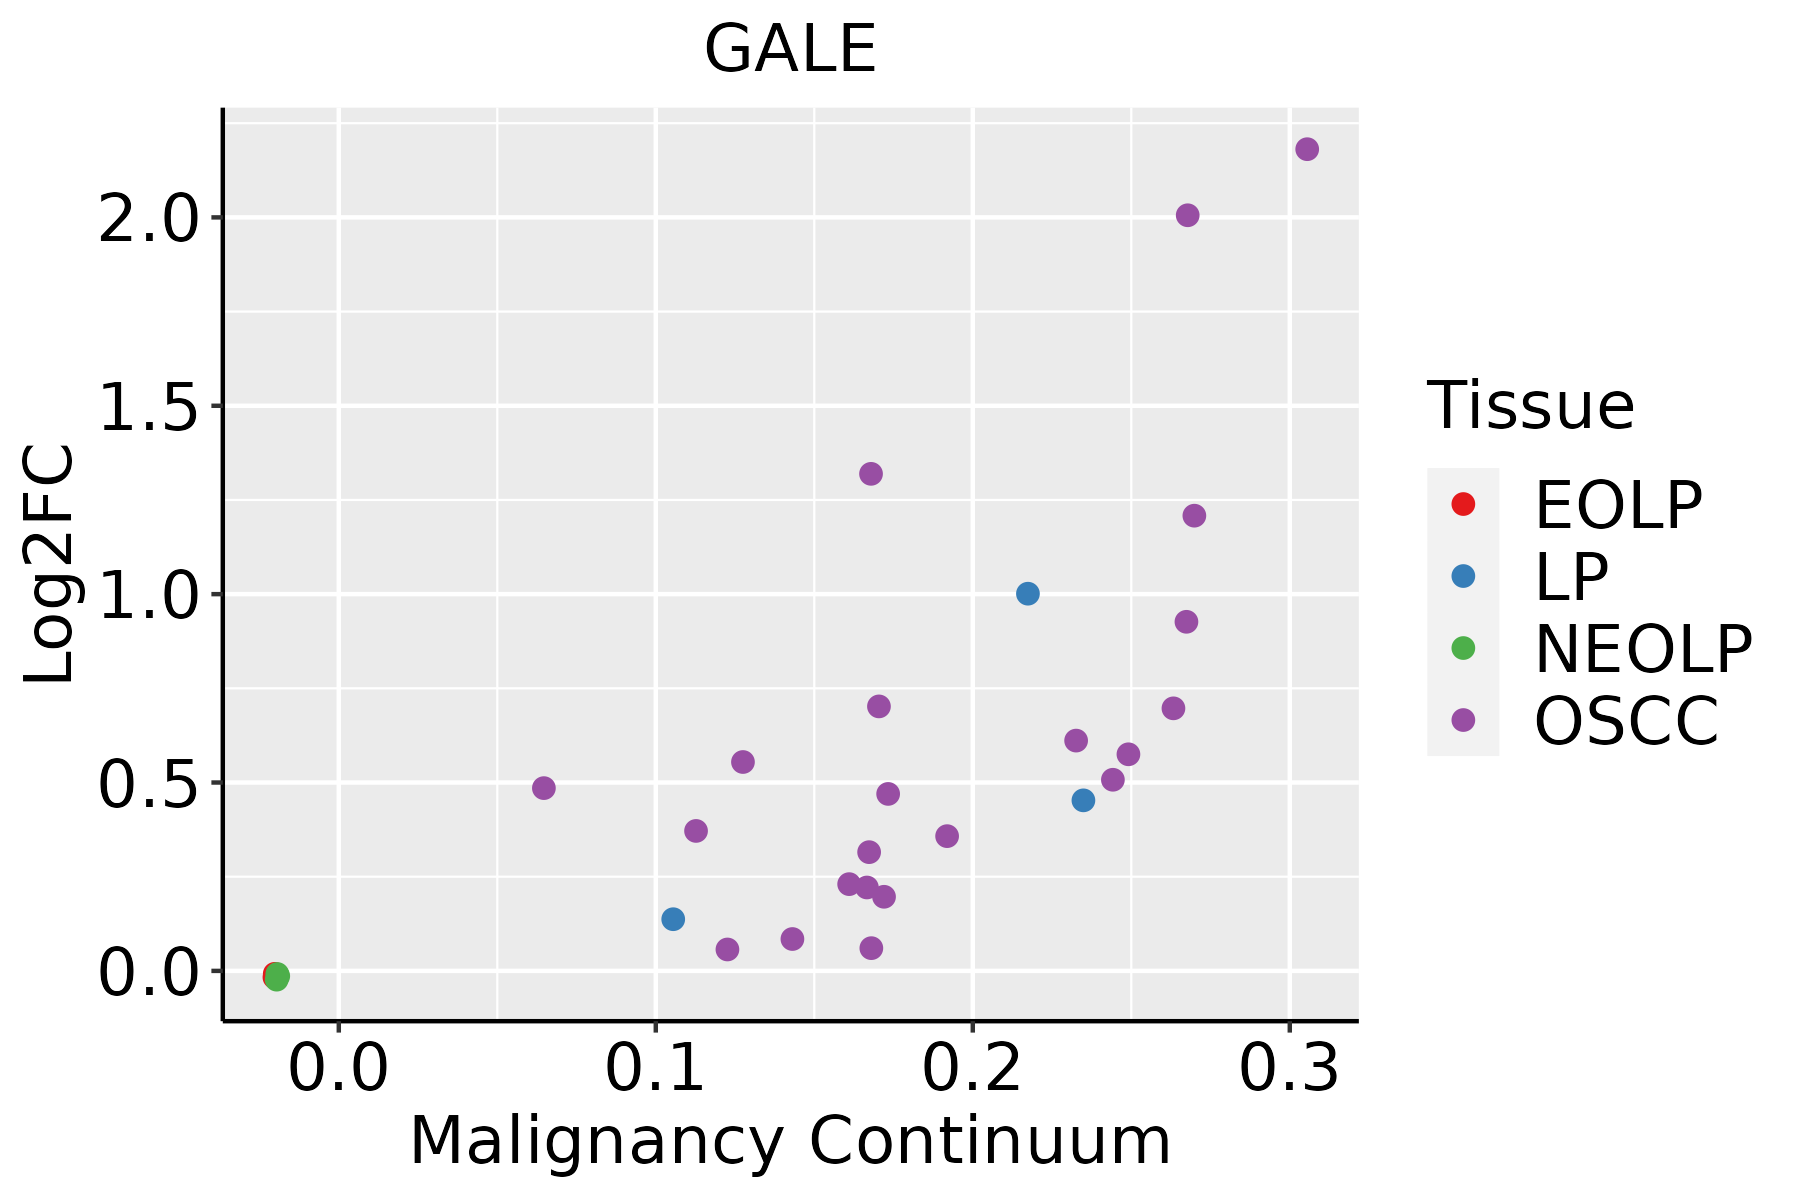 | EOLP: Erosive Oral lichen planus |
| LP: leukoplakia | ||
| NEOLP: Non-erosive oral lichen planus | ||
| OSCC: Oral squamous cell carcinoma | ||
| Skin | 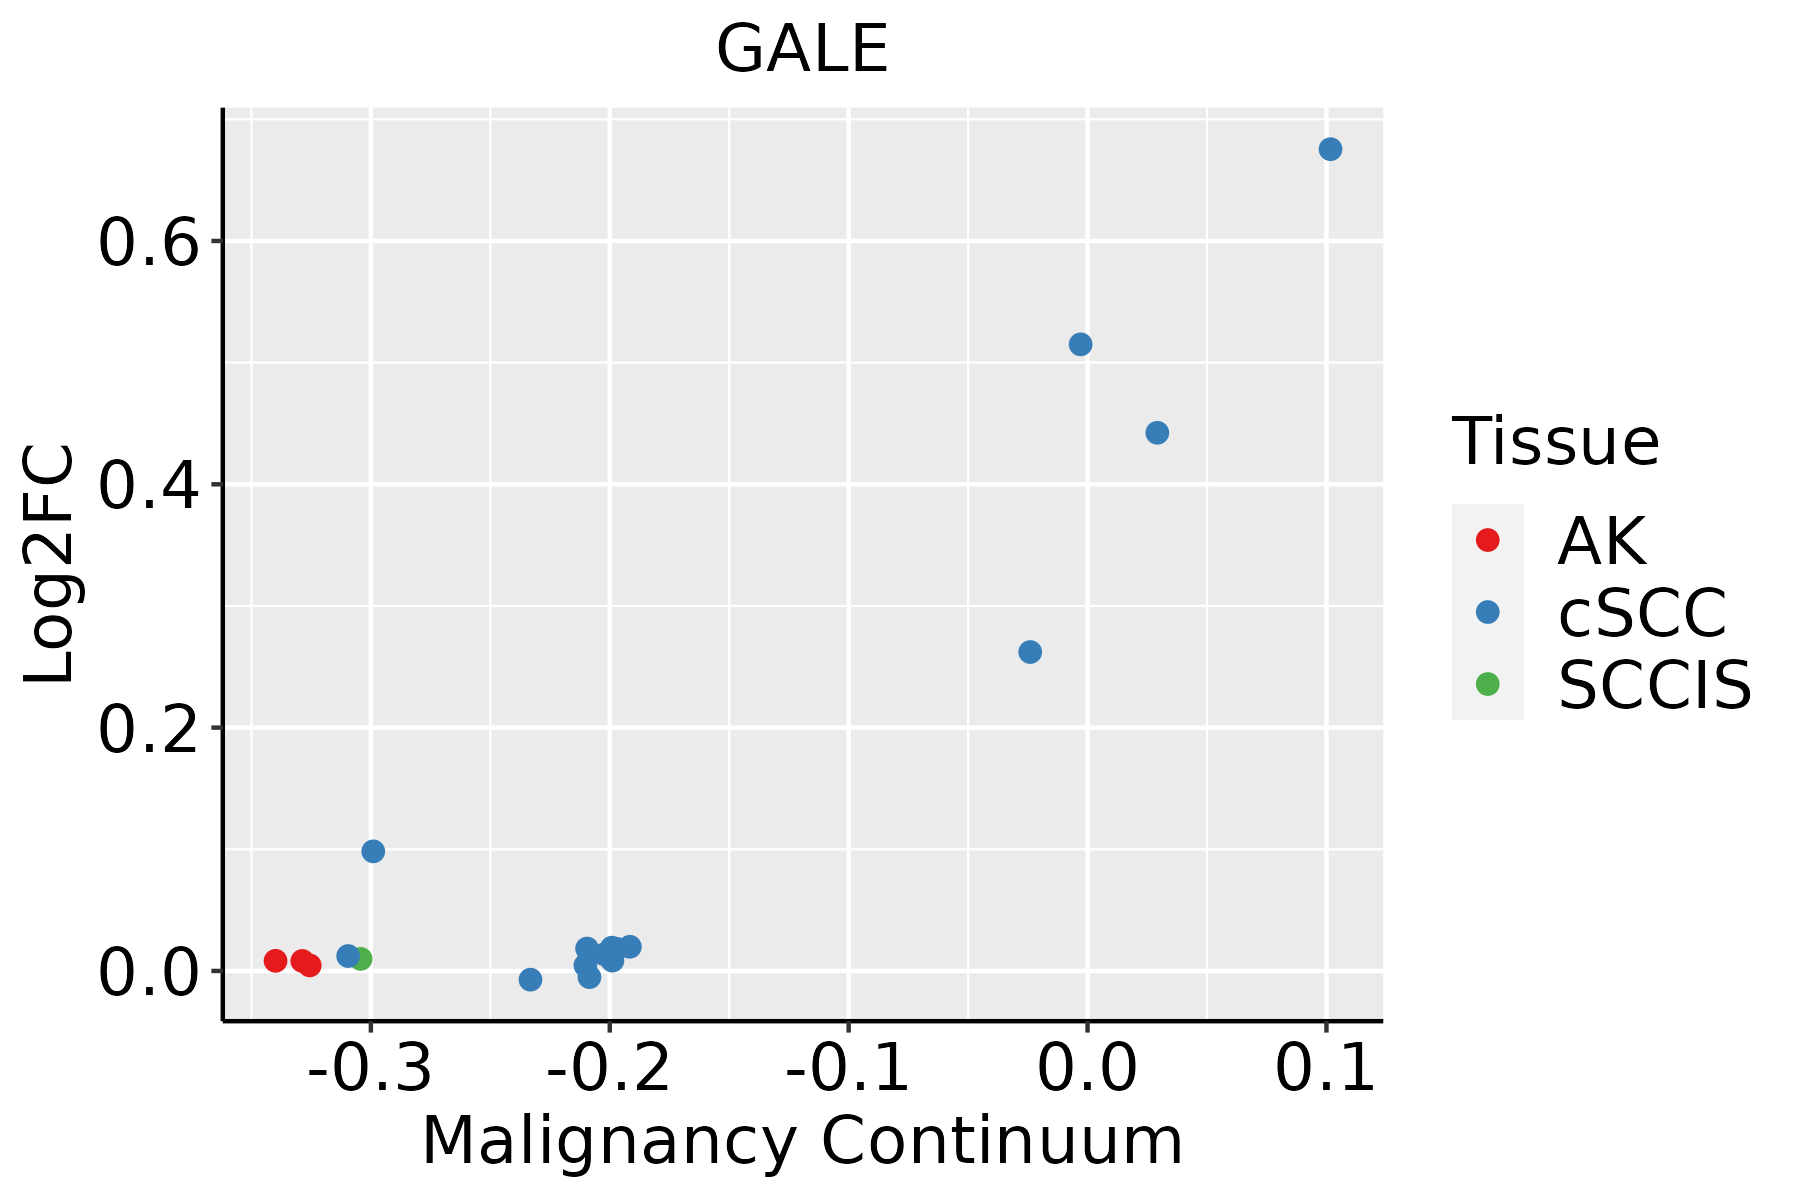 | AK: Actinic keratosis |
| cSCC: Cutaneous squamous cell carcinoma | ||
| SCCIS:squamous cell carcinoma in situ | ||
| Thyroid | 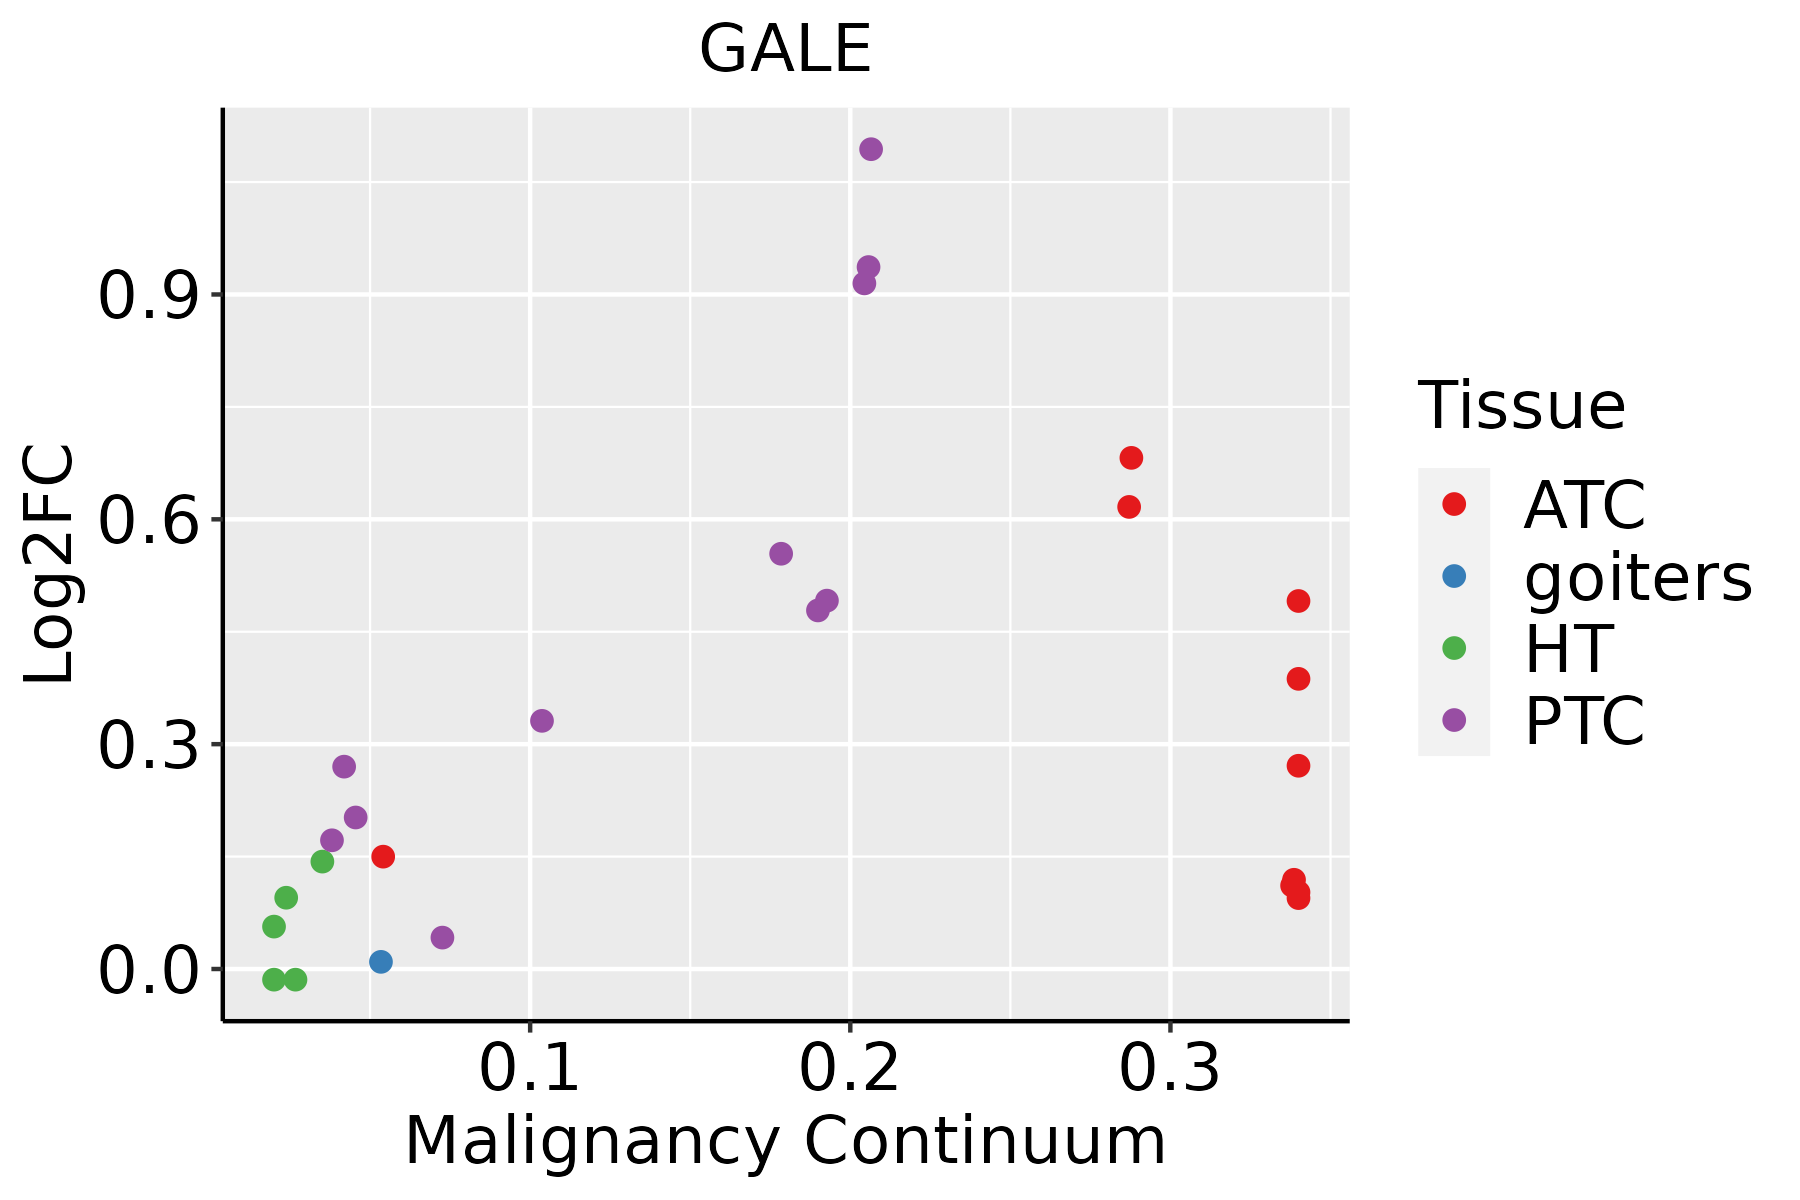 | ATC: Anaplastic thyroid cancer |
| HT: Hashimoto's thyroiditis | ||
| PTC: Papillary thyroid cancer |
| ∗log2FC in expression of this searched gene in stem-like cells from each diseased tissue sample relative to stem-like cells in normal samples in each tissue plotted against the malignancy continuum. Samples are colored based on if they are from different disease stage. |
Top |
Malignant transformation related pathway analysis |
| Find out the enriched GO biological processes and KEGG pathways involved in transition from healthy to precancer to cancer |
| Tissue | Disease Stage | Enriched GO biological Processes |
| Colorectum | AD |  |
| Colorectum | SER |  |
| Colorectum | MSS |  |
| Colorectum | MSI-H |  |
| Colorectum | FAP |  |
| ∗Top 15 enriched GO BP terms are showed in the bar plot of each disease state in each tissue. Each row represents a significant GO biological process which is colored according to the -log10(p.adjust). |
| Page: 1 2 3 4 5 6 7 8 9 |
| GO ID | Tissue | Disease Stage | Description | Gene Ratio | Bg Ratio | pvalue | p.adjust | Count |
| GO:0044282 | Colorectum | AD | small molecule catabolic process | 118/3918 | 376/18723 | 1.05e-06 | 3.55e-05 | 118 |
| GO:0016052 | Colorectum | AD | carbohydrate catabolic process | 56/3918 | 154/18723 | 7.01e-06 | 1.73e-04 | 56 |
| GO:0019318 | Colorectum | AD | hexose metabolic process | 77/3918 | 237/18723 | 1.96e-05 | 4.01e-04 | 77 |
| GO:0005996 | Colorectum | AD | monosaccharide metabolic process | 80/3918 | 257/18723 | 7.31e-05 | 1.17e-03 | 80 |
| GO:0019320 | Colorectum | AD | hexose catabolic process | 14/3918 | 34/18723 | 5.86e-03 | 3.69e-02 | 14 |
| GO:0006012 | Colorectum | AD | galactose metabolic process | 6/3918 | 10/18723 | 8.03e-03 | 4.73e-02 | 6 |
| GO:00442821 | Colorectum | SER | small molecule catabolic process | 87/2897 | 376/18723 | 5.31e-05 | 1.27e-03 | 87 |
| GO:00193181 | Colorectum | SER | hexose metabolic process | 56/2897 | 237/18723 | 6.19e-04 | 8.42e-03 | 56 |
| GO:00059961 | Colorectum | SER | monosaccharide metabolic process | 59/2897 | 257/18723 | 9.65e-04 | 1.15e-02 | 59 |
| GO:00160521 | Colorectum | SER | carbohydrate catabolic process | 38/2897 | 154/18723 | 1.92e-03 | 1.93e-02 | 38 |
| GO:00160522 | Colorectum | MSS | carbohydrate catabolic process | 45/3467 | 154/18723 | 7.93e-04 | 8.36e-03 | 45 |
| GO:00442822 | Colorectum | MSS | small molecule catabolic process | 94/3467 | 376/18723 | 9.85e-04 | 9.86e-03 | 94 |
| GO:00193182 | Colorectum | MSS | hexose metabolic process | 63/3467 | 237/18723 | 1.32e-03 | 1.25e-02 | 63 |
| GO:00059962 | Colorectum | MSS | monosaccharide metabolic process | 66/3467 | 257/18723 | 2.61e-03 | 2.06e-02 | 66 |
| GO:00060121 | Colorectum | MSS | galactose metabolic process | 6/3467 | 10/18723 | 4.25e-03 | 3.04e-02 | 6 |
| GO:00160523 | Colorectum | FAP | carbohydrate catabolic process | 44/2622 | 154/18723 | 1.82e-06 | 7.42e-05 | 44 |
| GO:00193183 | Colorectum | FAP | hexose metabolic process | 58/2622 | 237/18723 | 1.09e-05 | 3.08e-04 | 58 |
| GO:00059963 | Colorectum | FAP | monosaccharide metabolic process | 59/2622 | 257/18723 | 6.79e-05 | 1.28e-03 | 59 |
| GO:00193201 | Colorectum | FAP | hexose catabolic process | 14/2622 | 34/18723 | 9.46e-05 | 1.61e-03 | 14 |
| GO:00442823 | Colorectum | FAP | small molecule catabolic process | 77/2622 | 376/18723 | 3.25e-04 | 4.16e-03 | 77 |
| Page: 1 2 3 |
| Pathway ID | Tissue | Disease Stage | Description | Gene Ratio | Bg Ratio | pvalue | p.adjust | qvalue | Count |
| hsa00052 | Colorectum | FAP | Galactose metabolism | 12/1404 | 32/8465 | 3.61e-03 | 1.53e-02 | 9.29e-03 | 12 |
| hsa000521 | Colorectum | FAP | Galactose metabolism | 12/1404 | 32/8465 | 3.61e-03 | 1.53e-02 | 9.29e-03 | 12 |
| hsa012505 | Esophagus | ESCC | Biosynthesis of nucleotide sugars | 28/4205 | 37/8465 | 1.10e-03 | 3.42e-03 | 1.75e-03 | 28 |
| hsa005202 | Esophagus | ESCC | Amino sugar and nucleotide sugar metabolism | 35/4205 | 49/8465 | 1.60e-03 | 4.88e-03 | 2.50e-03 | 35 |
| hsa0125012 | Esophagus | ESCC | Biosynthesis of nucleotide sugars | 28/4205 | 37/8465 | 1.10e-03 | 3.42e-03 | 1.75e-03 | 28 |
| hsa0052011 | Esophagus | ESCC | Amino sugar and nucleotide sugar metabolism | 35/4205 | 49/8465 | 1.60e-03 | 4.88e-03 | 2.50e-03 | 35 |
| hsa00520 | Oral cavity | OSCC | Amino sugar and nucleotide sugar metabolism | 34/3704 | 49/8465 | 2.48e-04 | 8.08e-04 | 4.11e-04 | 34 |
| hsa012504 | Oral cavity | OSCC | Biosynthesis of nucleotide sugars | 25/3704 | 37/8465 | 2.93e-03 | 7.49e-03 | 3.81e-03 | 25 |
| hsa005201 | Oral cavity | OSCC | Amino sugar and nucleotide sugar metabolism | 34/3704 | 49/8465 | 2.48e-04 | 8.08e-04 | 4.11e-04 | 34 |
| hsa0125011 | Oral cavity | OSCC | Biosynthesis of nucleotide sugars | 25/3704 | 37/8465 | 2.93e-03 | 7.49e-03 | 3.81e-03 | 25 |
| Page: 1 |
Top |
Cell-cell communication analysis |
| Identification of potential cell-cell interactions between two cell types and their ligand-receptor pairs for different disease states |
| Ligand | Receptor | LRpair | Pathway | Tissue | Disease Stage |
| Page: 1 |
Top |
Single-cell gene regulatory network inference analysis |
| Find out the significant the regulons (TFs) and the target genes of each regulon across cell types for different disease states |
| TF | Cell Type | Tissue | Disease Stage | Target Gene | RSS | Regulon Activity |
| ∗The dot plots of a searched regulon are shown for all cell subpopulations in each disease state of each tissue based on the regulon specific score inferred using pySCENIC and by calculating the average expression. |
| Page: 1 |
Top |
Somatic mutation of malignant transformation related genes |
| Annotation of somatic variants for genes involved in malignant transformation |
| Hugo Symbol | Variant Class | Variant Classification | dbSNP RS | HGVSc | HGVSp | HGVSp Short | SWISSPROT | BIOTYPE | SIFT | PolyPhen | Tumor Sample Barcode | Tissue | Histology | Sex | Age | Stage | Therapy Types | Drugs | Outcome |
| GALE | SNV | Missense_Mutation | novel | c.1033N>A | p.Gly345Ser | p.G345S | Q14376 | protein_coding | tolerated(0.53) | benign(0) | TCGA-AC-A7VC-01 | Breast | breast invasive carcinoma | Female | <65 | I/II | Unknown | Unknown | SD |
| GALE | insertion | In_Frame_Ins | novel | c.484_485insATTCAGTGCTGCAGATGGTCCAGGCTATGG | p.Phe162delinsTyrSerValLeuGlnMetValGlnAlaMetVal | p.F162delinsYSVLQMVQAMV | Q14376 | protein_coding | TCGA-B6-A0IN-01 | Breast | breast invasive carcinoma | Female | <65 | I/II | Unknown | Unknown | PD | ||
| GALE | SNV | Missense_Mutation | rs201455293 | c.656G>A | p.Arg219Gln | p.R219Q | Q14376 | protein_coding | tolerated(0.07) | benign(0.327) | TCGA-EA-A3QD-01 | Cervix | cervical & endocervical cancer | Female | <65 | III/IV | Chemotherapy | cisplatin | CR |
| GALE | SNV | Missense_Mutation | rs553417178 | c.286N>A | p.Glu96Lys | p.E96K | Q14376 | protein_coding | deleterious(0) | probably_damaging(0.976) | TCGA-A6-6653-01 | Colorectum | colon adenocarcinoma | Male | >=65 | I/II | Unknown | Unknown | SD |
| GALE | SNV | Missense_Mutation | rs121908047 | c.280N>A | p.Val94Met | p.V94M | Q14376 | protein_coding | deleterious(0.02) | probably_damaging(0.94) | TCGA-AA-3811-01 | Colorectum | colon adenocarcinoma | Female | >=65 | III/IV | Unknown | Unknown | PD |
| GALE | SNV | Missense_Mutation | novel | c.169N>T | p.Gly57Cys | p.G57C | Q14376 | protein_coding | deleterious(0) | probably_damaging(0.992) | TCGA-AA-3950-01 | Colorectum | colon adenocarcinoma | Female | >=65 | I/II | Unknown | Unknown | SD |
| GALE | SNV | Missense_Mutation | rs775614393 | c.173G>A | p.Arg58His | p.R58H | Q14376 | protein_coding | deleterious(0.02) | benign(0.4) | TCGA-CM-4746-01 | Colorectum | colon adenocarcinoma | Male | <65 | I/II | Unknown | Unknown | SD |
| GALE | SNV | Missense_Mutation | novel | c.699N>T | p.Glu233Asp | p.E233D | Q14376 | protein_coding | tolerated(0.38) | benign(0) | TCGA-A5-A0G2-01 | Endometrium | uterine corpus endometrioid carcinoma | Female | <65 | III/IV | Unknown | Unknown | SD |
| GALE | SNV | Missense_Mutation | rs201437329 | c.266N>T | p.Ala89Val | p.A89V | Q14376 | protein_coding | deleterious(0) | probably_damaging(1) | TCGA-A5-A0G2-01 | Endometrium | uterine corpus endometrioid carcinoma | Female | <65 | III/IV | Unknown | Unknown | SD |
| GALE | SNV | Missense_Mutation | novel | c.25N>T | p.Gly9Cys | p.G9C | Q14376 | protein_coding | deleterious(0) | probably_damaging(1) | TCGA-A5-A0G2-01 | Endometrium | uterine corpus endometrioid carcinoma | Female | <65 | III/IV | Unknown | Unknown | SD |
| Page: 1 2 3 |
Top |
Related drugs of malignant transformation related genes |
| Identification of chemicals and drugs interact with genes involved in malignant transfromation |
| (DGIdb 4.0) |
| Entrez ID | Symbol | Category | Interaction Types | Drug Claim Name | Drug Name | PMIDs |
| Page: 1 |

Copyright 2023-Present -The University of Texas Health Science Center at Houston |