
|
|||||
|
 | |
| |
| |
| |
| |
| |
|
Gene: GALC |
Gene summary for GALC |
| Gene information | Species | Human | Gene symbol | GALC | Gene ID | 2581 |
| Gene name | galactosylceramidase | |
| Gene Alias | GALC | |
| Cytomap | 14q31.3 | |
| Gene Type | protein-coding | GO ID | GO:0006629 | UniProtAcc | A0A0A0MQV0 |
Top |
Malignant transformation analysis |
| Identification of the aberrant gene expression in precancerous and cancerous lesions by comparing the gene expression of stem-like cells in diseased tissues with normal stem cells |
| Entrez ID | Symbol | Replicates | Species | Organ | Tissue | Adj P-value | Log2FC | Malignancy |
| 2581 | GALC | LZE4T | Human | Esophagus | ESCC | 7.32e-03 | 1.03e-01 | 0.0811 |
| 2581 | GALC | LZE5T | Human | Esophagus | ESCC | 5.87e-04 | 2.31e-01 | 0.0514 |
| 2581 | GALC | P2T-E | Human | Esophagus | ESCC | 2.95e-06 | 1.83e-01 | 0.1177 |
| 2581 | GALC | P4T-E | Human | Esophagus | ESCC | 1.81e-05 | 7.34e-02 | 0.1323 |
| 2581 | GALC | P8T-E | Human | Esophagus | ESCC | 9.76e-09 | 1.94e-01 | 0.0889 |
| 2581 | GALC | P10T-E | Human | Esophagus | ESCC | 5.96e-16 | 2.89e-01 | 0.116 |
| 2581 | GALC | P11T-E | Human | Esophagus | ESCC | 3.85e-08 | 2.59e-01 | 0.1426 |
| 2581 | GALC | P12T-E | Human | Esophagus | ESCC | 8.93e-13 | 3.53e-01 | 0.1122 |
| 2581 | GALC | P15T-E | Human | Esophagus | ESCC | 3.20e-21 | 3.76e-01 | 0.1149 |
| 2581 | GALC | P16T-E | Human | Esophagus | ESCC | 4.47e-08 | 1.94e-01 | 0.1153 |
| 2581 | GALC | P17T-E | Human | Esophagus | ESCC | 4.35e-03 | 2.35e-01 | 0.1278 |
| 2581 | GALC | P22T-E | Human | Esophagus | ESCC | 7.02e-07 | 7.89e-02 | 0.1236 |
| 2581 | GALC | P23T-E | Human | Esophagus | ESCC | 1.26e-04 | 9.23e-02 | 0.108 |
| 2581 | GALC | P24T-E | Human | Esophagus | ESCC | 1.94e-08 | 6.37e-02 | 0.1287 |
| 2581 | GALC | P26T-E | Human | Esophagus | ESCC | 1.15e-14 | 3.40e-01 | 0.1276 |
| 2581 | GALC | P27T-E | Human | Esophagus | ESCC | 7.73e-13 | 1.14e-01 | 0.1055 |
| 2581 | GALC | P28T-E | Human | Esophagus | ESCC | 1.44e-11 | 7.51e-02 | 0.1149 |
| 2581 | GALC | P32T-E | Human | Esophagus | ESCC | 1.79e-12 | 1.24e-01 | 0.1666 |
| 2581 | GALC | P36T-E | Human | Esophagus | ESCC | 4.75e-03 | 1.20e-01 | 0.1187 |
| 2581 | GALC | P37T-E | Human | Esophagus | ESCC | 1.75e-15 | 2.08e-01 | 0.1371 |
| Page: 1 2 3 |
| Tissue | Expression Dynamics | Abbreviation |
| Esophagus | 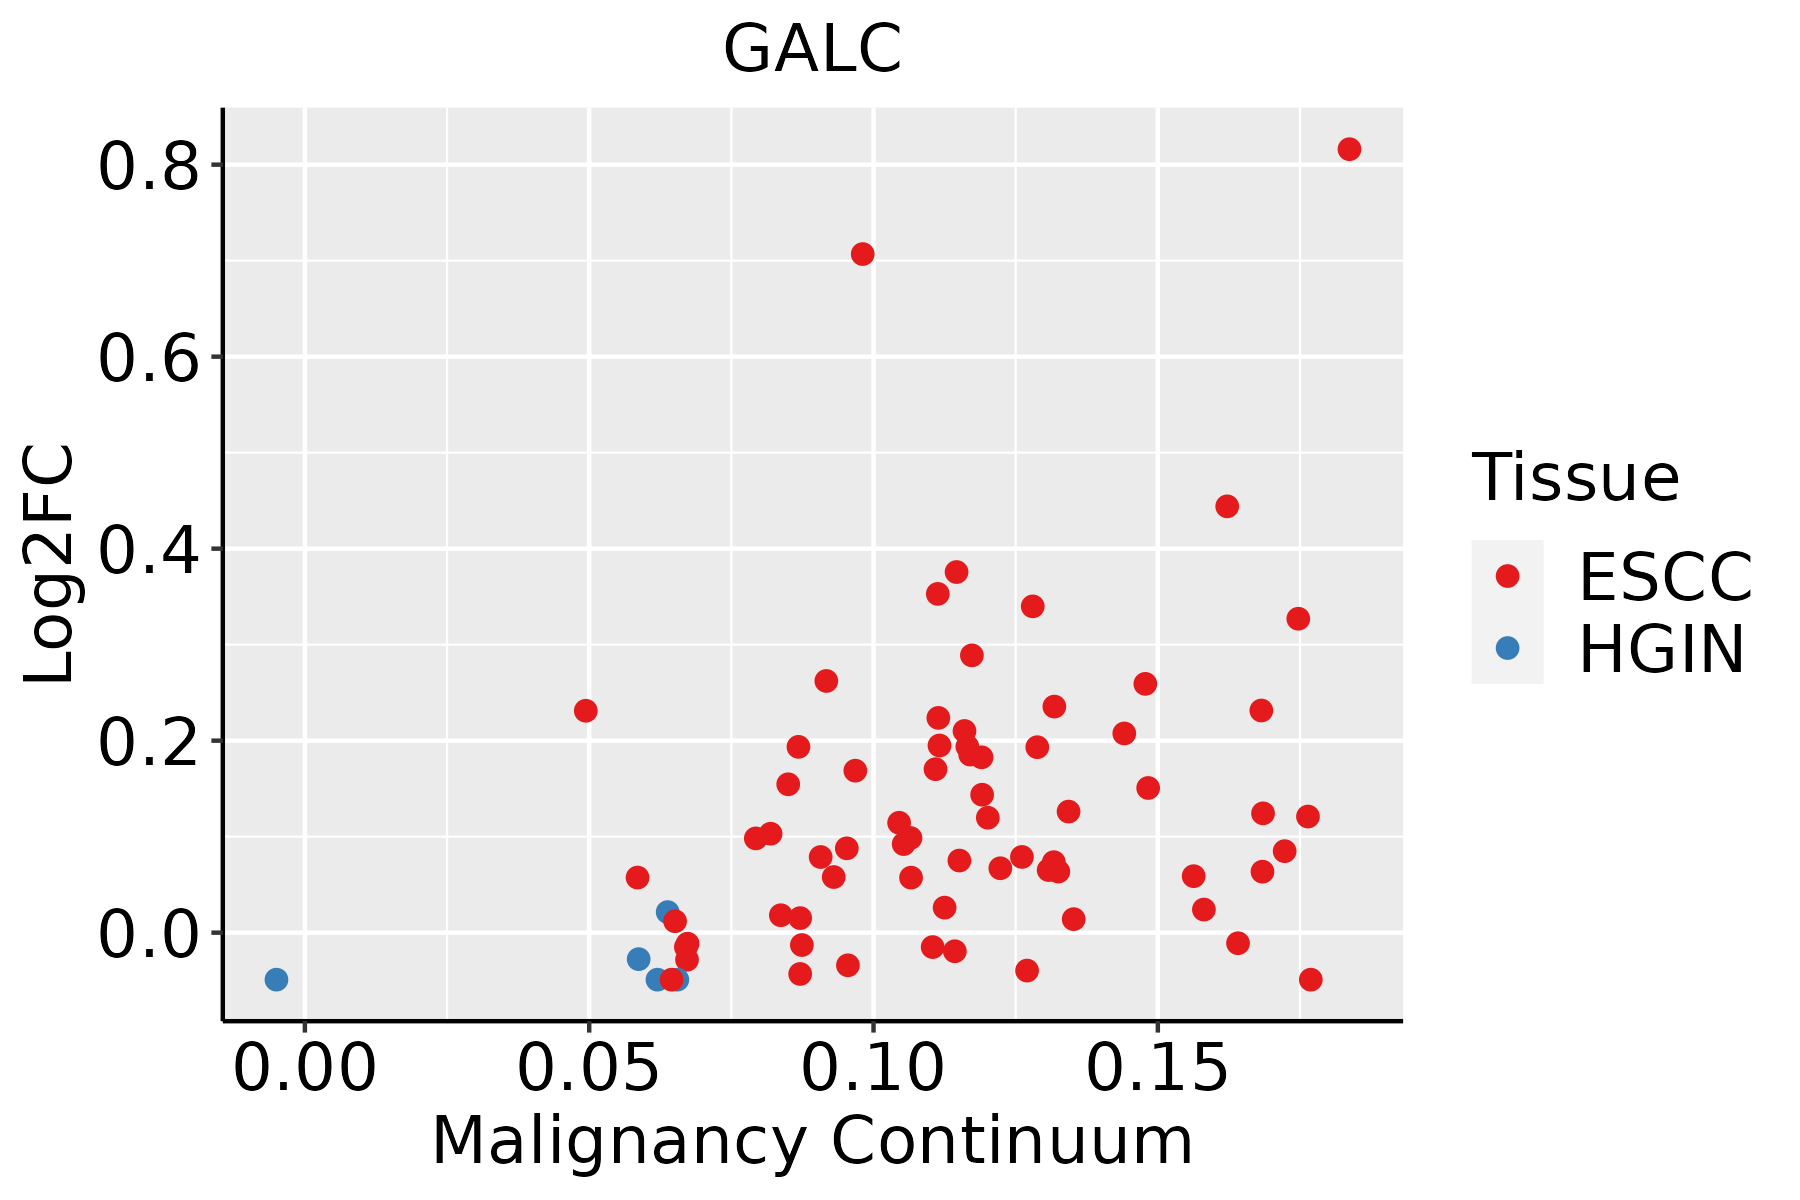 | ESCC: Esophageal squamous cell carcinoma |
| HGIN: High-grade intraepithelial neoplasias | ||
| LGIN: Low-grade intraepithelial neoplasias | ||
| Oral Cavity |  | EOLP: Erosive Oral lichen planus |
| LP: leukoplakia | ||
| NEOLP: Non-erosive oral lichen planus | ||
| OSCC: Oral squamous cell carcinoma |
| ∗log2FC in expression of this searched gene in stem-like cells from each diseased tissue sample relative to stem-like cells in normal samples in each tissue plotted against the malignancy continuum. Samples are colored based on if they are from different disease stage. |
Top |
Malignant transformation related pathway analysis |
| Find out the enriched GO biological processes and KEGG pathways involved in transition from healthy to precancer to cancer |
| Tissue | Disease Stage | Enriched GO biological Processes |
| Colorectum | AD |  |
| Colorectum | SER |  |
| Colorectum | MSS |  |
| Colorectum | MSI-H |  |
| Colorectum | FAP |  |
| ∗Top 15 enriched GO BP terms are showed in the bar plot of each disease state in each tissue. Each row represents a significant GO biological process which is colored according to the -log10(p.adjust). |
| Page: 1 2 3 4 5 6 7 8 9 |
| GO ID | Tissue | Disease Stage | Description | Gene Ratio | Bg Ratio | pvalue | p.adjust | Count |
| GO:00066433 | Esophagus | ESCC | membrane lipid metabolic process | 130/8552 | 203/18723 | 9.29e-08 | 1.54e-06 | 130 |
| GO:00425524 | Esophagus | ESCC | myelination | 85/8552 | 134/18723 | 2.51e-05 | 2.13e-04 | 85 |
| GO:00072724 | Esophagus | ESCC | ensheathment of neurons | 86/8552 | 136/18723 | 2.68e-05 | 2.24e-04 | 86 |
| GO:00083664 | Esophagus | ESCC | axon ensheathment | 86/8552 | 136/18723 | 2.68e-05 | 2.24e-04 | 86 |
| GO:00066652 | Esophagus | ESCC | sphingolipid metabolic process | 96/8552 | 155/18723 | 3.21e-05 | 2.66e-04 | 96 |
| GO:00066642 | Esophagus | ESCC | glycolipid metabolic process | 63/8552 | 100/18723 | 3.55e-04 | 2.06e-03 | 63 |
| GO:19035092 | Esophagus | ESCC | liposaccharide metabolic process | 63/8552 | 101/18723 | 5.25e-04 | 2.90e-03 | 63 |
| GO:00442427 | Esophagus | ESCC | cellular lipid catabolic process | 121/8552 | 214/18723 | 8.63e-04 | 4.43e-03 | 121 |
| GO:19011362 | Esophagus | ESCC | carbohydrate derivative catabolic process | 99/8552 | 172/18723 | 1.11e-03 | 5.54e-03 | 99 |
| GO:00066721 | Esophagus | ESCC | ceramide metabolic process | 61/8552 | 102/18723 | 2.82e-03 | 1.19e-02 | 61 |
| GO:00160427 | Esophagus | ESCC | lipid catabolic process | 168/8552 | 320/18723 | 7.97e-03 | 2.84e-02 | 168 |
| GO:00066432 | Oral cavity | OSCC | membrane lipid metabolic process | 111/7305 | 203/18723 | 4.02e-06 | 4.69e-05 | 111 |
| GO:00066651 | Oral cavity | OSCC | sphingolipid metabolic process | 84/7305 | 155/18723 | 8.64e-05 | 6.61e-04 | 84 |
| GO:19011361 | Oral cavity | OSCC | carbohydrate derivative catabolic process | 89/7305 | 172/18723 | 4.52e-04 | 2.73e-03 | 89 |
| GO:00072723 | Oral cavity | OSCC | ensheathment of neurons | 72/7305 | 136/18723 | 6.59e-04 | 3.70e-03 | 72 |
| GO:00083663 | Oral cavity | OSCC | axon ensheathment | 72/7305 | 136/18723 | 6.59e-04 | 3.70e-03 | 72 |
| GO:00425523 | Oral cavity | OSCC | myelination | 71/7305 | 134/18723 | 6.93e-04 | 3.86e-03 | 71 |
| GO:00442426 | Oral cavity | OSCC | cellular lipid catabolic process | 104/7305 | 214/18723 | 2.61e-03 | 1.15e-02 | 104 |
| GO:00066641 | Oral cavity | OSCC | glycolipid metabolic process | 53/7305 | 100/18723 | 3.09e-03 | 1.33e-02 | 53 |
| GO:19035091 | Oral cavity | OSCC | liposaccharide metabolic process | 53/7305 | 101/18723 | 4.06e-03 | 1.66e-02 | 53 |
| Page: 1 2 |
| Pathway ID | Tissue | Disease Stage | Description | Gene Ratio | Bg Ratio | pvalue | p.adjust | qvalue | Count |
| hsa0414222 | Esophagus | ESCC | Lysosome | 102/4205 | 132/8465 | 5.11e-11 | 7.13e-10 | 3.65e-10 | 102 |
| hsa006003 | Esophagus | ESCC | Sphingolipid metabolism | 36/4205 | 53/8465 | 5.41e-03 | 1.36e-02 | 6.99e-03 | 36 |
| hsa0414232 | Esophagus | ESCC | Lysosome | 102/4205 | 132/8465 | 5.11e-11 | 7.13e-10 | 3.65e-10 | 102 |
| hsa0060012 | Esophagus | ESCC | Sphingolipid metabolism | 36/4205 | 53/8465 | 5.41e-03 | 1.36e-02 | 6.99e-03 | 36 |
| hsa041425 | Oral cavity | OSCC | Lysosome | 87/3704 | 132/8465 | 1.97e-07 | 1.35e-06 | 6.86e-07 | 87 |
| hsa006002 | Oral cavity | OSCC | Sphingolipid metabolism | 33/3704 | 53/8465 | 5.00e-03 | 1.20e-02 | 6.13e-03 | 33 |
| hsa0414212 | Oral cavity | OSCC | Lysosome | 87/3704 | 132/8465 | 1.97e-07 | 1.35e-06 | 6.86e-07 | 87 |
| hsa0060011 | Oral cavity | OSCC | Sphingolipid metabolism | 33/3704 | 53/8465 | 5.00e-03 | 1.20e-02 | 6.13e-03 | 33 |
| Page: 1 |
Top |
Cell-cell communication analysis |
| Identification of potential cell-cell interactions between two cell types and their ligand-receptor pairs for different disease states |
| Ligand | Receptor | LRpair | Pathway | Tissue | Disease Stage |
| Page: 1 |
Top |
Single-cell gene regulatory network inference analysis |
| Find out the significant the regulons (TFs) and the target genes of each regulon across cell types for different disease states |
| TF | Cell Type | Tissue | Disease Stage | Target Gene | RSS | Regulon Activity |
| ∗The dot plots of a searched regulon are shown for all cell subpopulations in each disease state of each tissue based on the regulon specific score inferred using pySCENIC and by calculating the average expression. |
| Page: 1 |
Top |
Somatic mutation of malignant transformation related genes |
| Annotation of somatic variants for genes involved in malignant transformation |
| Hugo Symbol | Variant Class | Variant Classification | dbSNP RS | HGVSc | HGVSp | HGVSp Short | SWISSPROT | BIOTYPE | SIFT | PolyPhen | Tumor Sample Barcode | Tissue | Histology | Sex | Age | Stage | Therapy Types | Drugs | Outcome |
| GALC | SNV | Missense_Mutation | c.235C>G | p.Arg79Gly | p.R79G | P54803 | protein_coding | deleterious(0) | probably_damaging(0.992) | TCGA-E9-A1R5-01 | Breast | breast invasive carcinoma | Female | <65 | I/II | Hormone Therapy | tamoxiphen | SD | |
| GALC | insertion | Frame_Shift_Ins | novel | c.627_628insG | p.Arg210GlufsTer18 | p.R210Efs*18 | P54803 | protein_coding | TCGA-A7-A26I-01 | Breast | breast invasive carcinoma | Female | >=65 | I/II | Chemotherapy | cytoxan | SD | ||
| GALC | insertion | Frame_Shift_Ins | novel | c.626_627insTAAA | p.Leu209PhefsTer20 | p.L209Ffs*20 | P54803 | protein_coding | TCGA-A7-A26I-01 | Breast | breast invasive carcinoma | Female | >=65 | I/II | Chemotherapy | cytoxan | SD | ||
| GALC | deletion | Frame_Shift_Del | c.408delN | p.Ala137LeufsTer34 | p.A137Lfs*34 | P54803 | protein_coding | TCGA-D8-A27V-01 | Breast | breast invasive carcinoma | Female | <65 | I/II | Hormone Therapy | tamoxiphen | SD | |||
| GALC | SNV | Missense_Mutation | novel | c.962N>A | p.Arg321Lys | p.R321K | P54803 | protein_coding | tolerated(0.19) | benign(0.011) | TCGA-2W-A8YY-01 | Cervix | cervical & endocervical cancer | Female | <65 | I/II | Chemotherapy | cisplatin | CR |
| GALC | SNV | Missense_Mutation | novel | c.544N>A | p.Ala182Thr | p.A182T | P54803 | protein_coding | deleterious(0) | possibly_damaging(0.827) | TCGA-2W-A8YY-01 | Cervix | cervical & endocervical cancer | Female | <65 | I/II | Chemotherapy | cisplatin | CR |
| GALC | SNV | Missense_Mutation | novel | c.776N>T | p.Ser259Leu | p.S259L | P54803 | protein_coding | deleterious(0.01) | benign(0.049) | TCGA-FU-A3NI-01 | Cervix | cervical & endocervical cancer | Female | <65 | I/II | Unknown | Unknown | SD |
| GALC | SNV | Missense_Mutation | c.1888T>C | p.Tyr630His | p.Y630H | P54803 | protein_coding | tolerated(0.64) | benign(0.031) | TCGA-A6-5665-01 | Colorectum | colon adenocarcinoma | Female | >=65 | I/II | Unknown | Unknown | PD | |
| GALC | SNV | Missense_Mutation | c.1931T>A | p.Met644Lys | p.M644K | P54803 | protein_coding | tolerated(0.31) | benign(0.003) | TCGA-AA-3715-01 | Colorectum | colon adenocarcinoma | Male | >=65 | I/II | Unknown | Unknown | PD | |
| GALC | SNV | Missense_Mutation | novel | c.692A>G | p.Glu231Gly | p.E231G | P54803 | protein_coding | tolerated(0.05) | benign(0.012) | TCGA-CA-6717-01 | Colorectum | colon adenocarcinoma | Male | <65 | I/II | Chemotherapy | oxaliplatin | CR |
| Page: 1 2 3 4 5 6 7 8 9 |
Top |
Related drugs of malignant transformation related genes |
| Identification of chemicals and drugs interact with genes involved in malignant transfromation |
| (DGIdb 4.0) |
| Entrez ID | Symbol | Category | Interaction Types | Drug Claim Name | Drug Name | PMIDs |
| 2581 | GALC | ENZYME, DRUGGABLE GENOME | BUSULFAN | BUSULFAN | 2034480,8101401 |
| Page: 1 |

Copyright 2023-Present -The University of Texas Health Science Center at Houston |