
|
|||||
|
 | |
| |
| |
| |
| |
| |
|
Gene: GADD45A |
Gene summary for GADD45A |
| Gene information | Species | Human | Gene symbol | GADD45A | Gene ID | 1647 |
| Gene name | growth arrest and DNA damage inducible alpha | |
| Gene Alias | DDIT1 | |
| Cytomap | 1p31.3 | |
| Gene Type | protein-coding | GO ID | GO:0000079 | UniProtAcc | P24522 |
Top |
Malignant transformation analysis |
| Identification of the aberrant gene expression in precancerous and cancerous lesions by comparing the gene expression of stem-like cells in diseased tissues with normal stem cells |
| Entrez ID | Symbol | Replicates | Species | Organ | Tissue | Adj P-value | Log2FC | Malignancy |
| 1647 | GADD45A | GSM4909282 | Human | Breast | IDC | 3.67e-10 | 4.90e-01 | -0.0288 |
| 1647 | GADD45A | GSM4909285 | Human | Breast | IDC | 1.76e-02 | -1.98e-01 | 0.21 |
| 1647 | GADD45A | GSM4909286 | Human | Breast | IDC | 1.19e-03 | -3.80e-01 | 0.1081 |
| 1647 | GADD45A | GSM4909290 | Human | Breast | IDC | 1.87e-04 | -3.93e-01 | 0.2096 |
| 1647 | GADD45A | GSM4909291 | Human | Breast | IDC | 1.00e-02 | -4.08e-01 | 0.1753 |
| 1647 | GADD45A | GSM4909293 | Human | Breast | IDC | 5.29e-09 | -4.44e-01 | 0.1581 |
| 1647 | GADD45A | GSM4909294 | Human | Breast | IDC | 1.35e-05 | -4.21e-01 | 0.2022 |
| 1647 | GADD45A | GSM4909296 | Human | Breast | IDC | 6.75e-05 | -4.10e-01 | 0.1524 |
| 1647 | GADD45A | GSM4909298 | Human | Breast | IDC | 1.17e-05 | -4.59e-01 | 0.1551 |
| 1647 | GADD45A | GSM4909301 | Human | Breast | IDC | 5.73e-08 | -4.68e-01 | 0.1577 |
| 1647 | GADD45A | GSM4909302 | Human | Breast | IDC | 4.22e-04 | -3.75e-01 | 0.1545 |
| 1647 | GADD45A | GSM4909304 | Human | Breast | IDC | 9.07e-03 | -4.02e-01 | 0.1636 |
| 1647 | GADD45A | GSM4909306 | Human | Breast | IDC | 3.65e-03 | -3.75e-01 | 0.1564 |
| 1647 | GADD45A | GSM4909307 | Human | Breast | IDC | 1.96e-02 | -4.03e-01 | 0.1569 |
| 1647 | GADD45A | GSM4909308 | Human | Breast | IDC | 3.96e-06 | -3.81e-01 | 0.158 |
| 1647 | GADD45A | GSM4909309 | Human | Breast | IDC | 1.22e-02 | -3.47e-01 | 0.0483 |
| 1647 | GADD45A | GSM4909311 | Human | Breast | IDC | 6.23e-16 | -5.32e-01 | 0.1534 |
| 1647 | GADD45A | GSM4909312 | Human | Breast | IDC | 3.72e-14 | -5.04e-01 | 0.1552 |
| 1647 | GADD45A | GSM4909317 | Human | Breast | IDC | 1.04e-03 | -3.77e-01 | 0.1355 |
| 1647 | GADD45A | GSM4909319 | Human | Breast | IDC | 1.41e-16 | -5.23e-01 | 0.1563 |
| Page: 1 2 3 4 5 6 7 8 9 10 11 12 |
| Tissue | Expression Dynamics | Abbreviation |
| Breast | 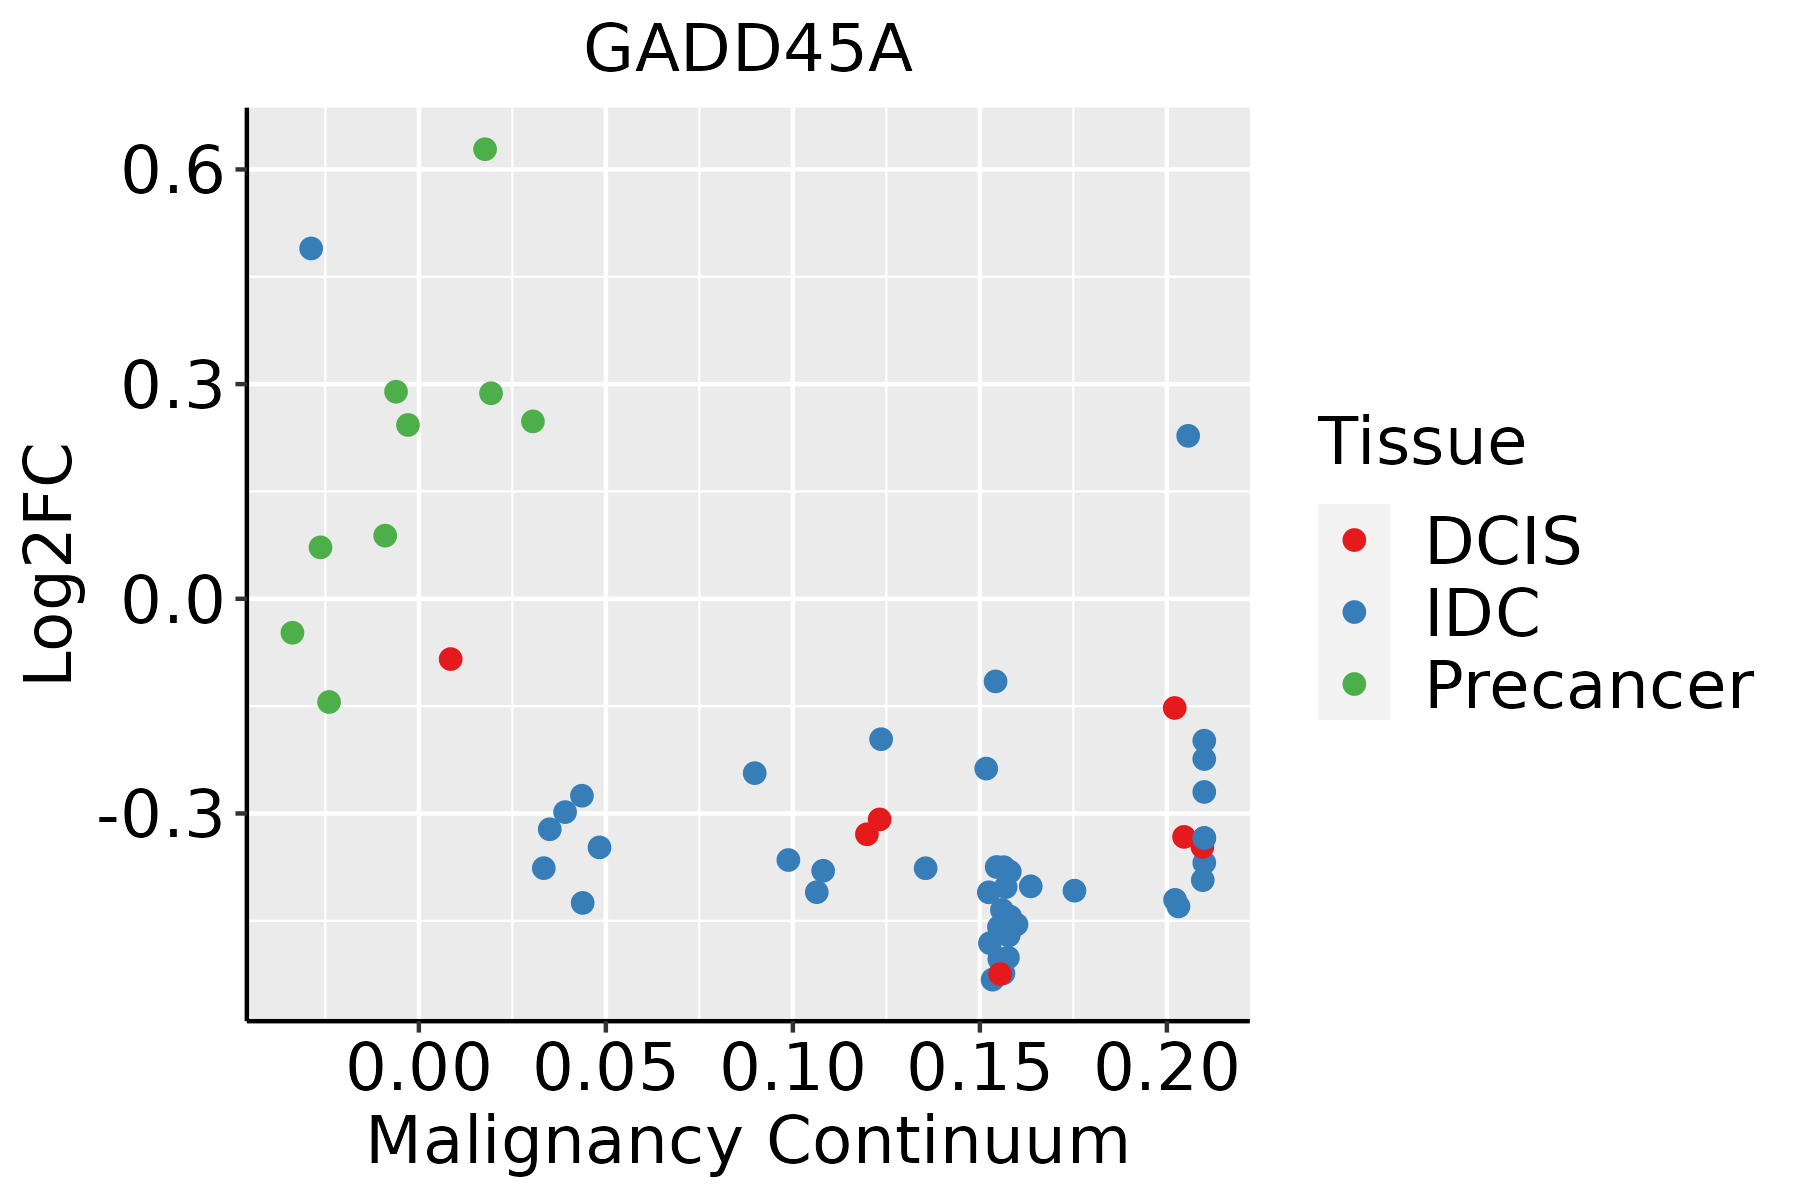 | IDC: Invasive ductal carcinoma |
| DCIS: Ductal carcinoma in situ | ||
| Precancer(BRCA1-mut): Precancerous lesion from BRCA1 mutation carriers | ||
| Cervix |  | CC: Cervix cancer |
| HSIL_HPV: HPV-infected high-grade squamous intraepithelial lesions | ||
| N_HPV: HPV-infected normal cervix | ||
| Endometrium |  | AEH: Atypical endometrial hyperplasia |
| EEC: Endometrioid Cancer | ||
| Esophagus |  | ESCC: Esophageal squamous cell carcinoma |
| HGIN: High-grade intraepithelial neoplasias | ||
| LGIN: Low-grade intraepithelial neoplasias | ||
| GC | 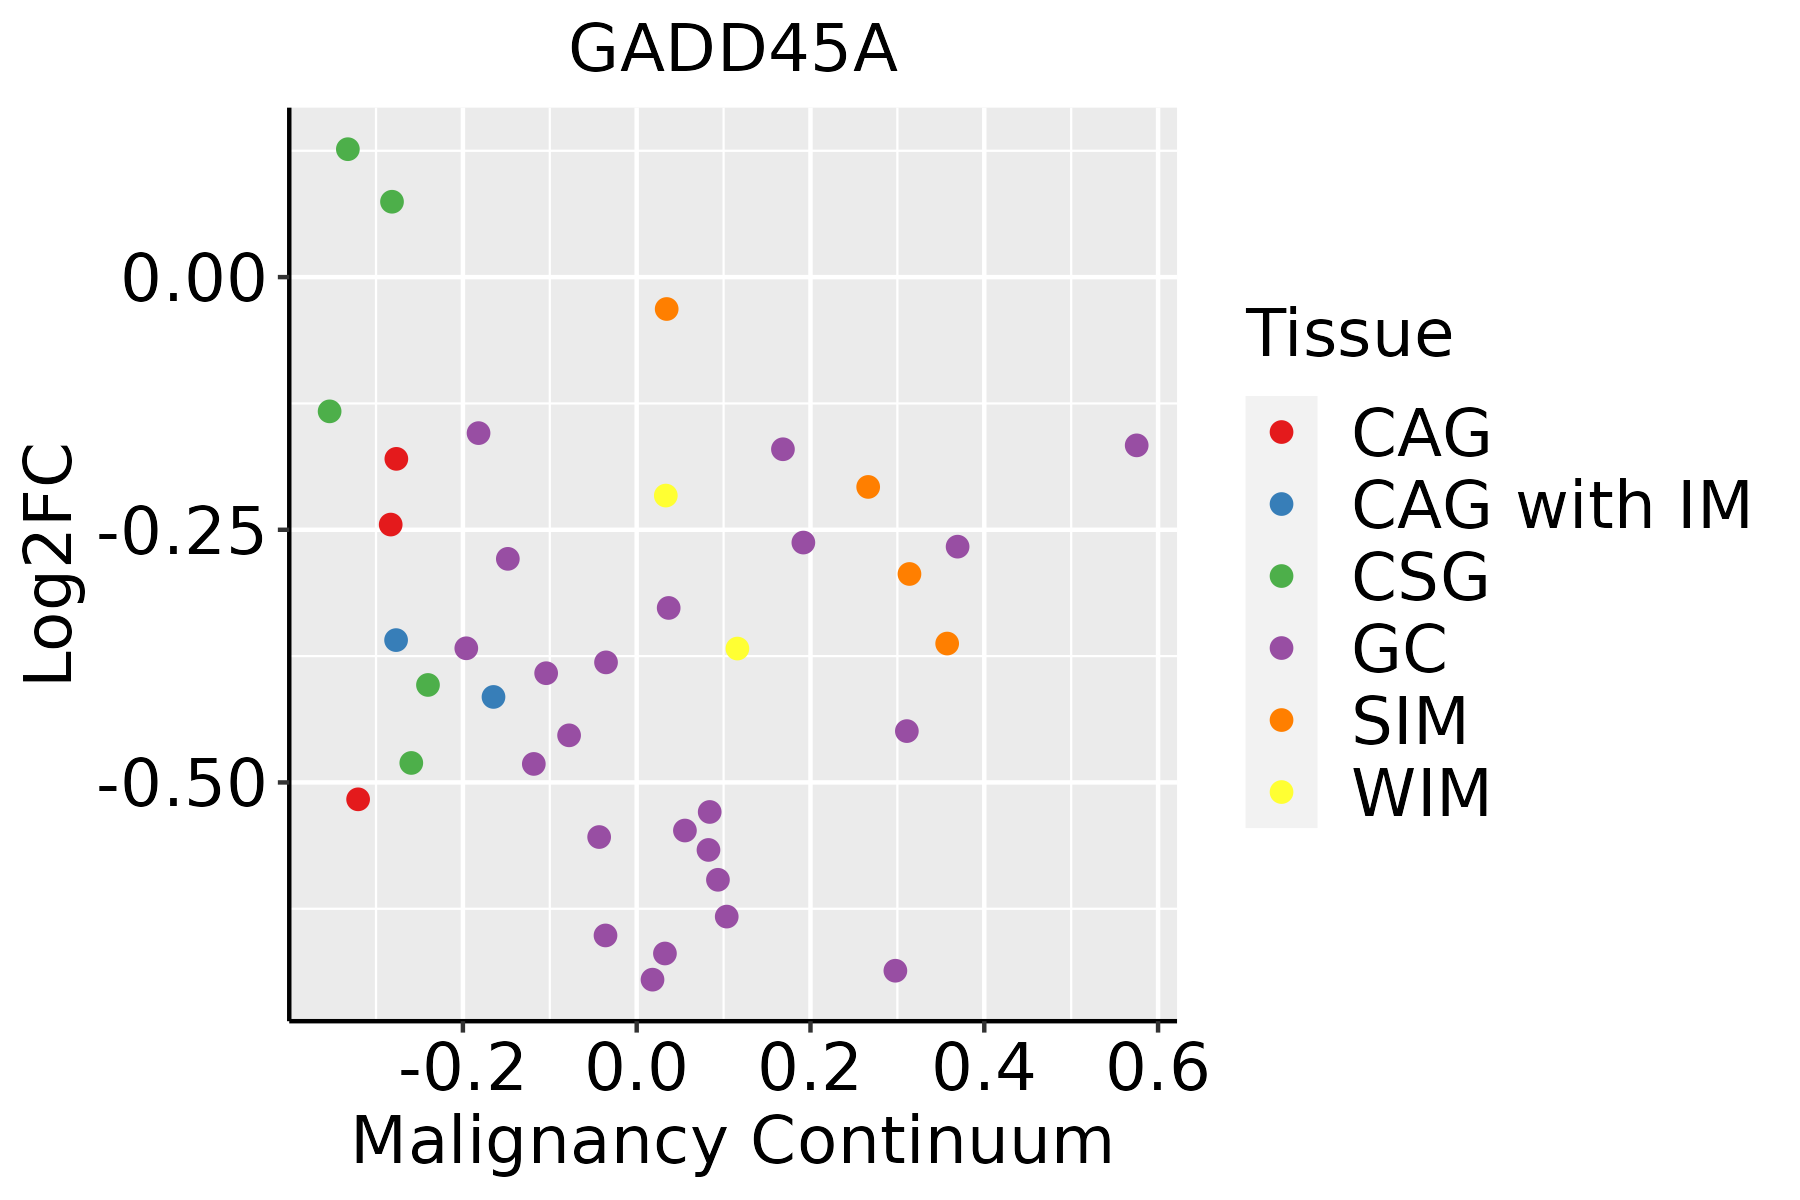 | CAG: Chronic atrophic gastritis |
| CAG with IM: Chronic atrophic gastritis with intestinal metaplasia | ||
| CSG: Chronic superficial gastritis | ||
| GC: Gastric cancer | ||
| SIM: Severe intestinal metaplasia | ||
| WIM: Wild intestinal metaplasia | ||
| Liver |  | HCC: Hepatocellular carcinoma |
| NAFLD: Non-alcoholic fatty liver disease | ||
| Lung | 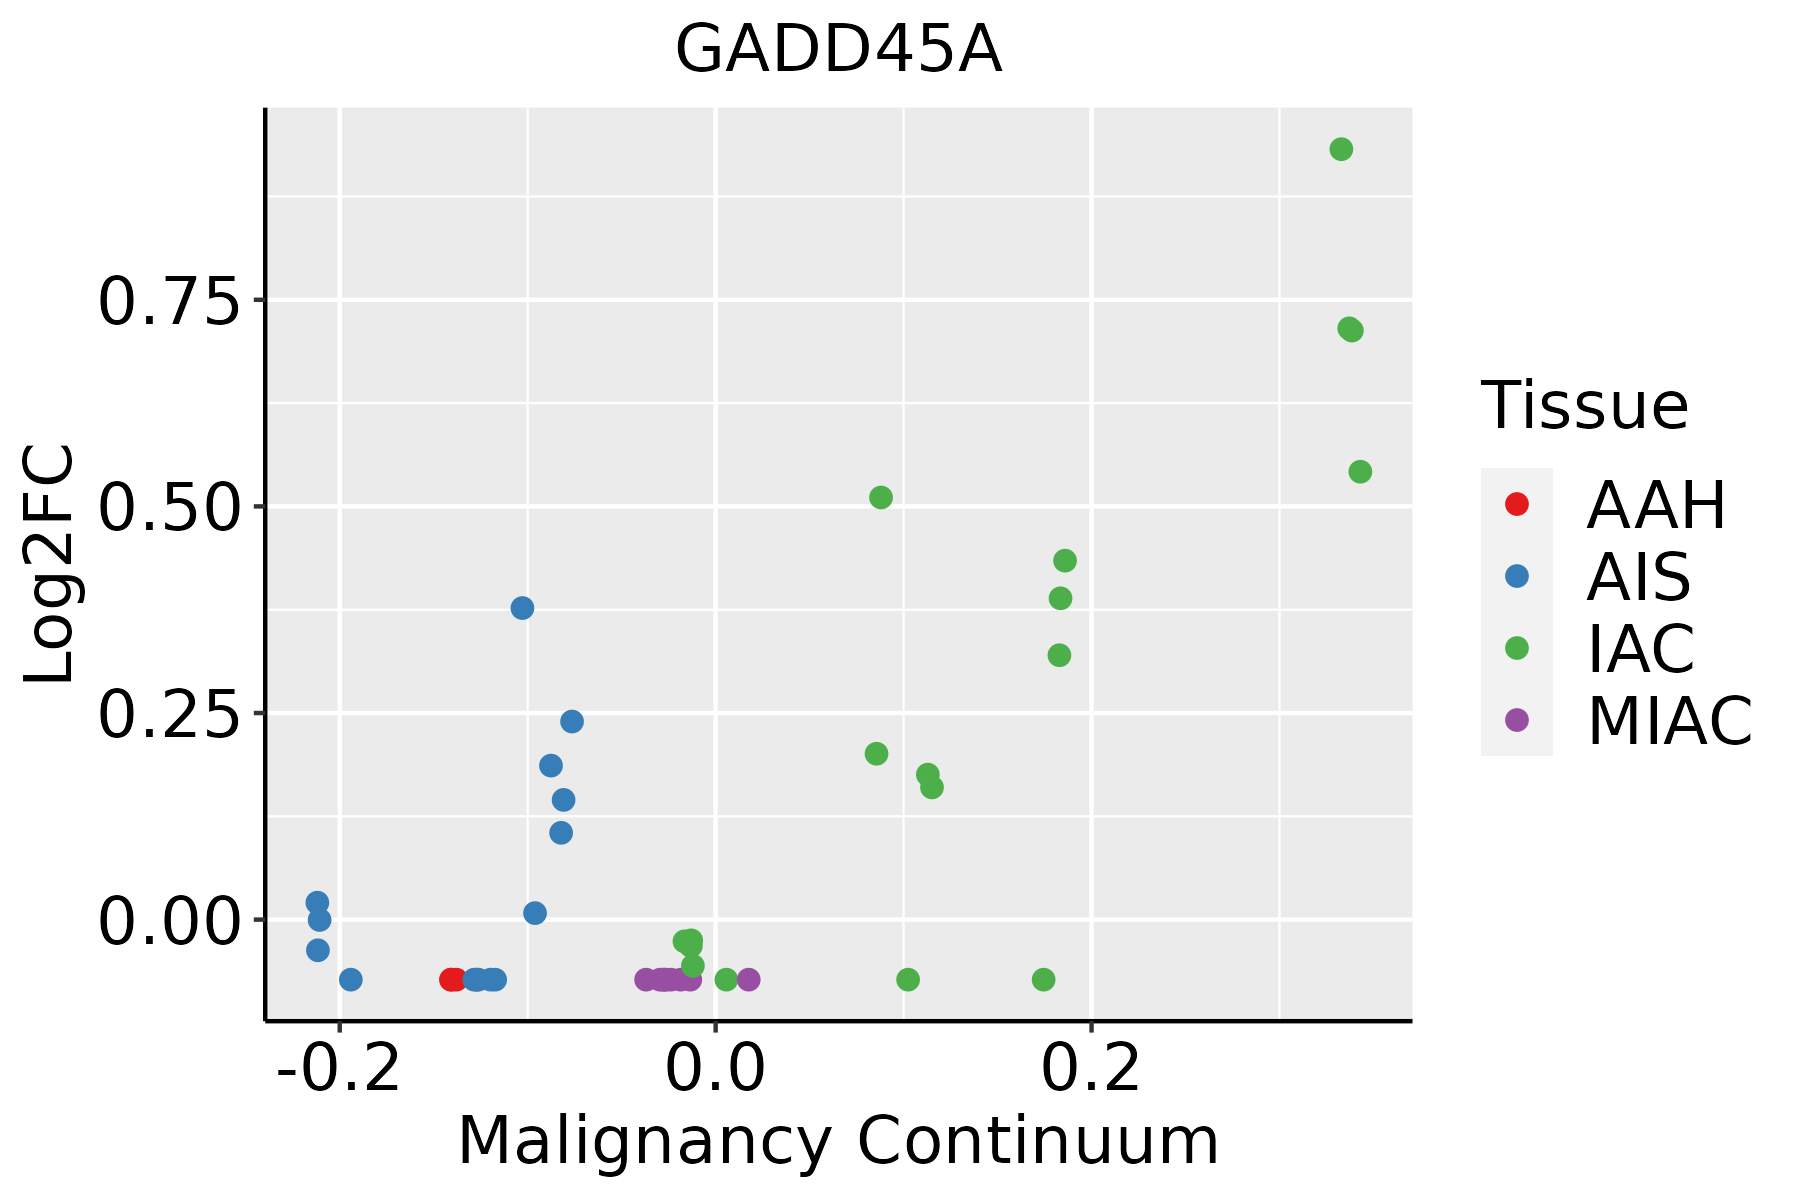 | AAH: Atypical adenomatous hyperplasia |
| AIS: Adenocarcinoma in situ | ||
| IAC: Invasive lung adenocarcinoma | ||
| MIA: Minimally invasive adenocarcinoma | ||
| Oral Cavity |  | EOLP: Erosive Oral lichen planus |
| LP: leukoplakia | ||
| NEOLP: Non-erosive oral lichen planus | ||
| OSCC: Oral squamous cell carcinoma | ||
| Prostate |  | BPH: Benign Prostatic Hyperplasia |
| Skin |  | AK: Actinic keratosis |
| cSCC: Cutaneous squamous cell carcinoma | ||
| SCCIS:squamous cell carcinoma in situ | ||
| Thyroid | 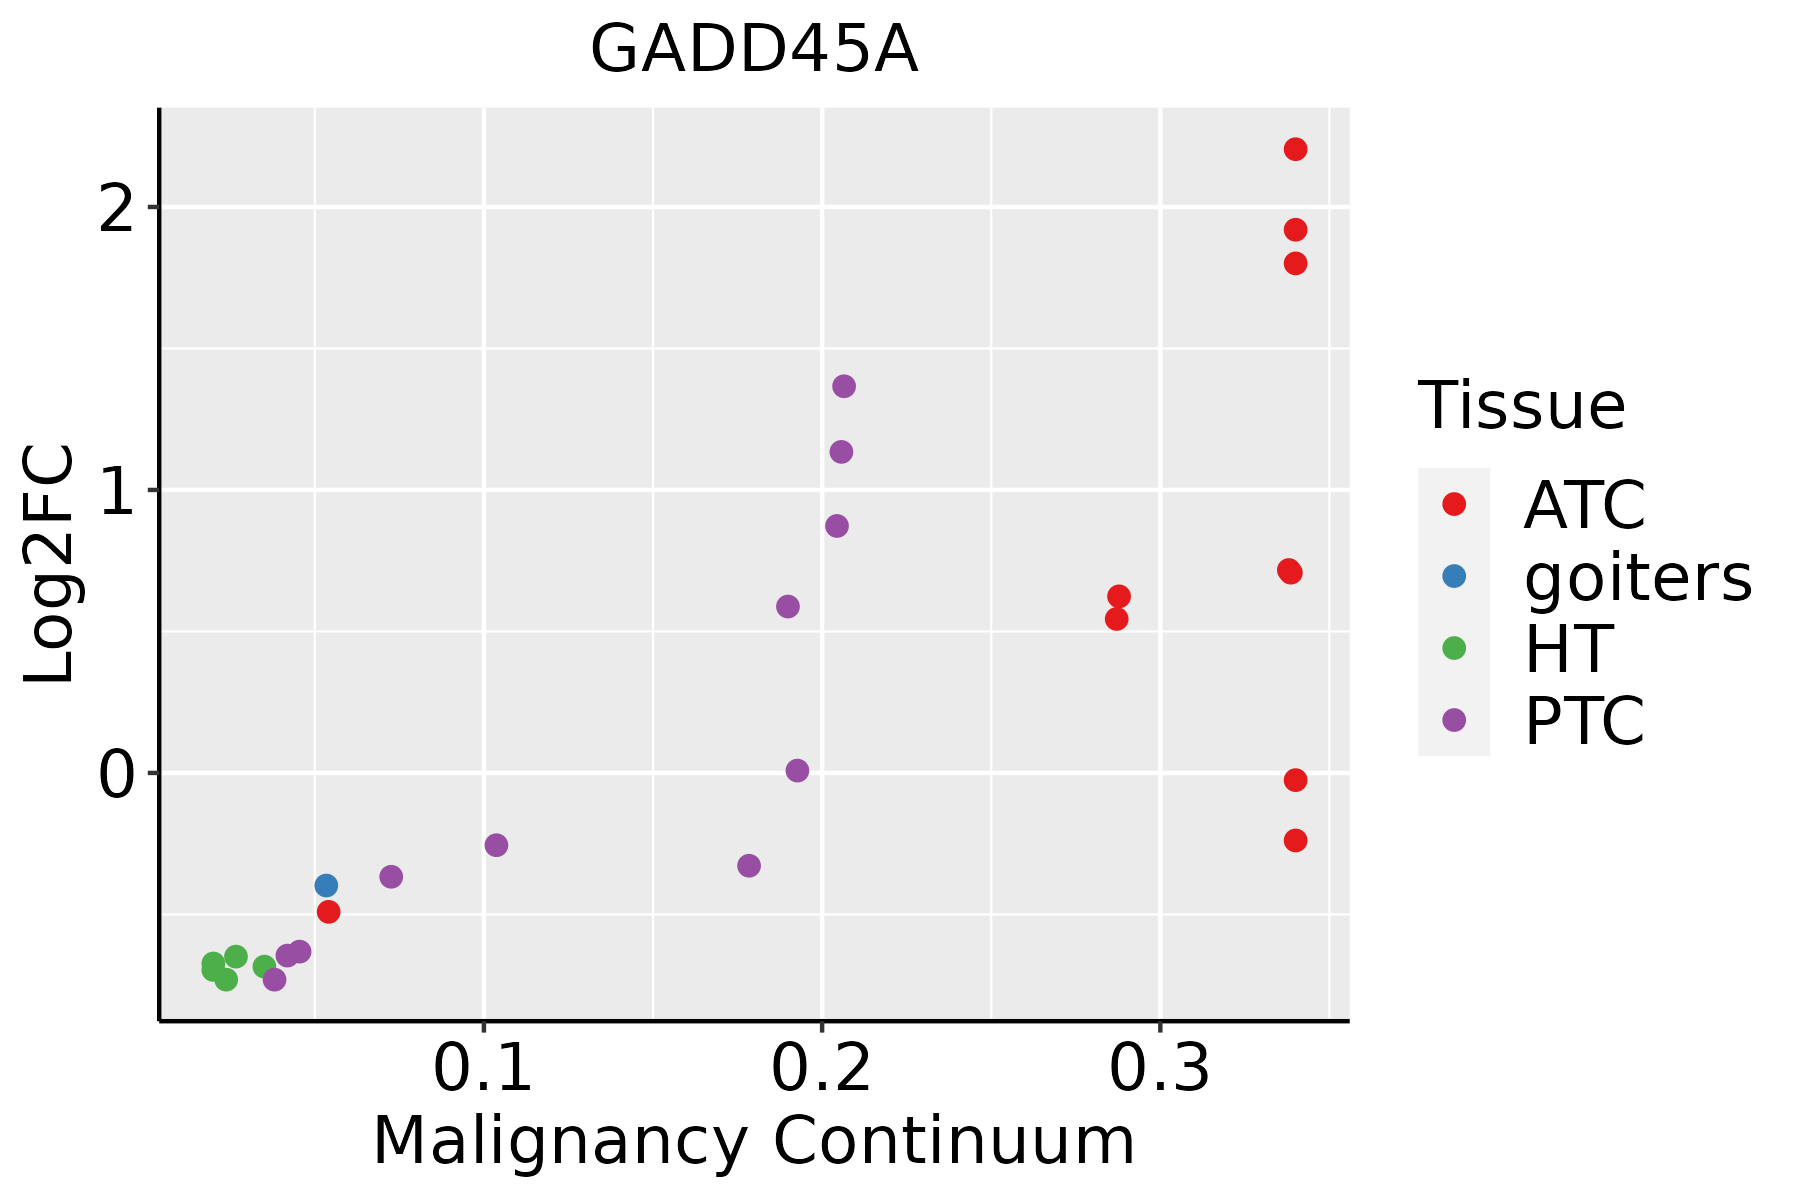 | ATC: Anaplastic thyroid cancer |
| HT: Hashimoto's thyroiditis | ||
| PTC: Papillary thyroid cancer |
| ∗log2FC in expression of this searched gene in stem-like cells from each diseased tissue sample relative to stem-like cells in normal samples in each tissue plotted against the malignancy continuum. Samples are colored based on if they are from different disease stage. |
Top |
Malignant transformation related pathway analysis |
| Find out the enriched GO biological processes and KEGG pathways involved in transition from healthy to precancer to cancer |
| Tissue | Disease Stage | Enriched GO biological Processes |
| Colorectum | AD |  |
| Colorectum | SER |  |
| Colorectum | MSS |  |
| Colorectum | MSI-H |  |
| Colorectum | FAP |  |
| ∗Top 15 enriched GO BP terms are showed in the bar plot of each disease state in each tissue. Each row represents a significant GO biological process which is colored according to the -log10(p.adjust). |
| Page: 1 2 3 4 5 6 7 8 9 |
| GO ID | Tissue | Disease Stage | Description | Gene Ratio | Bg Ratio | pvalue | p.adjust | Count |
| GO:007147913 | Breast | IDC | cellular response to ionizing radiation | 18/1434 | 72/18723 | 5.67e-06 | 1.85e-04 | 18 |
| GO:000166714 | Breast | IDC | ameboidal-type cell migration | 64/1434 | 475/18723 | 6.65e-06 | 2.05e-04 | 64 |
| GO:001021213 | Breast | IDC | response to ionizing radiation | 28/1434 | 148/18723 | 6.85e-06 | 2.09e-04 | 28 |
| GO:000931412 | Breast | IDC | response to radiation | 62/1434 | 456/18723 | 6.91e-06 | 2.10e-04 | 62 |
| GO:001063112 | Breast | IDC | epithelial cell migration | 51/1434 | 357/18723 | 1.14e-05 | 3.08e-04 | 51 |
| GO:007121413 | Breast | IDC | cellular response to abiotic stimulus | 48/1434 | 331/18723 | 1.37e-05 | 3.53e-04 | 48 |
| GO:010400413 | Breast | IDC | cellular response to environmental stimulus | 48/1434 | 331/18723 | 1.37e-05 | 3.53e-04 | 48 |
| GO:009013212 | Breast | IDC | epithelium migration | 51/1434 | 360/18723 | 1.44e-05 | 3.70e-04 | 51 |
| GO:009013012 | Breast | IDC | tissue migration | 51/1434 | 365/18723 | 2.11e-05 | 5.11e-04 | 51 |
| GO:001063212 | Breast | IDC | regulation of epithelial cell migration | 43/1434 | 292/18723 | 2.61e-05 | 6.17e-04 | 43 |
| GO:000961211 | Breast | IDC | response to mechanical stimulus | 34/1434 | 216/18723 | 4.59e-05 | 1.03e-03 | 34 |
| GO:007149614 | Breast | IDC | cellular response to external stimulus | 45/1434 | 320/18723 | 5.40e-05 | 1.15e-03 | 45 |
| GO:007259313 | Breast | IDC | reactive oxygen species metabolic process | 36/1434 | 239/18723 | 7.16e-05 | 1.43e-03 | 36 |
| GO:005134814 | Breast | IDC | negative regulation of transferase activity | 39/1434 | 268/18723 | 7.89e-05 | 1.56e-03 | 39 |
| GO:004354211 | Breast | IDC | endothelial cell migration | 40/1434 | 279/18723 | 8.97e-05 | 1.74e-03 | 40 |
| GO:00512712 | Breast | IDC | negative regulation of cellular component movement | 48/1434 | 367/18723 | 1.88e-04 | 3.12e-03 | 48 |
| GO:007147813 | Breast | IDC | cellular response to radiation | 29/1434 | 186/18723 | 1.91e-04 | 3.15e-03 | 29 |
| GO:00457651 | Breast | IDC | regulation of angiogenesis | 45/1434 | 342/18723 | 2.57e-04 | 3.98e-03 | 45 |
| GO:19013421 | Breast | IDC | regulation of vasculature development | 45/1434 | 348/18723 | 3.78e-04 | 5.38e-03 | 45 |
| GO:20001462 | Breast | IDC | negative regulation of cell motility | 46/1434 | 359/18723 | 4.01e-04 | 5.60e-03 | 46 |
| Page: 1 2 3 4 5 6 7 8 9 10 11 12 13 14 15 16 17 18 19 20 21 22 23 24 25 26 27 28 29 30 31 32 33 34 35 36 37 38 39 40 41 42 43 44 45 |
| Pathway ID | Tissue | Disease Stage | Description | Gene Ratio | Bg Ratio | pvalue | p.adjust | qvalue | Count |
| hsa0516922 | Breast | IDC | Epstein-Barr virus infection | 45/867 | 202/8465 | 3.16e-07 | 6.05e-06 | 4.52e-06 | 45 |
| hsa0421824 | Breast | IDC | Cellular senescence | 35/867 | 156/8465 | 5.49e-06 | 7.43e-05 | 5.56e-05 | 35 |
| hsa0421022 | Breast | IDC | Apoptosis | 31/867 | 136/8465 | 1.34e-05 | 1.61e-04 | 1.20e-04 | 31 |
| hsa041157 | Breast | IDC | p53 signaling pathway | 16/867 | 74/8465 | 2.86e-03 | 1.86e-02 | 1.39e-02 | 16 |
| hsa052147 | Breast | IDC | Glioma | 16/867 | 75/8465 | 3.30e-03 | 2.10e-02 | 1.57e-02 | 16 |
| hsa052109 | Breast | IDC | Colorectal cancer | 17/867 | 86/8465 | 5.70e-03 | 3.13e-02 | 2.34e-02 | 17 |
| hsa0522010 | Breast | IDC | Chronic myeloid leukemia | 15/867 | 76/8465 | 9.24e-03 | 4.37e-02 | 3.27e-02 | 15 |
| hsa052169 | Breast | IDC | Thyroid cancer | 9/867 | 37/8465 | 1.06e-02 | 4.92e-02 | 3.68e-02 | 9 |
| hsa0516932 | Breast | IDC | Epstein-Barr virus infection | 45/867 | 202/8465 | 3.16e-07 | 6.05e-06 | 4.52e-06 | 45 |
| hsa0421834 | Breast | IDC | Cellular senescence | 35/867 | 156/8465 | 5.49e-06 | 7.43e-05 | 5.56e-05 | 35 |
| hsa0421032 | Breast | IDC | Apoptosis | 31/867 | 136/8465 | 1.34e-05 | 1.61e-04 | 1.20e-04 | 31 |
| hsa0411512 | Breast | IDC | p53 signaling pathway | 16/867 | 74/8465 | 2.86e-03 | 1.86e-02 | 1.39e-02 | 16 |
| hsa0521413 | Breast | IDC | Glioma | 16/867 | 75/8465 | 3.30e-03 | 2.10e-02 | 1.57e-02 | 16 |
| hsa0521014 | Breast | IDC | Colorectal cancer | 17/867 | 86/8465 | 5.70e-03 | 3.13e-02 | 2.34e-02 | 17 |
| hsa0522013 | Breast | IDC | Chronic myeloid leukemia | 15/867 | 76/8465 | 9.24e-03 | 4.37e-02 | 3.27e-02 | 15 |
| hsa0521614 | Breast | IDC | Thyroid cancer | 9/867 | 37/8465 | 1.06e-02 | 4.92e-02 | 3.68e-02 | 9 |
| hsa0516941 | Breast | DCIS | Epstein-Barr virus infection | 46/846 | 202/8465 | 5.60e-08 | 1.13e-06 | 8.33e-07 | 46 |
| hsa0421844 | Breast | DCIS | Cellular senescence | 34/846 | 156/8465 | 8.53e-06 | 1.06e-04 | 7.80e-05 | 34 |
| hsa0421041 | Breast | DCIS | Apoptosis | 29/846 | 136/8465 | 5.92e-05 | 5.97e-04 | 4.40e-04 | 29 |
| hsa0411521 | Breast | DCIS | p53 signaling pathway | 16/846 | 74/8465 | 2.23e-03 | 1.47e-02 | 1.08e-02 | 16 |
| Page: 1 2 3 4 5 6 7 8 9 10 11 12 13 14 15 16 17 18 19 |
Top |
Cell-cell communication analysis |
| Identification of potential cell-cell interactions between two cell types and their ligand-receptor pairs for different disease states |
| Ligand | Receptor | LRpair | Pathway | Tissue | Disease Stage |
| Page: 1 |
Top |
Single-cell gene regulatory network inference analysis |
| Find out the significant the regulons (TFs) and the target genes of each regulon across cell types for different disease states |
| TF | Cell Type | Tissue | Disease Stage | Target Gene | RSS | Regulon Activity |
| GADD45A | TREG | Cervix | CC | EIF1B,CXCL2,MZB1, etc. | 1.52e-01 |  |
| GADD45A | TREG | Cervix | Healthy | EIF1B,CXCL2,MZB1, etc. | 1.62e-01 |  |
| GADD45A | CD4TN | Cervix | HSIL_HPV | EIF1B,CXCL2,MZB1, etc. | 1.00e-01 |  |
| GADD45A | TREG | Cervix | HSIL_HPV | EIF1B,CXCL2,MZB1, etc. | 1.77e-01 | |
| GADD45A | CD8TEXINT | Cervix | HSIL_HPV | EIF1B,CXCL2,MZB1, etc. | 8.50e-02 | |
| GADD45A | TREG | Cervix | N_HPV | EIF1B,CXCL2,MZB1, etc. | 1.34e-01 |  |
| ∗The dot plots of a searched regulon are shown for all cell subpopulations in each disease state of each tissue based on the regulon specific score inferred using pySCENIC and by calculating the average expression. |
| Page: 1 |
Top |
Somatic mutation of malignant transformation related genes |
| Annotation of somatic variants for genes involved in malignant transformation |
| Hugo Symbol | Variant Class | Variant Classification | dbSNP RS | HGVSc | HGVSp | HGVSp Short | SWISSPROT | BIOTYPE | SIFT | PolyPhen | Tumor Sample Barcode | Tissue | Histology | Sex | Age | Stage | Therapy Types | Drugs | Outcome |
| GADD45A | SNV | Missense_Mutation | rs374796115 | c.493N>T | p.Arg165Trp | p.R165W | P24522 | protein_coding | deleterious(0) | probably_damaging(0.998) | TCGA-AX-A3G8-01 | Endometrium | uterine corpus endometrioid carcinoma | Female | >=65 | I/II | Unknown | Unknown | SD |
| GADD45A | SNV | Missense_Mutation | novel | c.395C>T | p.Ser132Leu | p.S132L | P24522 | protein_coding | tolerated(0.18) | benign(0) | TCGA-B5-A11E-01 | Endometrium | uterine corpus endometrioid carcinoma | Female | <65 | I/II | Unknown | Unknown | SD |
| GADD45A | SNV | Missense_Mutation | novel | c.448N>G | p.Ser150Gly | p.S150G | P24522 | protein_coding | deleterious(0) | benign(0.328) | TCGA-D1-A2G0-01 | Endometrium | uterine corpus endometrioid carcinoma | Female | >=65 | I/II | Unknown | Unknown | SD |
| GADD45A | SNV | Missense_Mutation | novel | c.63N>A | p.Asp21Glu | p.D21E | P24522 | protein_coding | tolerated(0.52) | benign(0) | TCGA-DI-A1BU-01 | Endometrium | uterine corpus endometrioid carcinoma | Female | <65 | I/II | Chemotherapy | paclitaxel | SD |
| GADD45A | SNV | Missense_Mutation | novel | c.53N>C | p.Lys18Thr | p.K18T | P24522 | protein_coding | tolerated(0.93) | benign(0) | TCGA-E6-A1LX-01 | Endometrium | uterine corpus endometrioid carcinoma | Female | <65 | I/II | Unknown | Unknown | SD |
| GADD45A | insertion | In_Frame_Ins | novel | c.64_65insCCCTGGAGGAAGTGCTCAGCA | p.Ser28_Lys29insThrLeuGluGluValLeuSer | p.S28_K29insTLEEVLS | P24522 | protein_coding | TCGA-AJ-A3EM-01 | Endometrium | uterine corpus endometrioid carcinoma | Female | >=65 | I/II | Unknown | Unknown | SD | ||
| GADD45A | SNV | Missense_Mutation | c.473C>T | p.Pro158Leu | p.P158L | P24522 | protein_coding | deleterious(0) | probably_damaging(1) | TCGA-44-6147-01 | Lung | lung adenocarcinoma | Female | >=65 | I/II | Unknown | Unknown | SD | |
| GADD45A | SNV | Missense_Mutation | c.338G>T | p.Ser113Ile | p.S113I | P24522 | protein_coding | tolerated(0.07) | benign(0.014) | TCGA-97-8547-01 | Lung | lung adenocarcinoma | Female | >=65 | III/IV | Chemotherapy | taxol | CR | |
| GADD45A | SNV | Missense_Mutation | c.344N>T | p.Gly115Val | p.G115V | P24522 | protein_coding | deleterious(0.03) | benign(0.056) | TCGA-66-2782-01 | Lung | lung squamous cell carcinoma | Male | >=65 | I/II | Unspecific | PD | ||
| GADD45A | insertion | In_Frame_Ins | novel | c.408_409insGATCCT | p.Asp137_Pro138dup | p.D137_P138dup | P24522 | protein_coding | TCGA-63-A5MT-01 | Lung | lung squamous cell carcinoma | Male | >=65 | I/II | Chemotherapy | cisplatin | PD |
| Page: 1 2 |
Top |
Related drugs of malignant transformation related genes |
| Identification of chemicals and drugs interact with genes involved in malignant transfromation |
| (DGIdb 4.0) |
| Entrez ID | Symbol | Category | Interaction Types | Drug Claim Name | Drug Name | PMIDs |
| 1647 | GADD45A | DNA REPAIR, TUMOR SUPPRESSOR, KINASE | DOXORUBICIN | DOXORUBICIN | 7729953 | |
| 1647 | GADD45A | DNA REPAIR, TUMOR SUPPRESSOR, KINASE | WORTMANNIN | WORTMANNIN | 12066222 | |
| 1647 | GADD45A | DNA REPAIR, TUMOR SUPPRESSOR, KINASE | CISPLATIN | CISPLATIN | 9013707,10779360 | |
| 1647 | GADD45A | DNA REPAIR, TUMOR SUPPRESSOR, KINASE | CHELATORS | 10397746 | ||
| 1647 | GADD45A | DNA REPAIR, TUMOR SUPPRESSOR, KINASE | TROGLITAZONE | TROGLITAZONE | 15064713 | |
| 1647 | GADD45A | DNA REPAIR, TUMOR SUPPRESSOR, KINASE | GENISTEIN | GENISTEIN | 15527761 | |
| 1647 | GADD45A | DNA REPAIR, TUMOR SUPPRESSOR, KINASE | NB1011 | 12477050 |
| Page: 1 |

Copyright 2023-Present -The University of Texas Health Science Center at Houston |