
|
|||||
|
 | |
| |
| |
| |
| |
| |
|
Gene: GAD1 |
Gene summary for GAD1 |
| Gene information | Species | Human | Gene symbol | GAD1 | Gene ID | 2571 |
| Gene name | glutamate decarboxylase 1 | |
| Gene Alias | CPSQ1 | |
| Cytomap | 2q31.1 | |
| Gene Type | protein-coding | GO ID | GO:0001505 | UniProtAcc | A0A0S2Z3V5 |
Top |
Malignant transformation analysis |
| Identification of the aberrant gene expression in precancerous and cancerous lesions by comparing the gene expression of stem-like cells in diseased tissues with normal stem cells |
| Entrez ID | Symbol | Replicates | Species | Organ | Tissue | Adj P-value | Log2FC | Malignancy |
| 2571 | GAD1 | P2T-E | Human | Esophagus | ESCC | 4.75e-06 | 1.10e-01 | 0.1177 |
| 2571 | GAD1 | P4T-E | Human | Esophagus | ESCC | 9.91e-08 | 2.32e-01 | 0.1323 |
| 2571 | GAD1 | P8T-E | Human | Esophagus | ESCC | 3.04e-07 | 2.66e-01 | 0.0889 |
| 2571 | GAD1 | P10T-E | Human | Esophagus | ESCC | 3.05e-25 | 4.04e-01 | 0.116 |
| 2571 | GAD1 | P11T-E | Human | Esophagus | ESCC | 2.46e-02 | 2.13e-01 | 0.1426 |
| 2571 | GAD1 | P16T-E | Human | Esophagus | ESCC | 1.63e-02 | 5.33e-02 | 0.1153 |
| 2571 | GAD1 | P21T-E | Human | Esophagus | ESCC | 2.24e-11 | 1.81e-01 | 0.1617 |
| 2571 | GAD1 | P22T-E | Human | Esophagus | ESCC | 1.75e-04 | 4.94e-02 | 0.1236 |
| 2571 | GAD1 | P23T-E | Human | Esophagus | ESCC | 6.53e-09 | 2.47e-01 | 0.108 |
| 2571 | GAD1 | P26T-E | Human | Esophagus | ESCC | 3.01e-13 | 4.09e-01 | 0.1276 |
| 2571 | GAD1 | P27T-E | Human | Esophagus | ESCC | 7.32e-03 | 6.73e-02 | 0.1055 |
| 2571 | GAD1 | P49T-E | Human | Esophagus | ESCC | 1.17e-11 | 9.31e-01 | 0.1768 |
| 2571 | GAD1 | P57T-E | Human | Esophagus | ESCC | 5.02e-04 | 2.51e-01 | 0.0926 |
| 2571 | GAD1 | P61T-E | Human | Esophagus | ESCC | 2.55e-05 | 1.47e-01 | 0.099 |
| 2571 | GAD1 | P62T-E | Human | Esophagus | ESCC | 1.20e-04 | 1.15e-01 | 0.1302 |
| 2571 | GAD1 | P65T-E | Human | Esophagus | ESCC | 1.10e-13 | 2.86e-01 | 0.0978 |
| 2571 | GAD1 | P74T-E | Human | Esophagus | ESCC | 1.86e-07 | 2.29e-01 | 0.1479 |
| 2571 | GAD1 | P75T-E | Human | Esophagus | ESCC | 5.80e-06 | 1.33e-01 | 0.1125 |
| 2571 | GAD1 | P76T-E | Human | Esophagus | ESCC | 5.90e-05 | 1.35e-01 | 0.1207 |
| 2571 | GAD1 | P89T-E | Human | Esophagus | ESCC | 4.36e-04 | 2.88e-01 | 0.1752 |
| Page: 1 2 |
| Tissue | Expression Dynamics | Abbreviation |
| Esophagus | 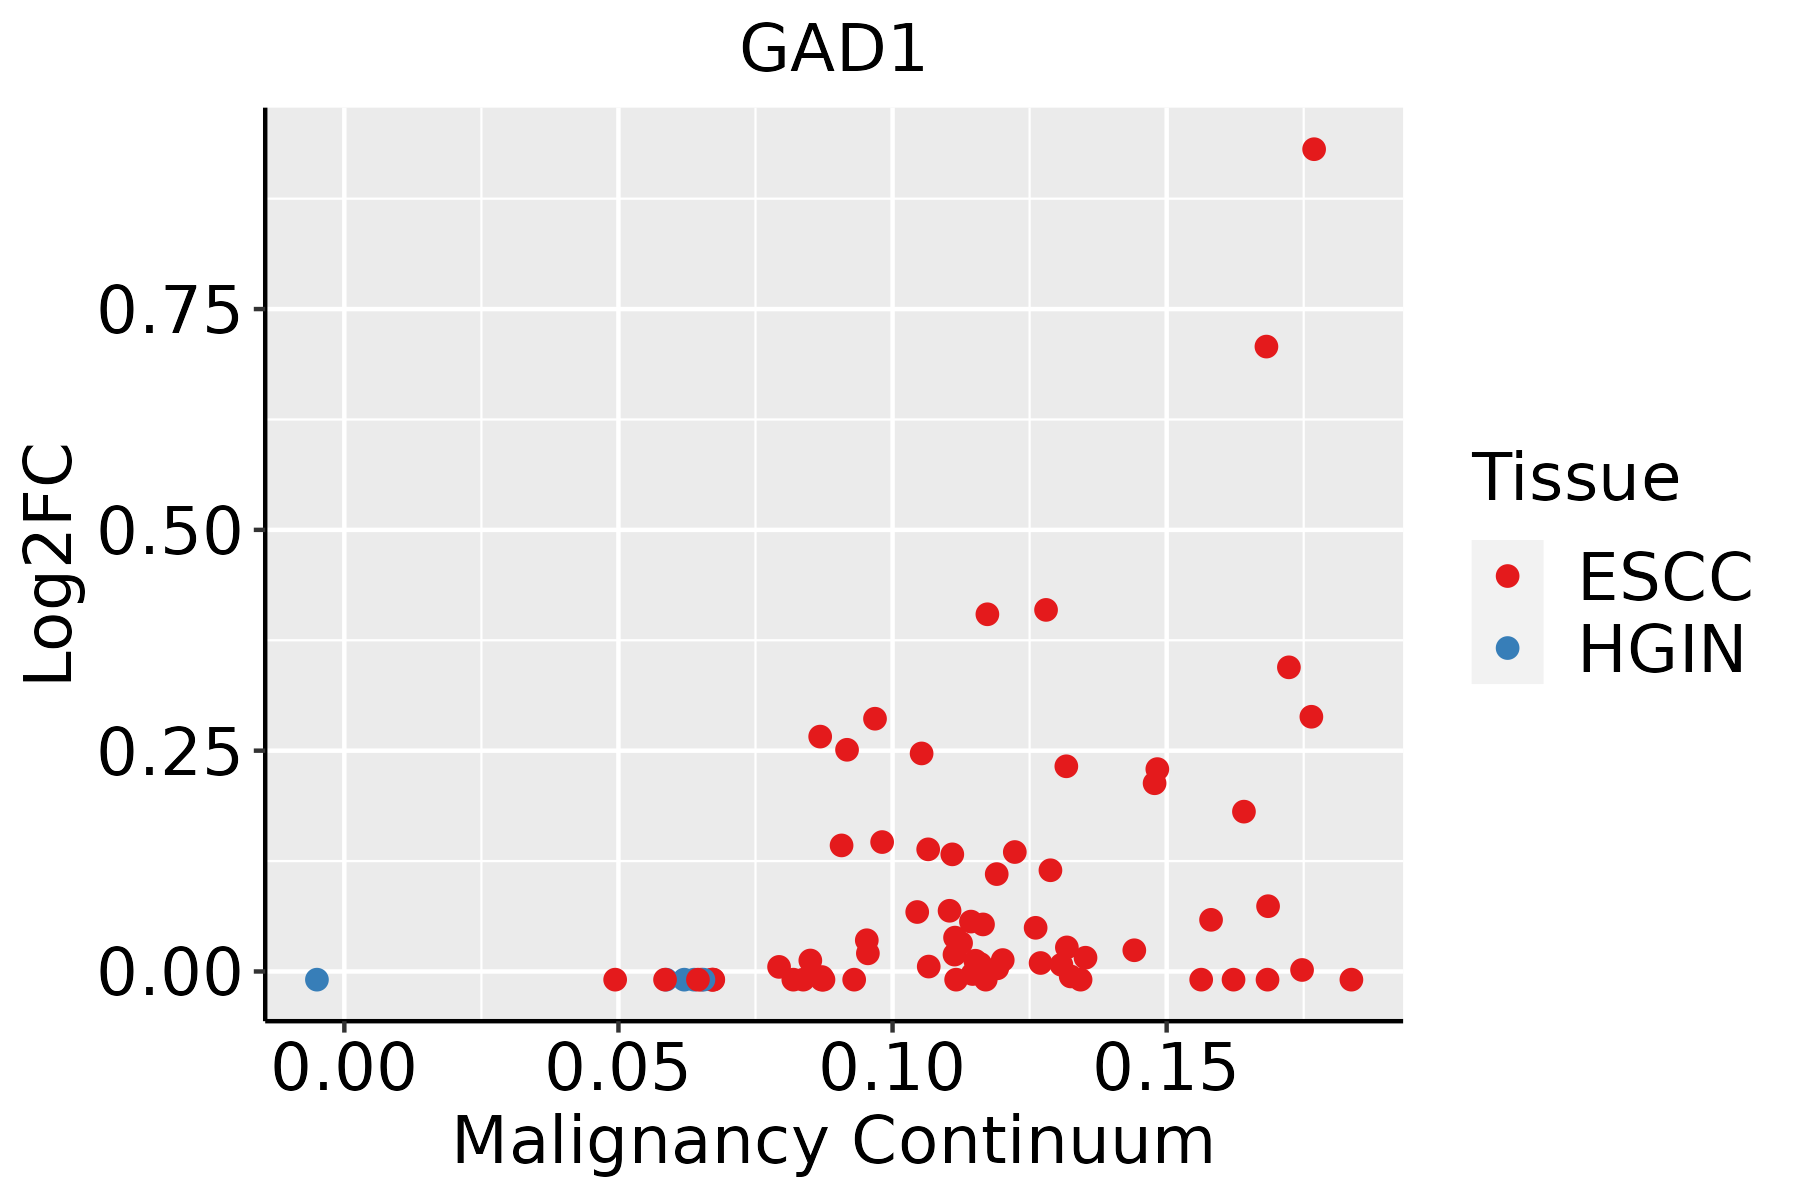 | ESCC: Esophageal squamous cell carcinoma |
| HGIN: High-grade intraepithelial neoplasias | ||
| LGIN: Low-grade intraepithelial neoplasias |
| ∗log2FC in expression of this searched gene in stem-like cells from each diseased tissue sample relative to stem-like cells in normal samples in each tissue plotted against the malignancy continuum. Samples are colored based on if they are from different disease stage. |
Top |
Malignant transformation related pathway analysis |
| Find out the enriched GO biological processes and KEGG pathways involved in transition from healthy to precancer to cancer |
| Tissue | Disease Stage | Enriched GO biological Processes |
| Colorectum | AD |  |
| Colorectum | SER |  |
| Colorectum | MSS |  |
| Colorectum | MSI-H |  |
| Colorectum | FAP |  |
| ∗Top 15 enriched GO BP terms are showed in the bar plot of each disease state in each tissue. Each row represents a significant GO biological process which is colored according to the -log10(p.adjust). |
| Page: 1 2 3 4 5 6 7 8 9 |
| GO ID | Tissue | Disease Stage | Description | Gene Ratio | Bg Ratio | pvalue | p.adjust | Count |
| GO:000941020 | Esophagus | ESCC | response to xenobiotic stimulus | 253/8552 | 462/18723 | 4.55e-05 | 3.58e-04 | 253 |
| GO:00086525 | Esophagus | ESCC | cellular amino acid biosynthetic process | 51/8552 | 76/18723 | 1.30e-04 | 8.88e-04 | 51 |
| GO:00463948 | Esophagus | ESCC | carboxylic acid biosynthetic process | 175/8552 | 314/18723 | 1.98e-04 | 1.26e-03 | 175 |
| GO:00160538 | Esophagus | ESCC | organic acid biosynthetic process | 175/8552 | 316/18723 | 3.04e-04 | 1.82e-03 | 175 |
| GO:00442827 | Esophagus | ESCC | small molecule catabolic process | 201/8552 | 376/18723 | 1.35e-03 | 6.41e-03 | 201 |
| GO:00436485 | Esophagus | ESCC | dicarboxylic acid metabolic process | 58/8552 | 96/18723 | 2.55e-03 | 1.09e-02 | 58 |
| Page: 1 |
| Pathway ID | Tissue | Disease Stage | Description | Gene Ratio | Bg Ratio | pvalue | p.adjust | qvalue | Count |
| Page: 1 |
Top |
Cell-cell communication analysis |
| Identification of potential cell-cell interactions between two cell types and their ligand-receptor pairs for different disease states |
| Ligand | Receptor | LRpair | Pathway | Tissue | Disease Stage |
| Page: 1 |
Top |
Single-cell gene regulatory network inference analysis |
| Find out the significant the regulons (TFs) and the target genes of each regulon across cell types for different disease states |
| TF | Cell Type | Tissue | Disease Stage | Target Gene | RSS | Regulon Activity |
| ∗The dot plots of a searched regulon are shown for all cell subpopulations in each disease state of each tissue based on the regulon specific score inferred using pySCENIC and by calculating the average expression. |
| Page: 1 |
Top |
Somatic mutation of malignant transformation related genes |
| Annotation of somatic variants for genes involved in malignant transformation |
| Hugo Symbol | Variant Class | Variant Classification | dbSNP RS | HGVSc | HGVSp | HGVSp Short | SWISSPROT | BIOTYPE | SIFT | PolyPhen | Tumor Sample Barcode | Tissue | Histology | Sex | Age | Stage | Therapy Types | Drugs | Outcome |
| GAD1 | SNV | Missense_Mutation | novel | c.1357A>C | p.Ile453Leu | p.I453L | Q99259 | protein_coding | tolerated(0.27) | benign(0.18) | TCGA-A8-A06Q-01 | Breast | breast invasive carcinoma | Female | <65 | III/IV | Unknown | Unknown | SD |
| GAD1 | SNV | Missense_Mutation | c.157N>G | p.Arg53Gly | p.R53G | Q99259 | protein_coding | tolerated_low_confidence(0.24) | benign(0) | TCGA-AN-A0FY-01 | Breast | breast invasive carcinoma | Female | <65 | I/II | Unknown | Unknown | SD | |
| GAD1 | SNV | Missense_Mutation | c.1210C>T | p.His404Tyr | p.H404Y | Q99259 | protein_coding | deleterious(0) | probably_damaging(0.998) | TCGA-AR-A0TX-01 | Breast | breast invasive carcinoma | Female | <65 | I/II | Unknown | Unknown | SD | |
| GAD1 | SNV | Missense_Mutation | novel | c.943N>A | p.Glu315Lys | p.E315K | Q99259 | protein_coding | tolerated(0.1) | benign(0.063) | TCGA-PE-A5DE-01 | Breast | breast invasive carcinoma | Female | <65 | I/II | Chemotherapy | taxotere | CR |
| GAD1 | SNV | Missense_Mutation | novel | c.496N>C | p.Glu166Gln | p.E166Q | Q99259 | protein_coding | tolerated(0.24) | probably_damaging(0.942) | TCGA-XX-A89A-01 | Breast | breast invasive carcinoma | Female | >=65 | I/II | Unknown | Unknown | SD |
| GAD1 | insertion | Frame_Shift_Ins | novel | c.1360_1361insCCAATCTTGAAAC | p.Gln454ProfsTer28 | p.Q454Pfs*28 | Q99259 | protein_coding | TCGA-A8-A06Q-01 | Breast | breast invasive carcinoma | Female | <65 | III/IV | Unknown | Unknown | SD | ||
| GAD1 | insertion | Nonsense_Mutation | novel | c.1496_1497insGCTTCAGCTTCTCAAGTAGCTGGGACTATAGGC | p.Glu499_Phe500insLeuGlnLeuLeuLysTerLeuGlyLeuTerAla | p.E499_F500insLQLLK*LGL*A | Q99259 | protein_coding | TCGA-AN-A049-01 | Breast | breast invasive carcinoma | Female | <65 | I/II | Unknown | Unknown | SD | ||
| GAD1 | deletion | Frame_Shift_Del | novel | c.742delN | p.Ser249LeufsTer46 | p.S249Lfs*46 | Q99259 | protein_coding | TCGA-EW-A2FV-01 | Breast | breast invasive carcinoma | Female | <65 | III/IV | Chemotherapy | docetaxel | SD | ||
| GAD1 | SNV | Missense_Mutation | c.133C>G | p.Leu45Val | p.L45V | Q99259 | protein_coding | tolerated_low_confidence(0.25) | benign(0.001) | TCGA-C5-A7X3-01 | Cervix | cervical & endocervical cancer | Female | >=65 | III/IV | Chemotherapy | cisplatin | SD | |
| GAD1 | SNV | Missense_Mutation | c.38C>G | p.Ser13Trp | p.S13W | Q99259 | protein_coding | deleterious_low_confidence(0.01) | benign(0.257) | TCGA-EK-A2R8-01 | Cervix | cervical & endocervical cancer | Female | <65 | I/II | Unknown | Unknown | SD |
| Page: 1 2 3 4 5 6 7 8 |
Top |
Related drugs of malignant transformation related genes |
| Identification of chemicals and drugs interact with genes involved in malignant transfromation |
| (DGIdb 4.0) |
| Entrez ID | Symbol | Category | Interaction Types | Drug Claim Name | Drug Name | PMIDs |
| 2571 | GAD1 | DRUGGABLE GENOME, ENZYME | inhibitor | 178101950 | ||
| 2571 | GAD1 | DRUGGABLE GENOME, ENZYME | methadone | METHADONE | 31866536 |
| Page: 1 |

Copyright 2023-Present -The University of Texas Health Science Center at Houston |