
|
|||||
|
 | |
| |
| |
| |
| |
| |
|
Gene: GABRE |
Gene summary for GABRE |
| Gene information | Species | Human | Gene symbol | GABRE | Gene ID | 2564 |
| Gene name | gamma-aminobutyric acid type A receptor subunit epsilon | |
| Gene Alias | GABRE | |
| Cytomap | Xq28 | |
| Gene Type | protein-coding | GO ID | GO:0003008 | UniProtAcc | P78334 |
Top |
Malignant transformation analysis |
| Identification of the aberrant gene expression in precancerous and cancerous lesions by comparing the gene expression of stem-like cells in diseased tissues with normal stem cells |
| Entrez ID | Symbol | Replicates | Species | Organ | Tissue | Adj P-value | Log2FC | Malignancy |
| 2564 | GABRE | CCII_1 | Human | Cervix | CC | 6.75e-12 | 5.72e-01 | 0.3249 |
| 2564 | GABRE | sample3 | Human | Cervix | CC | 1.71e-11 | 3.71e-01 | 0.1387 |
| 2564 | GABRE | T1 | Human | Cervix | CC | 3.98e-03 | 2.88e-01 | 0.0918 |
| 2564 | GABRE | T3 | Human | Cervix | CC | 1.04e-12 | 3.65e-01 | 0.1389 |
| 2564 | GABRE | LZE4T | Human | Esophagus | ESCC | 3.68e-13 | 3.33e-01 | 0.0811 |
| 2564 | GABRE | LZE5T | Human | Esophagus | ESCC | 4.20e-08 | 6.39e-01 | 0.0514 |
| 2564 | GABRE | LZE8T | Human | Esophagus | ESCC | 3.67e-15 | 2.51e-01 | 0.067 |
| 2564 | GABRE | LZE20T | Human | Esophagus | ESCC | 2.32e-10 | 3.53e-01 | 0.0662 |
| 2564 | GABRE | LZE22T | Human | Esophagus | ESCC | 5.23e-03 | 5.52e-01 | 0.068 |
| 2564 | GABRE | LZE24T | Human | Esophagus | ESCC | 2.38e-07 | 4.73e-01 | 0.0596 |
| 2564 | GABRE | LZE21T | Human | Esophagus | ESCC | 1.92e-16 | 7.20e-01 | 0.0655 |
| 2564 | GABRE | P1T-E | Human | Esophagus | ESCC | 1.43e-28 | 1.35e+00 | 0.0875 |
| 2564 | GABRE | P2T-E | Human | Esophagus | ESCC | 9.44e-11 | 1.80e-01 | 0.1177 |
| 2564 | GABRE | P4T-E | Human | Esophagus | ESCC | 2.07e-07 | 8.04e-02 | 0.1323 |
| 2564 | GABRE | P5T-E | Human | Esophagus | ESCC | 1.67e-05 | 8.08e-02 | 0.1327 |
| 2564 | GABRE | P8T-E | Human | Esophagus | ESCC | 2.60e-15 | 2.55e-01 | 0.0889 |
| 2564 | GABRE | P9T-E | Human | Esophagus | ESCC | 2.04e-39 | 1.25e+00 | 0.1131 |
| 2564 | GABRE | P10T-E | Human | Esophagus | ESCC | 1.85e-18 | 4.41e-01 | 0.116 |
| 2564 | GABRE | P15T-E | Human | Esophagus | ESCC | 6.71e-22 | 5.31e-01 | 0.1149 |
| 2564 | GABRE | P20T-E | Human | Esophagus | ESCC | 4.53e-16 | 4.77e-01 | 0.1124 |
| Page: 1 2 3 4 |
| Tissue | Expression Dynamics | Abbreviation |
| Cervix | 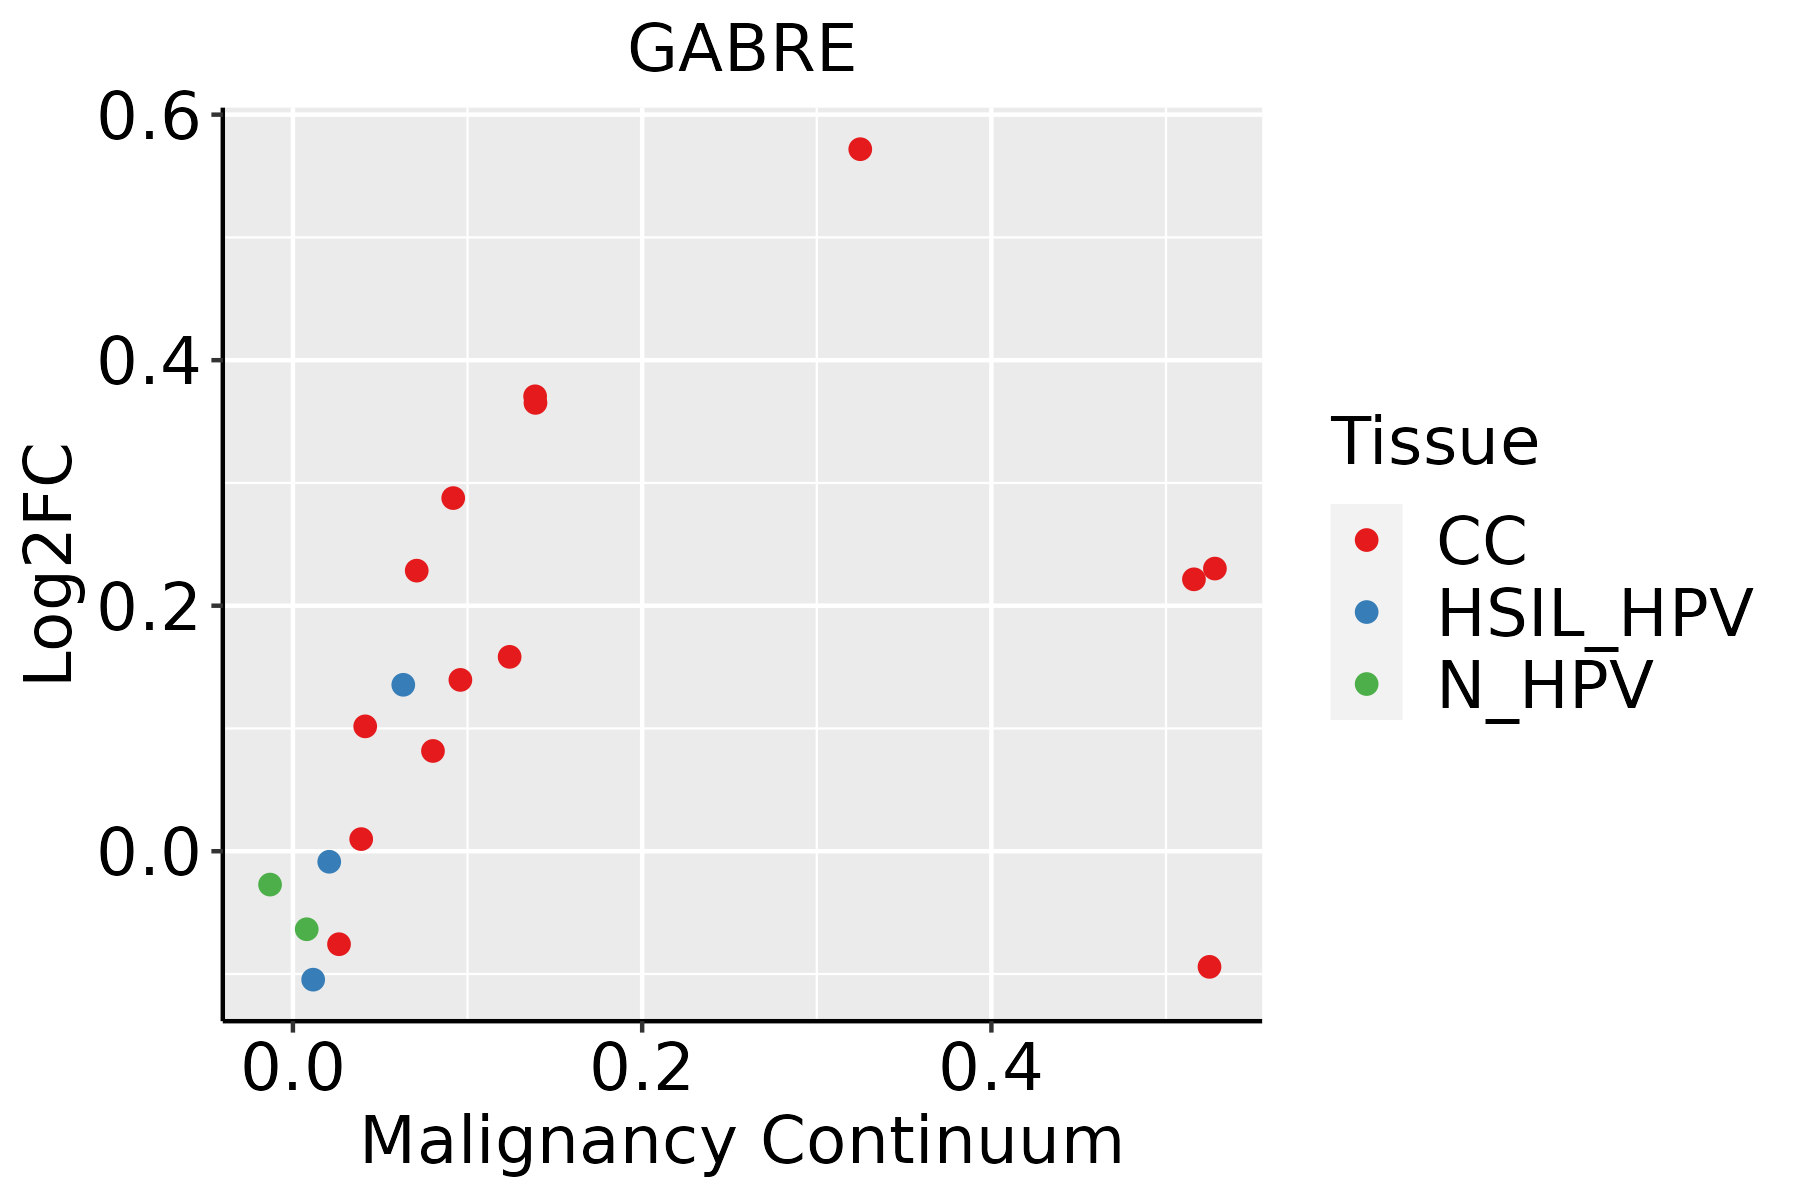 | CC: Cervix cancer |
| HSIL_HPV: HPV-infected high-grade squamous intraepithelial lesions | ||
| N_HPV: HPV-infected normal cervix | ||
| Esophagus |  | ESCC: Esophageal squamous cell carcinoma |
| HGIN: High-grade intraepithelial neoplasias | ||
| LGIN: Low-grade intraepithelial neoplasias | ||
| Liver |  | HCC: Hepatocellular carcinoma |
| NAFLD: Non-alcoholic fatty liver disease | ||
| Oral Cavity | 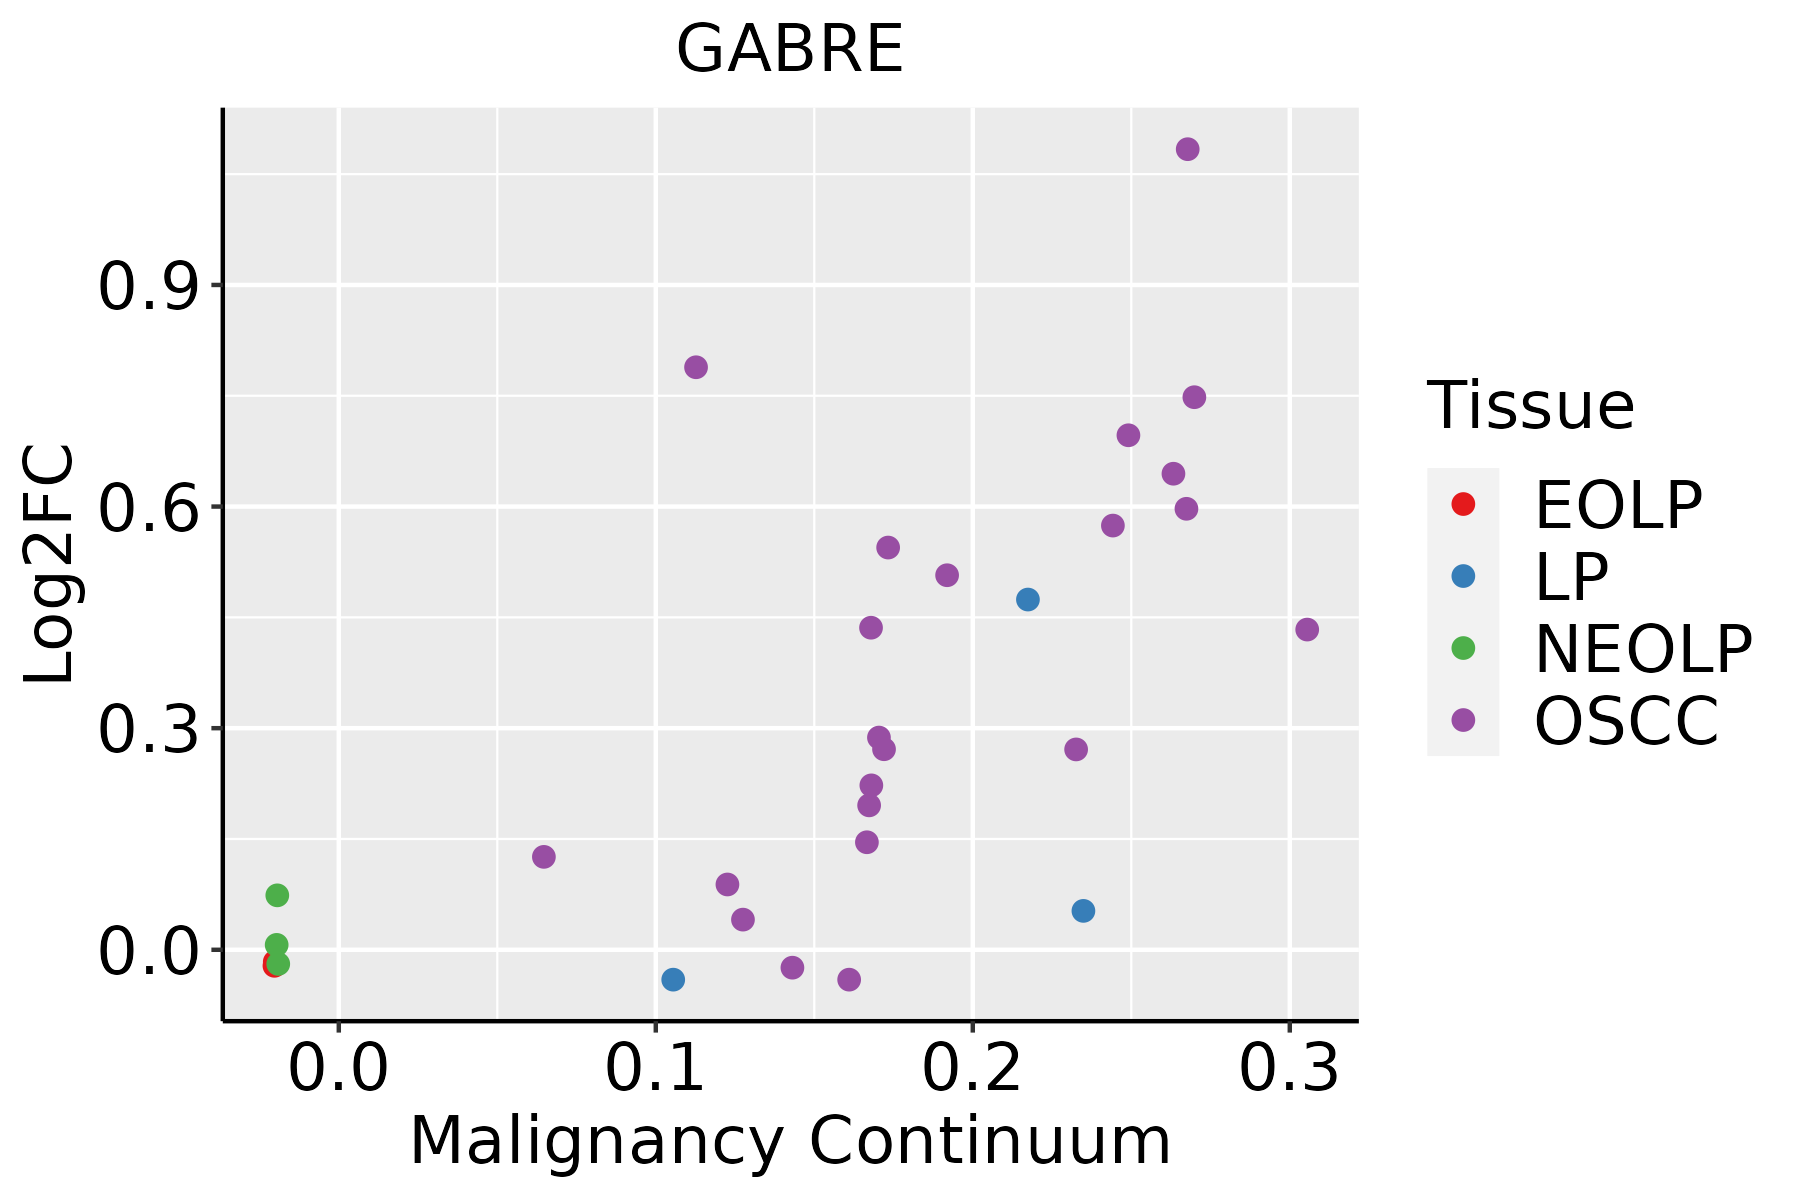 | EOLP: Erosive Oral lichen planus |
| LP: leukoplakia | ||
| NEOLP: Non-erosive oral lichen planus | ||
| OSCC: Oral squamous cell carcinoma | ||
| Skin | 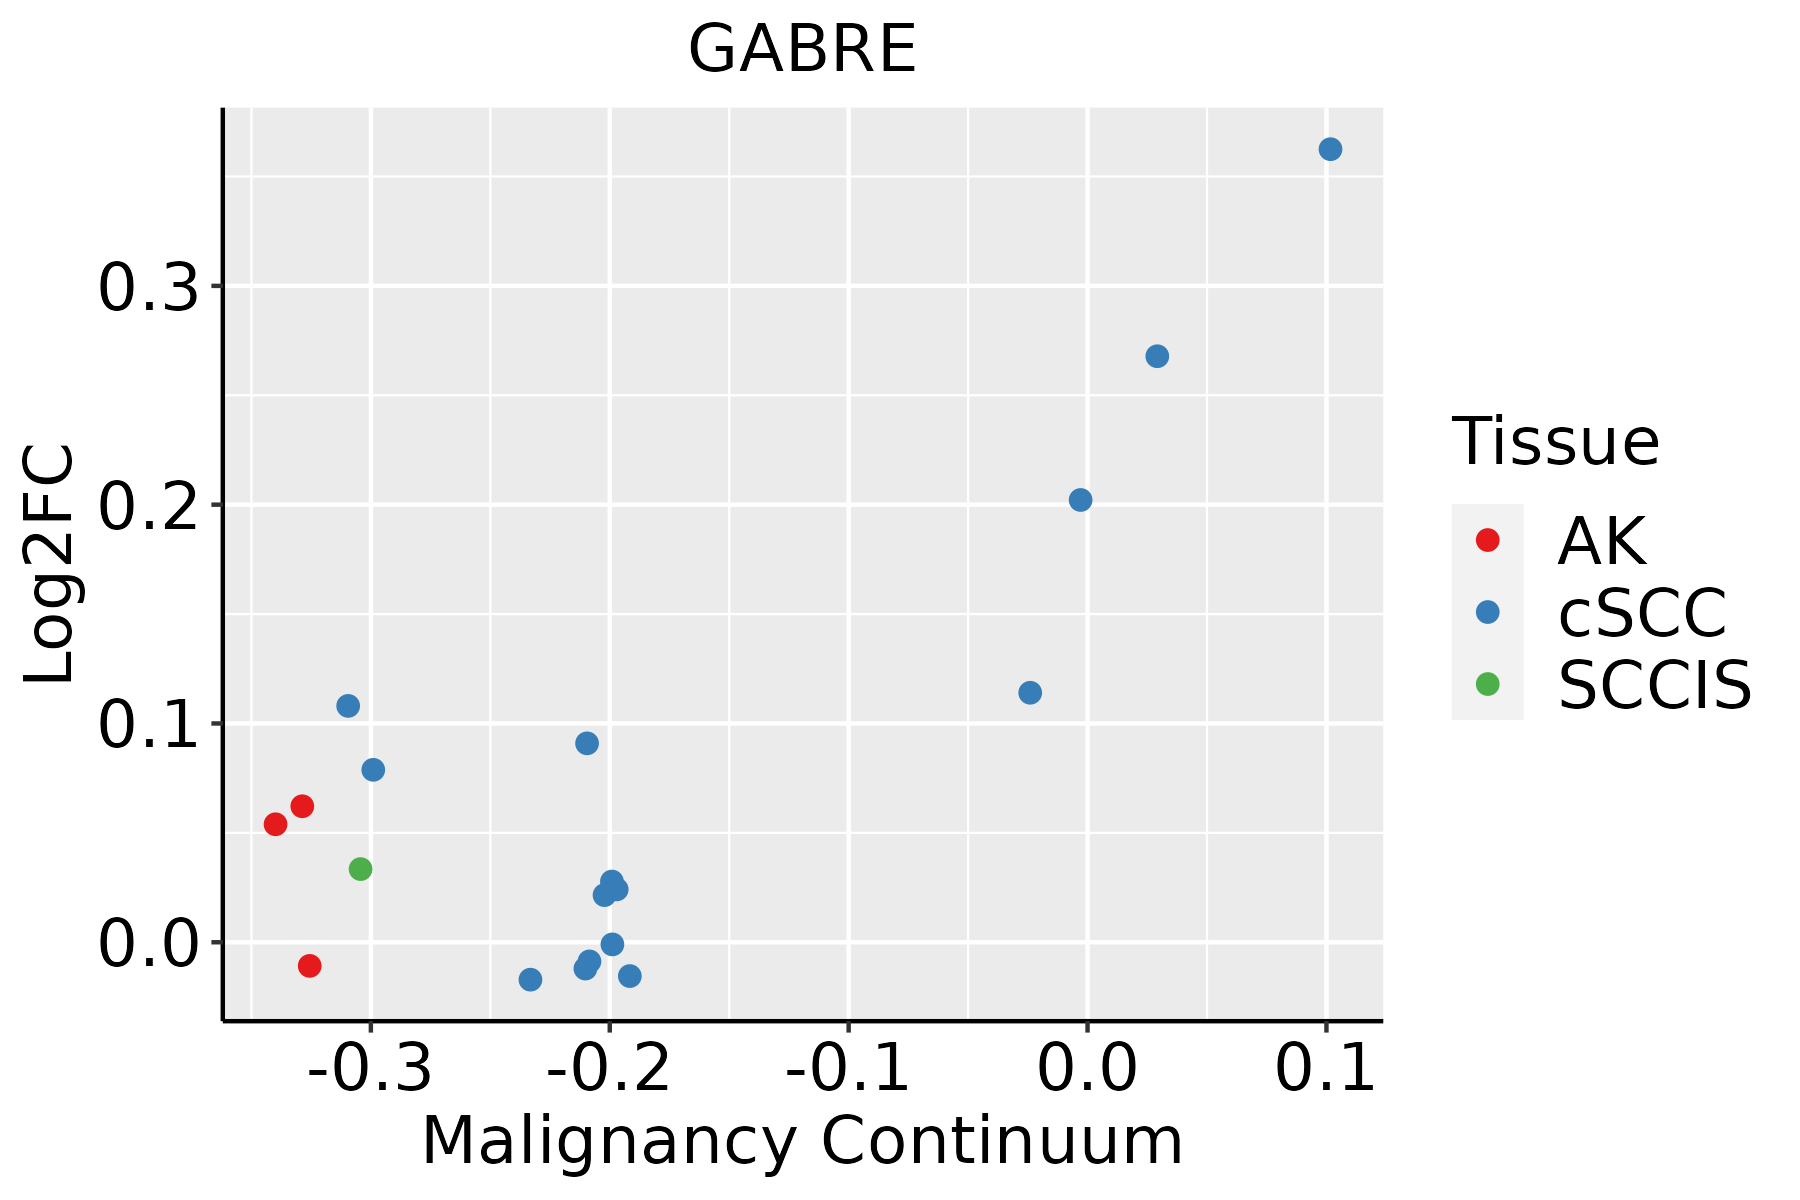 | AK: Actinic keratosis |
| cSCC: Cutaneous squamous cell carcinoma | ||
| SCCIS:squamous cell carcinoma in situ |
| ∗log2FC in expression of this searched gene in stem-like cells from each diseased tissue sample relative to stem-like cells in normal samples in each tissue plotted against the malignancy continuum. Samples are colored based on if they are from different disease stage. |
Top |
Malignant transformation related pathway analysis |
| Find out the enriched GO biological processes and KEGG pathways involved in transition from healthy to precancer to cancer |
| Tissue | Disease Stage | Enriched GO biological Processes |
| Colorectum | AD |  |
| Colorectum | SER |  |
| Colorectum | MSS |  |
| Colorectum | MSI-H |  |
| Colorectum | FAP |  |
| ∗Top 15 enriched GO BP terms are showed in the bar plot of each disease state in each tissue. Each row represents a significant GO biological process which is colored according to the -log10(p.adjust). |
| Page: 1 2 3 4 5 6 7 8 9 |
| GO ID | Tissue | Disease Stage | Description | Gene Ratio | Bg Ratio | pvalue | p.adjust | Count |
| Page: 1 |
| Pathway ID | Tissue | Disease Stage | Description | Gene Ratio | Bg Ratio | pvalue | p.adjust | qvalue | Count |
| hsa0472318 | Cervix | CC | Retrograde endocannabinoid signaling | 42/1267 | 148/8465 | 1.79e-05 | 1.42e-04 | 8.40e-05 | 42 |
| hsa0472319 | Cervix | CC | Retrograde endocannabinoid signaling | 42/1267 | 148/8465 | 1.79e-05 | 1.42e-04 | 8.40e-05 | 42 |
| Page: 1 |
Top |
Cell-cell communication analysis |
| Identification of potential cell-cell interactions between two cell types and their ligand-receptor pairs for different disease states |
| Ligand | Receptor | LRpair | Pathway | Tissue | Disease Stage |
| Page: 1 |
Top |
Single-cell gene regulatory network inference analysis |
| Find out the significant the regulons (TFs) and the target genes of each regulon across cell types for different disease states |
| TF | Cell Type | Tissue | Disease Stage | Target Gene | RSS | Regulon Activity |
| ∗The dot plots of a searched regulon are shown for all cell subpopulations in each disease state of each tissue based on the regulon specific score inferred using pySCENIC and by calculating the average expression. |
| Page: 1 |
Top |
Somatic mutation of malignant transformation related genes |
| Annotation of somatic variants for genes involved in malignant transformation |
| Hugo Symbol | Variant Class | Variant Classification | dbSNP RS | HGVSc | HGVSp | HGVSp Short | SWISSPROT | BIOTYPE | SIFT | PolyPhen | Tumor Sample Barcode | Tissue | Histology | Sex | Age | Stage | Therapy Types | Drugs | Outcome |
| GABRE | SNV | Missense_Mutation | rs372300382 | c.527G>A | p.Arg176His | p.R176H | P78334 | protein_coding | deleterious(0) | probably_damaging(0.966) | TCGA-A8-A094-01 | Breast | breast invasive carcinoma | Female | >=65 | I/II | Unknown | Unknown | SD |
| GABRE | SNV | Missense_Mutation | novel | c.590T>A | p.Leu197His | p.L197H | P78334 | protein_coding | deleterious(0) | probably_damaging(0.979) | TCGA-OL-A5RZ-01 | Breast | breast invasive carcinoma | Female | <65 | I/II | Chemotherapy | doxorubicin | CR |
| GABRE | SNV | Missense_Mutation | c.191G>A | p.Arg64Lys | p.R64K | P78334 | protein_coding | tolerated(0.89) | benign(0) | TCGA-XX-A89A-01 | Breast | breast invasive carcinoma | Female | >=65 | I/II | Unknown | Unknown | SD | |
| GABRE | insertion | Frame_Shift_Ins | novel | c.885_886insAGAGGGCCATTTGGGAAACTTACGAAGAGGACTTTAT | p.Trp296ArgfsTer46 | p.W296Rfs*46 | P78334 | protein_coding | TCGA-A2-A0CX-01 | Breast | breast invasive carcinoma | Female | <65 | I/II | Chemotherapy | adriamycin | SD | ||
| GABRE | insertion | Frame_Shift_Ins | novel | c.678_679insGTGGAGGCTAGAGTTCTAATGTCAGCTAGTTTAAGGC | p.Trp227ValfsTer19 | p.W227Vfs*19 | P78334 | protein_coding | TCGA-AN-A0FX-01 | Breast | breast invasive carcinoma | Female | <65 | I/II | Unknown | Unknown | SD | ||
| GABRE | SNV | Missense_Mutation | novel | c.1015N>T | p.Ala339Ser | p.A339S | P78334 | protein_coding | deleterious(0.03) | possibly_damaging(0.489) | TCGA-2W-A8YY-01 | Cervix | cervical & endocervical cancer | Female | <65 | I/II | Chemotherapy | cisplatin | CR |
| GABRE | SNV | Missense_Mutation | c.1367N>T | p.Tyr456Phe | p.Y456F | P78334 | protein_coding | tolerated(0.82) | probably_damaging(0.996) | TCGA-C5-A7X3-01 | Cervix | cervical & endocervical cancer | Female | >=65 | III/IV | Chemotherapy | cisplatin | SD | |
| GABRE | SNV | Missense_Mutation | c.488N>T | p.Thr163Ile | p.T163I | P78334 | protein_coding | tolerated(0.21) | benign(0.156) | TCGA-A6-2686-01 | Colorectum | colon adenocarcinoma | Female | >=65 | I/II | Unknown | Unknown | SD | |
| GABRE | SNV | Missense_Mutation | rs752130096 | c.218N>A | p.Arg73His | p.R73H | P78334 | protein_coding | tolerated(0.37) | benign(0.005) | TCGA-AA-3510-01 | Colorectum | colon adenocarcinoma | Male | >=65 | I/II | Unknown | Unknown | SD |
| GABRE | SNV | Missense_Mutation | novel | c.1229N>C | p.Val410Ala | p.V410A | P78334 | protein_coding | tolerated(0.5) | benign(0.192) | TCGA-AA-3673-01 | Colorectum | colon adenocarcinoma | Female | <65 | I/II | Unknown | Unknown | SD |
| Page: 1 2 3 4 5 6 7 8 |
Top |
Related drugs of malignant transformation related genes |
| Identification of chemicals and drugs interact with genes involved in malignant transfromation |
| (DGIdb 4.0) |
| Entrez ID | Symbol | Category | Interaction Types | Drug Claim Name | Drug Name | PMIDs |
| 2564 | GABRE | DRUGGABLE GENOME, ION CHANNEL | CHLORDIAZEPOXIDE | CHLORDIAZEPOXIDE | ||
| 2564 | GABRE | DRUGGABLE GENOME, ION CHANNEL | CHEMBL591 | ETHCHLORVYNOL | ||
| 2564 | GABRE | DRUGGABLE GENOME, ION CHANNEL | positive modulator | CHEMBL30219 | METHOHEXITAL SODIUM | |
| 2564 | GABRE | DRUGGABLE GENOME, ION CHANNEL | FLUDIAZEPAM | FLUDIAZEPAM | ||
| 2564 | GABRE | DRUGGABLE GENOME, ION CHANNEL | QUAZEPAM | QUAZEPAM | ||
| 2564 | GABRE | DRUGGABLE GENOME, ION CHANNEL | agonist | CHEMBL979 | MEPROBAMATE | |
| 2564 | GABRE | DRUGGABLE GENOME, ION CHANNEL | GABOXADOL | GABOXADOL | ||
| 2564 | GABRE | DRUGGABLE GENOME, ION CHANNEL | positive modulator | CHEMBL931 | HALOTHANE | |
| 2564 | GABRE | DRUGGABLE GENOME, ION CHANNEL | TRIAZOLAM | TRIAZOLAM | ||
| 2564 | GABRE | DRUGGABLE GENOME, ION CHANNEL | FLURAZEPAM | FLURAZEPAM |
| Page: 1 2 3 4 5 6 7 8 9 10 |

Copyright 2023-Present -The University of Texas Health Science Center at Houston |