
|
|||||
|
 | |
| |
| |
| |
| |
| |
|
Gene: GABRB2 |
Gene summary for GABRB2 |
| Gene information | Species | Human | Gene symbol | GABRB2 | Gene ID | 2561 |
| Gene name | gamma-aminobutyric acid type A receptor subunit beta2 | |
| Gene Alias | DEE92 | |
| Cytomap | 5q34 | |
| Gene Type | protein-coding | GO ID | GO:0003008 | UniProtAcc | P47870 |
Top |
Malignant transformation analysis |
| Identification of the aberrant gene expression in precancerous and cancerous lesions by comparing the gene expression of stem-like cells in diseased tissues with normal stem cells |
| Entrez ID | Symbol | Replicates | Species | Organ | Tissue | Adj P-value | Log2FC | Malignancy |
| 2561 | GABRB2 | PTCwithHT_8 | Human | Thyroid | HT | 5.67e-05 | 2.93e-01 | 0.0351 |
| 2561 | GABRB2 | male-WTA | Human | Thyroid | PTC | 5.57e-37 | 5.74e-01 | 0.1037 |
| 2561 | GABRB2 | PTC01 | Human | Thyroid | PTC | 1.13e-41 | 9.64e-01 | 0.1899 |
| 2561 | GABRB2 | PTC04 | Human | Thyroid | PTC | 2.82e-21 | 7.36e-01 | 0.1927 |
| 2561 | GABRB2 | PTC05 | Human | Thyroid | PTC | 5.09e-25 | 1.44e+00 | 0.2065 |
| 2561 | GABRB2 | PTC06 | Human | Thyroid | PTC | 5.19e-79 | 2.11e+00 | 0.2057 |
| 2561 | GABRB2 | PTC07 | Human | Thyroid | PTC | 5.13e-86 | 1.76e+00 | 0.2044 |
| Page: 1 |
| Tissue | Expression Dynamics | Abbreviation |
| Thyroid | 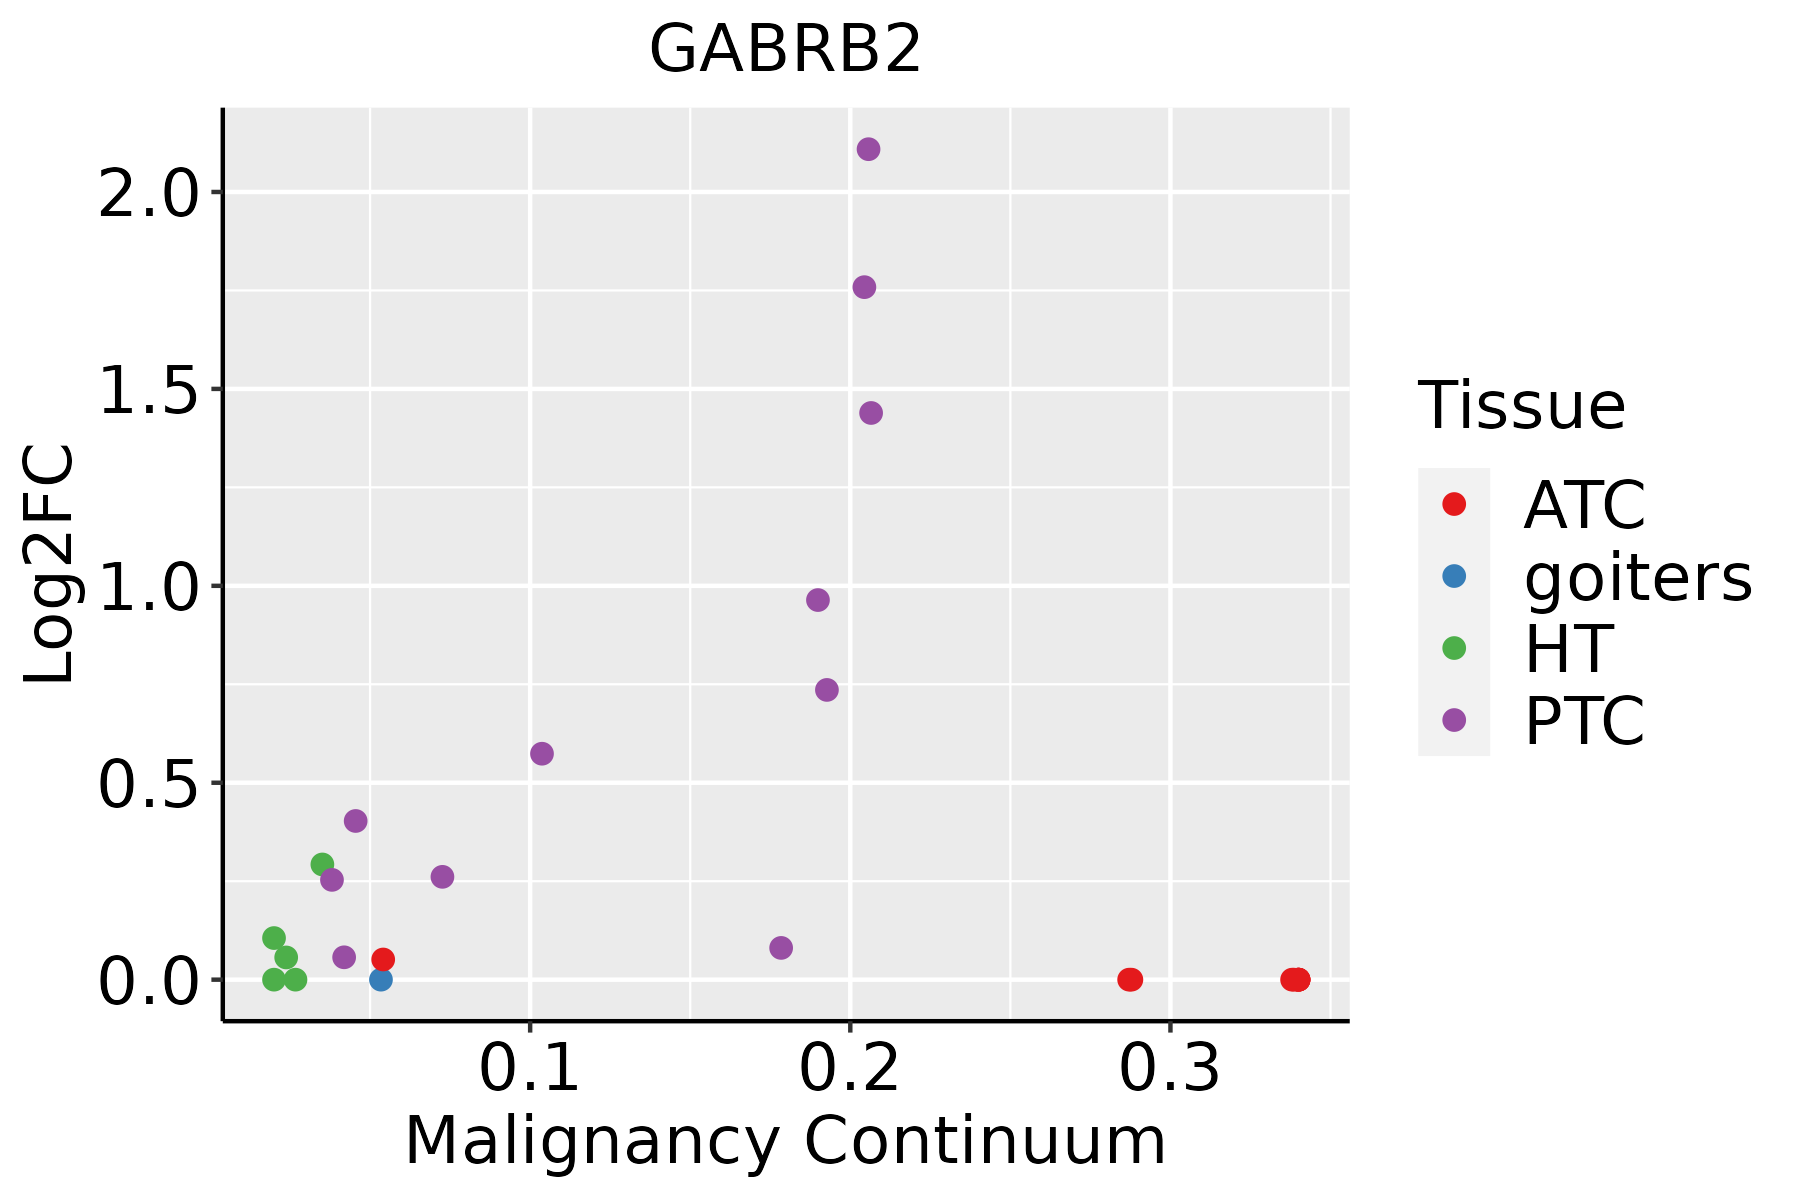 | ATC: Anaplastic thyroid cancer |
| HT: Hashimoto's thyroiditis | ||
| PTC: Papillary thyroid cancer |
| ∗log2FC in expression of this searched gene in stem-like cells from each diseased tissue sample relative to stem-like cells in normal samples in each tissue plotted against the malignancy continuum. Samples are colored based on if they are from different disease stage. |
Top |
Malignant transformation related pathway analysis |
| Find out the enriched GO biological processes and KEGG pathways involved in transition from healthy to precancer to cancer |
| Tissue | Disease Stage | Enriched GO biological Processes |
| Colorectum | AD |  |
| Colorectum | SER |  |
| Colorectum | MSS |  |
| Colorectum | MSI-H |  |
| Colorectum | FAP |  |
| ∗Top 15 enriched GO BP terms are showed in the bar plot of each disease state in each tissue. Each row represents a significant GO biological process which is colored according to the -log10(p.adjust). |
| Page: 1 2 3 4 5 6 7 8 9 |
| GO ID | Tissue | Disease Stage | Description | Gene Ratio | Bg Ratio | pvalue | p.adjust | Count |
| GO:007099730 | Thyroid | HT | neuron death | 45/1272 | 361/18723 | 5.89e-05 | 1.12e-03 | 45 |
| GO:190121427 | Thyroid | HT | regulation of neuron death | 40/1272 | 319/18723 | 1.31e-04 | 2.08e-03 | 40 |
| GO:005140226 | Thyroid | HT | neuron apoptotic process | 33/1272 | 246/18723 | 1.40e-04 | 2.17e-03 | 33 |
| GO:004352320 | Thyroid | HT | regulation of neuron apoptotic process | 29/1272 | 212/18723 | 2.47e-04 | 3.45e-03 | 29 |
| GO:003432920 | Thyroid | HT | cell junction assembly | 48/1272 | 420/18723 | 2.81e-04 | 3.84e-03 | 48 |
| GO:0070997113 | Thyroid | PTC | neuron death | 171/5968 | 361/18723 | 4.32e-10 | 1.38e-08 | 171 |
| GO:1901214113 | Thyroid | PTC | regulation of neuron death | 151/5968 | 319/18723 | 4.74e-09 | 1.24e-07 | 151 |
| GO:0051402112 | Thyroid | PTC | neuron apoptotic process | 118/5968 | 246/18723 | 8.99e-08 | 1.81e-06 | 118 |
| GO:0043523110 | Thyroid | PTC | regulation of neuron apoptotic process | 102/5968 | 212/18723 | 5.45e-07 | 8.76e-06 | 102 |
| GO:0034329111 | Thyroid | PTC | cell junction assembly | 180/5968 | 420/18723 | 1.17e-06 | 1.69e-05 | 180 |
| GO:190121518 | Thyroid | PTC | negative regulation of neuron death | 95/5968 | 208/18723 | 2.01e-05 | 2.04e-04 | 95 |
| GO:00435245 | Thyroid | PTC | negative regulation of neuron apoptotic process | 66/5968 | 145/18723 | 3.88e-04 | 2.61e-03 | 66 |
| GO:00508089 | Thyroid | PTC | synapse organization | 161/5968 | 426/18723 | 5.11e-03 | 2.36e-02 | 161 |
| Page: 1 |
| Pathway ID | Tissue | Disease Stage | Description | Gene Ratio | Bg Ratio | pvalue | p.adjust | qvalue | Count |
| Page: 1 |
Top |
Cell-cell communication analysis |
| Identification of potential cell-cell interactions between two cell types and their ligand-receptor pairs for different disease states |
| Ligand | Receptor | LRpair | Pathway | Tissue | Disease Stage |
| Page: 1 |
Top |
Single-cell gene regulatory network inference analysis |
| Find out the significant the regulons (TFs) and the target genes of each regulon across cell types for different disease states |
| TF | Cell Type | Tissue | Disease Stage | Target Gene | RSS | Regulon Activity |
| ∗The dot plots of a searched regulon are shown for all cell subpopulations in each disease state of each tissue based on the regulon specific score inferred using pySCENIC and by calculating the average expression. |
| Page: 1 |
Top |
Somatic mutation of malignant transformation related genes |
| Annotation of somatic variants for genes involved in malignant transformation |
| Hugo Symbol | Variant Class | Variant Classification | dbSNP RS | HGVSc | HGVSp | HGVSp Short | SWISSPROT | BIOTYPE | SIFT | PolyPhen | Tumor Sample Barcode | Tissue | Histology | Sex | Age | Stage | Therapy Types | Drugs | Outcome |
| GABRB2 | SNV | Missense_Mutation | c.421N>T | p.Arg141Cys | p.R141C | P47870 | protein_coding | deleterious(0) | probably_damaging(0.998) | TCGA-A8-A09Z-01 | Breast | breast invasive carcinoma | Female | >=65 | I/II | Unknown | Unknown | SD | |
| GABRB2 | SNV | Missense_Mutation | c.916N>T | p.Asp306Tyr | p.D306Y | P47870 | protein_coding | deleterious(0) | probably_damaging(1) | TCGA-AC-A23H-01 | Breast | breast invasive carcinoma | Female | >=65 | I/II | Unknown | Unknown | PD | |
| GABRB2 | SNV | Missense_Mutation | novel | c.1465N>T | p.Arg489Trp | p.R489W | P47870 | protein_coding | deleterious(0) | probably_damaging(0.998) | TCGA-AN-A046-01 | Breast | breast invasive carcinoma | Female | >=65 | I/II | Unknown | Unknown | SD |
| GABRB2 | SNV | Missense_Mutation | rs140795978 | c.1159C>T | p.Arg387Trp | p.R387W | P47870 | protein_coding | deleterious(0.02) | benign(0.005) | TCGA-BH-A0B1-01 | Breast | breast invasive carcinoma | Female | >=65 | I/II | Chemotherapy | adriamycin | SD |
| GABRB2 | SNV | Missense_Mutation | rs150956270 | c.1174N>T | p.Asp392Tyr | p.D392Y | P47870 | protein_coding | deleterious(0.04) | benign(0.001) | TCGA-E2-A153-01 | Breast | breast invasive carcinoma | Female | <65 | I/II | Chemotherapy | doxorubicin | SD |
| GABRB2 | SNV | Missense_Mutation | c.837N>G | p.Ile279Met | p.I279M | P47870 | protein_coding | deleterious(0.03) | probably_damaging(0.998) | TCGA-E9-A22E-01 | Breast | breast invasive carcinoma | Female | <65 | III/IV | Chemotherapy | cyclophosphane | SD | |
| GABRB2 | SNV | Missense_Mutation | novel | c.329N>A | p.Arg110Lys | p.R110K | P47870 | protein_coding | deleterious(0.05) | possibly_damaging(0.627) | TCGA-EW-A1PC-01 | Breast | breast invasive carcinoma | Female | >=65 | I/II | Hormone Therapy | tamoxiphen | SD |
| GABRB2 | SNV | Missense_Mutation | c.355N>C | p.Asp119His | p.D119H | P47870 | protein_coding | deleterious(0) | probably_damaging(1) | TCGA-FU-A40J-01 | Cervix | cervical & endocervical cancer | Female | <65 | III/IV | Chemotherapy | carboplatin | CR | |
| GABRB2 | SNV | Missense_Mutation | c.1513N>A | p.Val505Ile | p.V505I | P47870 | protein_coding | tolerated(0.58) | benign(0.08) | TCGA-VS-A94X-01 | Cervix | cervical & endocervical cancer | Female | <65 | I/II | Chemotherapy | cisplatin | PD | |
| GABRB2 | SNV | Missense_Mutation | c.167N>T | p.Gly56Val | p.G56V | P47870 | protein_coding | deleterious(0) | probably_damaging(0.93) | TCGA-AA-3811-01 | Colorectum | colon adenocarcinoma | Female | >=65 | III/IV | Unknown | Unknown | PD |
| Page: 1 2 3 4 5 6 7 8 9 10 |
Top |
Related drugs of malignant transformation related genes |
| Identification of chemicals and drugs interact with genes involved in malignant transfromation |
| (DGIdb 4.0) |
| Entrez ID | Symbol | Category | Interaction Types | Drug Claim Name | Drug Name | PMIDs |
| 2561 | GABRB2 | DRUGGABLE GENOME, ION CHANNEL | CLOBAZAM | CLOBAZAM | ||
| 2561 | GABRB2 | DRUGGABLE GENOME, ION CHANNEL | CLONAZEPAM | CLONAZEPAM | ||
| 2561 | GABRB2 | DRUGGABLE GENOME, ION CHANNEL | positive modulator | CHEMBL971 | PENTOBARBITAL SODIUM | |
| 2561 | GABRB2 | DRUGGABLE GENOME, ION CHANNEL | FLURAZEPAM | FLURAZEPAM | ||
| 2561 | GABRB2 | DRUGGABLE GENOME, ION CHANNEL | positive modulator | CHEMBL1200982 | BUTABARBITAL SODIUM | |
| 2561 | GABRB2 | DRUGGABLE GENOME, ION CHANNEL | OXAZEPAM | OXAZEPAM | ||
| 2561 | GABRB2 | DRUGGABLE GENOME, ION CHANNEL | positive modulator | CHEMBL1200903 | SECOBARBITAL SODIUM | |
| 2561 | GABRB2 | DRUGGABLE GENOME, ION CHANNEL | TRIAZOLAM | TRIAZOLAM | ||
| 2561 | GABRB2 | DRUGGABLE GENOME, ION CHANNEL | CINOLAZEPAM | CINOLAZEPAM | ||
| 2561 | GABRB2 | DRUGGABLE GENOME, ION CHANNEL | PROPOFOL | PROPOFOL |
| Page: 1 2 3 4 5 6 7 8 9 10 11 12 |

Copyright 2023-Present -The University of Texas Health Science Center at Houston |