
|
|||||
|
 | |
| |
| |
| |
| |
| |
|
Gene: GABPB1 |
Gene summary for GABPB1 |
| Gene information | Species | Human | Gene symbol | GABPB1 | Gene ID | 2553 |
| Gene name | GA binding protein transcription factor subunit beta 1 | |
| Gene Alias | BABPB2 | |
| Cytomap | 15q21.2 | |
| Gene Type | protein-coding | GO ID | GO:0006139 | UniProtAcc | Q06547 |
Top |
Malignant transformation analysis |
| Identification of the aberrant gene expression in precancerous and cancerous lesions by comparing the gene expression of stem-like cells in diseased tissues with normal stem cells |
| Entrez ID | Symbol | Replicates | Species | Organ | Tissue | Adj P-value | Log2FC | Malignancy |
| 2553 | GABPB1 | LZE4T | Human | Esophagus | ESCC | 3.24e-07 | 1.08e-01 | 0.0811 |
| 2553 | GABPB1 | LZE8T | Human | Esophagus | ESCC | 3.24e-02 | 7.50e-02 | 0.067 |
| 2553 | GABPB1 | LZE20T | Human | Esophagus | ESCC | 5.91e-04 | 4.83e-03 | 0.0662 |
| 2553 | GABPB1 | LZE24T | Human | Esophagus | ESCC | 1.12e-10 | 1.51e-01 | 0.0596 |
| 2553 | GABPB1 | LZE21T | Human | Esophagus | ESCC | 3.02e-03 | 1.39e-01 | 0.0655 |
| 2553 | GABPB1 | P1T-E | Human | Esophagus | ESCC | 1.09e-10 | 6.23e-01 | 0.0875 |
| 2553 | GABPB1 | P2T-E | Human | Esophagus | ESCC | 1.17e-32 | 6.08e-01 | 0.1177 |
| 2553 | GABPB1 | P4T-E | Human | Esophagus | ESCC | 2.66e-22 | 5.72e-01 | 0.1323 |
| 2553 | GABPB1 | P5T-E | Human | Esophagus | ESCC | 3.78e-21 | 4.55e-01 | 0.1327 |
| 2553 | GABPB1 | P8T-E | Human | Esophagus | ESCC | 2.25e-32 | 5.39e-01 | 0.0889 |
| 2553 | GABPB1 | P9T-E | Human | Esophagus | ESCC | 1.57e-12 | 4.28e-01 | 0.1131 |
| 2553 | GABPB1 | P10T-E | Human | Esophagus | ESCC | 3.24e-37 | 6.75e-01 | 0.116 |
| 2553 | GABPB1 | P11T-E | Human | Esophagus | ESCC | 1.43e-09 | 3.64e-01 | 0.1426 |
| 2553 | GABPB1 | P12T-E | Human | Esophagus | ESCC | 3.23e-46 | 7.00e-01 | 0.1122 |
| 2553 | GABPB1 | P15T-E | Human | Esophagus | ESCC | 5.65e-24 | 6.57e-01 | 0.1149 |
| 2553 | GABPB1 | P16T-E | Human | Esophagus | ESCC | 4.92e-38 | 6.74e-01 | 0.1153 |
| 2553 | GABPB1 | P17T-E | Human | Esophagus | ESCC | 1.92e-02 | 2.29e-01 | 0.1278 |
| 2553 | GABPB1 | P19T-E | Human | Esophagus | ESCC | 3.25e-05 | 5.83e-01 | 0.1662 |
| 2553 | GABPB1 | P20T-E | Human | Esophagus | ESCC | 3.46e-17 | 3.44e-01 | 0.1124 |
| 2553 | GABPB1 | P21T-E | Human | Esophagus | ESCC | 3.01e-19 | 3.49e-01 | 0.1617 |
| Page: 1 2 3 4 |
| Tissue | Expression Dynamics | Abbreviation |
| Esophagus | 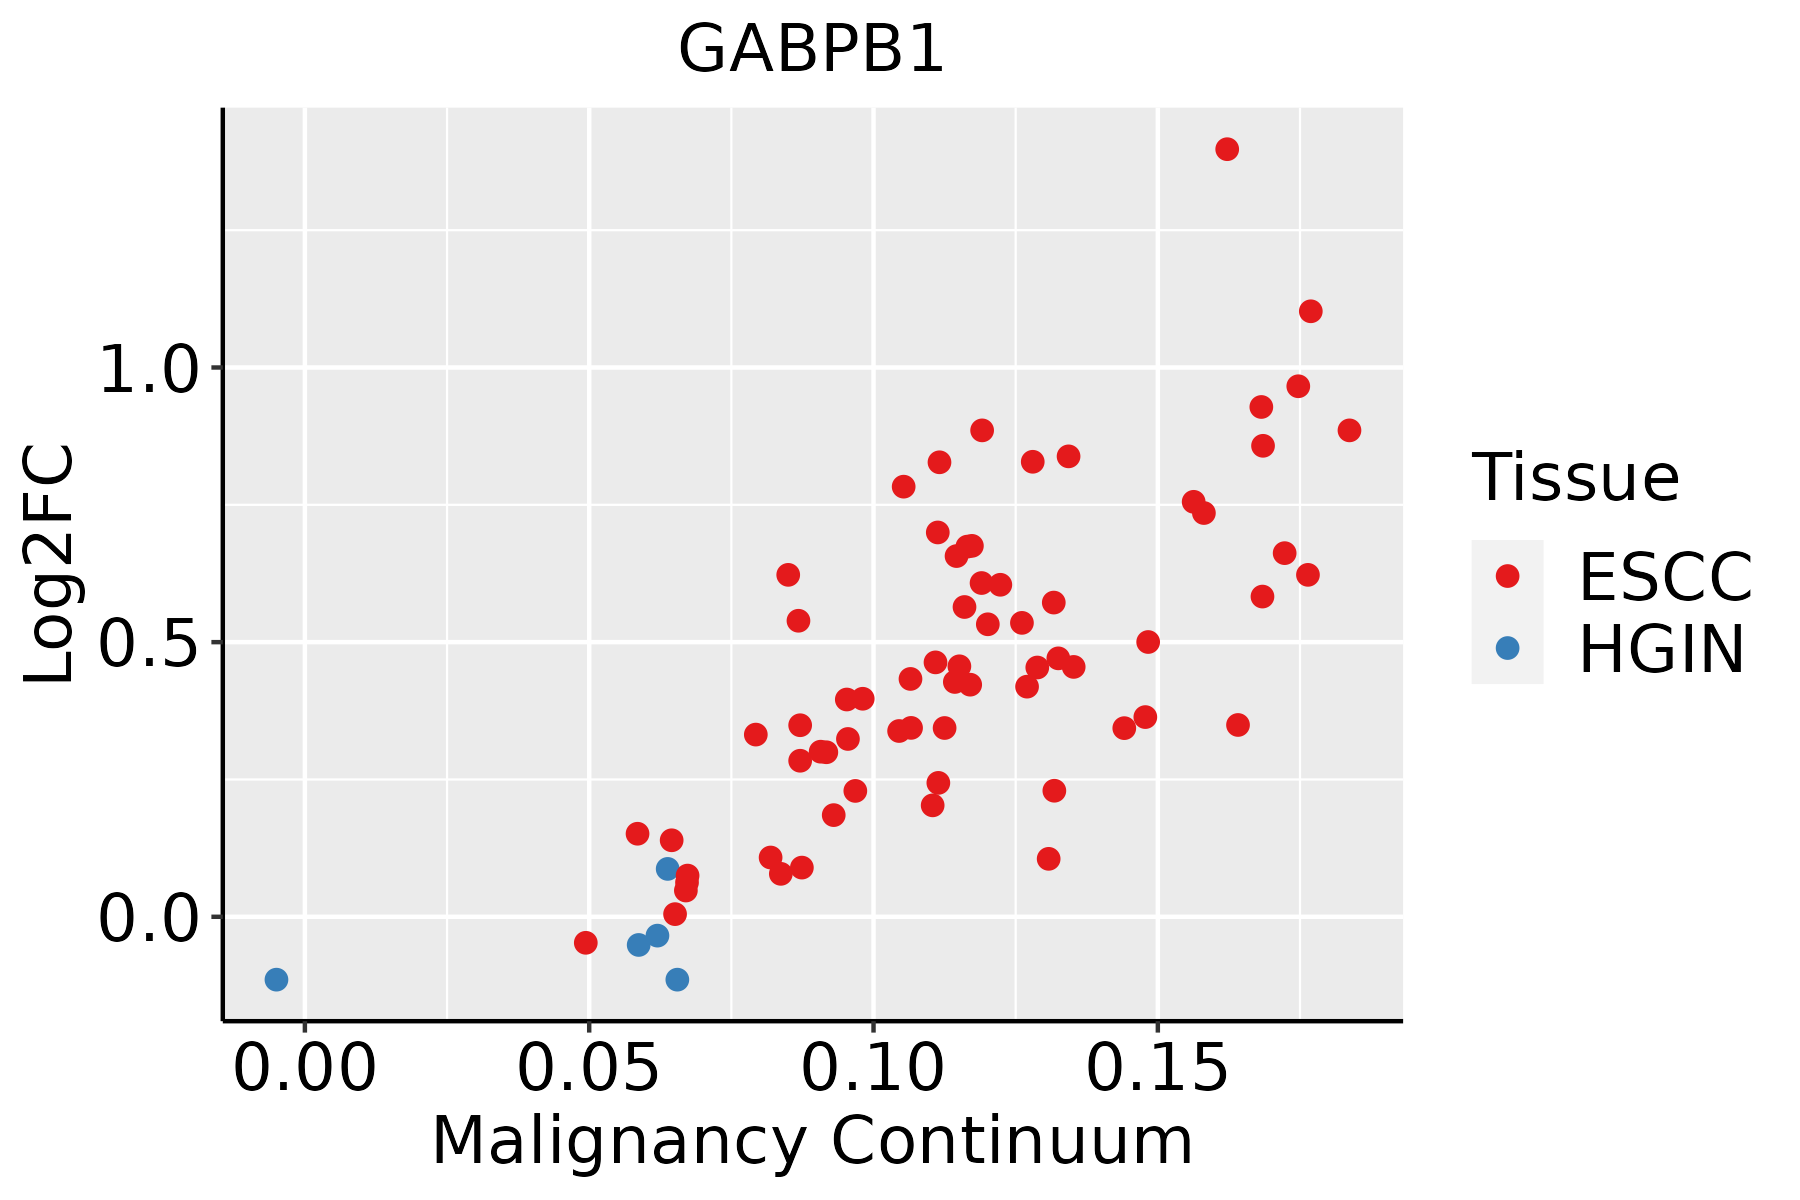 | ESCC: Esophageal squamous cell carcinoma |
| HGIN: High-grade intraepithelial neoplasias | ||
| LGIN: Low-grade intraepithelial neoplasias | ||
| Oral Cavity |  | EOLP: Erosive Oral lichen planus |
| LP: leukoplakia | ||
| NEOLP: Non-erosive oral lichen planus | ||
| OSCC: Oral squamous cell carcinoma |
| ∗log2FC in expression of this searched gene in stem-like cells from each diseased tissue sample relative to stem-like cells in normal samples in each tissue plotted against the malignancy continuum. Samples are colored based on if they are from different disease stage. |
Top |
Malignant transformation related pathway analysis |
| Find out the enriched GO biological processes and KEGG pathways involved in transition from healthy to precancer to cancer |
| Tissue | Disease Stage | Enriched GO biological Processes |
| Colorectum | AD |  |
| Colorectum | SER |  |
| Colorectum | MSS |  |
| Colorectum | MSI-H |  |
| Colorectum | FAP |  |
| ∗Top 15 enriched GO BP terms are showed in the bar plot of each disease state in each tissue. Each row represents a significant GO biological process which is colored according to the -log10(p.adjust). |
| Page: 1 2 3 4 5 6 7 8 9 |
| GO ID | Tissue | Disease Stage | Description | Gene Ratio | Bg Ratio | pvalue | p.adjust | Count |
| Page: 1 |
| Pathway ID | Tissue | Disease Stage | Description | Gene Ratio | Bg Ratio | pvalue | p.adjust | qvalue | Count |
| Page: 1 |
Top |
Cell-cell communication analysis |
| Identification of potential cell-cell interactions between two cell types and their ligand-receptor pairs for different disease states |
| Ligand | Receptor | LRpair | Pathway | Tissue | Disease Stage |
| Page: 1 |
Top |
Single-cell gene regulatory network inference analysis |
| Find out the significant the regulons (TFs) and the target genes of each regulon across cell types for different disease states |
| TF | Cell Type | Tissue | Disease Stage | Target Gene | RSS | Regulon Activity |
| GABPB1 | CAF | Cervix | ADJ | SSTR2,CLDN11,GNB2L1, etc. | 3.10e-01 |  |
| GABPB1 | PRO | Esophagus | Healthy | COMMD10,EIF3M,TRMT112, etc. | 2.17e-01 |  |
| GABPB1 | CD8TEREX | Lung | ADJ | ATP8B4,IFNG,GABPB1-IT1, etc. | 3.25e-02 |  |
| GABPB1 | STM | Stomach | CAG | CCL4L2,CCDC71L,KDM2B, etc. | 1.35e-01 |  |
| GABPB1 | STM | Stomach | CSG | CCL4L2,CCDC71L,KDM2B, etc. | 2.62e-01 |  |
| GABPB1 | CHIEF | Stomach | CSG | CCL4L2,CCDC71L,KDM2B, etc. | 3.22e-01 | |
| GABPB1 | MESC | Stomach | GC | CCL4L2,CCDC71L,KDM2B, etc. | 6.66e-02 |  |
| GABPB1 | CHIEF | Stomach | GC | CCL4L2,CCDC71L,KDM2B, etc. | 2.64e-01 | |
| GABPB1 | STM | Stomach | WIM | CCL4L2,CCDC71L,KDM2B, etc. | 2.43e-01 |  |
| GABPB1 | NK | Stomach | CAG with IM | LINC02328,SRSF8,DNAJC27, etc. | 6.38e-02 |  |
| ∗The dot plots of a searched regulon are shown for all cell subpopulations in each disease state of each tissue based on the regulon specific score inferred using pySCENIC and by calculating the average expression. |
| Page: 1 |
Top |
Somatic mutation of malignant transformation related genes |
| Annotation of somatic variants for genes involved in malignant transformation |
| Hugo Symbol | Variant Class | Variant Classification | dbSNP RS | HGVSc | HGVSp | HGVSp Short | SWISSPROT | BIOTYPE | SIFT | PolyPhen | Tumor Sample Barcode | Tissue | Histology | Sex | Age | Stage | Therapy Types | Drugs | Outcome |
| GABPB1 | SNV | Missense_Mutation | c.622G>A | p.Glu208Lys | p.E208K | Q06547 | protein_coding | tolerated(0.52) | benign(0.025) | TCGA-AC-A23H-01 | Breast | breast invasive carcinoma | Female | >=65 | I/II | Unknown | Unknown | PD | |
| GABPB1 | SNV | Missense_Mutation | c.163G>C | p.Glu55Gln | p.E55Q | Q06547 | protein_coding | deleterious(0.01) | probably_damaging(0.97) | TCGA-DR-A0ZM-01 | Cervix | cervical & endocervical cancer | Female | <65 | III/IV | Unspecific | Cisplatin | SD | |
| GABPB1 | SNV | Missense_Mutation | novel | c.386N>G | p.Asp129Gly | p.D129G | Q06547 | protein_coding | deleterious(0) | probably_damaging(0.993) | TCGA-AA-3845-01 | Colorectum | colon adenocarcinoma | Female | >=65 | I/II | Unknown | Unknown | PD |
| GABPB1 | SNV | Missense_Mutation | c.997G>A | p.Glu333Lys | p.E333K | Q06547 | protein_coding | deleterious(0.04) | probably_damaging(0.935) | TCGA-AA-A010-01 | Colorectum | colon adenocarcinoma | Female | <65 | I/II | Chemotherapy | folinic | CR | |
| GABPB1 | SNV | Missense_Mutation | c.295N>T | p.Ala99Ser | p.A99S | Q06547 | protein_coding | deleterious(0.05) | probably_damaging(0.995) | TCGA-DM-A1D6-01 | Colorectum | colon adenocarcinoma | Male | >=65 | I/II | Unknown | Unknown | SD | |
| GABPB1 | SNV | Missense_Mutation | c.437A>C | p.Asp146Ala | p.D146A | Q06547 | protein_coding | deleterious(0.03) | benign(0.237) | TCGA-F4-6570-01 | Colorectum | colon adenocarcinoma | Female | >=65 | I/II | Unknown | Unknown | SD | |
| GABPB1 | SNV | Missense_Mutation | novel | c.436G>T | p.Asp146Tyr | p.D146Y | Q06547 | protein_coding | deleterious(0) | possibly_damaging(0.842) | TCGA-AG-3892-01 | Colorectum | rectum adenocarcinoma | Female | <65 | I/II | Unknown | Unknown | SD |
| GABPB1 | SNV | Missense_Mutation | novel | c.1094N>A | p.Arg365Gln | p.R365Q | Q06547 | protein_coding | tolerated(0.08) | probably_damaging(0.953) | TCGA-AG-A002-01 | Colorectum | rectum adenocarcinoma | Male | <65 | I/II | Unknown | Unknown | SD |
| GABPB1 | SNV | Missense_Mutation | c.997N>A | p.Glu333Lys | p.E333K | Q06547 | protein_coding | deleterious(0.04) | probably_damaging(0.935) | TCGA-A5-A0G2-01 | Endometrium | uterine corpus endometrioid carcinoma | Female | <65 | III/IV | Unknown | Unknown | SD | |
| GABPB1 | SNV | Missense_Mutation | novel | c.451N>T | p.Asp151Tyr | p.D151Y | Q06547 | protein_coding | deleterious(0) | possibly_damaging(0.679) | TCGA-A5-A0G2-01 | Endometrium | uterine corpus endometrioid carcinoma | Female | <65 | III/IV | Unknown | Unknown | SD |
| Page: 1 2 3 4 5 |
Top |
Related drugs of malignant transformation related genes |
| Identification of chemicals and drugs interact with genes involved in malignant transfromation |
| (DGIdb 4.0) |
| Entrez ID | Symbol | Category | Interaction Types | Drug Claim Name | Drug Name | PMIDs |
| Page: 1 |

Copyright 2023-Present -The University of Texas Health Science Center at Houston |