
|
|||||
|
 | |
| |
| |
| |
| |
| |
|
Gene: GABPA |
Gene summary for GABPA |
| Gene information | Species | Human | Gene symbol | GABPA | Gene ID | 2551 |
| Gene name | GA binding protein transcription factor subunit alpha | |
| Gene Alias | E4TF1-60 | |
| Cytomap | 21q21.3 | |
| Gene Type | protein-coding | GO ID | GO:0000122 | UniProtAcc | A8IE48 |
Top |
Malignant transformation analysis |
| Identification of the aberrant gene expression in precancerous and cancerous lesions by comparing the gene expression of stem-like cells in diseased tissues with normal stem cells |
| Entrez ID | Symbol | Replicates | Species | Organ | Tissue | Adj P-value | Log2FC | Malignancy |
| 2551 | GABPA | male-WTA | Human | Thyroid | PTC | 1.85e-21 | 1.05e-01 | 0.1037 |
| 2551 | GABPA | PTC01 | Human | Thyroid | PTC | 3.85e-05 | -2.74e-02 | 0.1899 |
| 2551 | GABPA | PTC04 | Human | Thyroid | PTC | 4.74e-08 | 5.53e-02 | 0.1927 |
| 2551 | GABPA | PTC05 | Human | Thyroid | PTC | 1.95e-09 | 2.15e-01 | 0.2065 |
| 2551 | GABPA | PTC06 | Human | Thyroid | PTC | 2.84e-17 | 2.61e-01 | 0.2057 |
| 2551 | GABPA | PTC07 | Human | Thyroid | PTC | 1.20e-14 | 2.06e-01 | 0.2044 |
| 2551 | GABPA | ATC12 | Human | Thyroid | ATC | 7.30e-07 | 1.97e-02 | 0.34 |
| 2551 | GABPA | ATC13 | Human | Thyroid | ATC | 6.82e-24 | 5.14e-01 | 0.34 |
| 2551 | GABPA | ATC2 | Human | Thyroid | ATC | 5.78e-05 | 4.00e-01 | 0.34 |
| 2551 | GABPA | ATC4 | Human | Thyroid | ATC | 2.71e-09 | 5.52e-02 | 0.34 |
| 2551 | GABPA | ATC5 | Human | Thyroid | ATC | 9.84e-28 | 5.76e-01 | 0.34 |
| Page: 1 |
| Tissue | Expression Dynamics | Abbreviation |
| Thyroid | 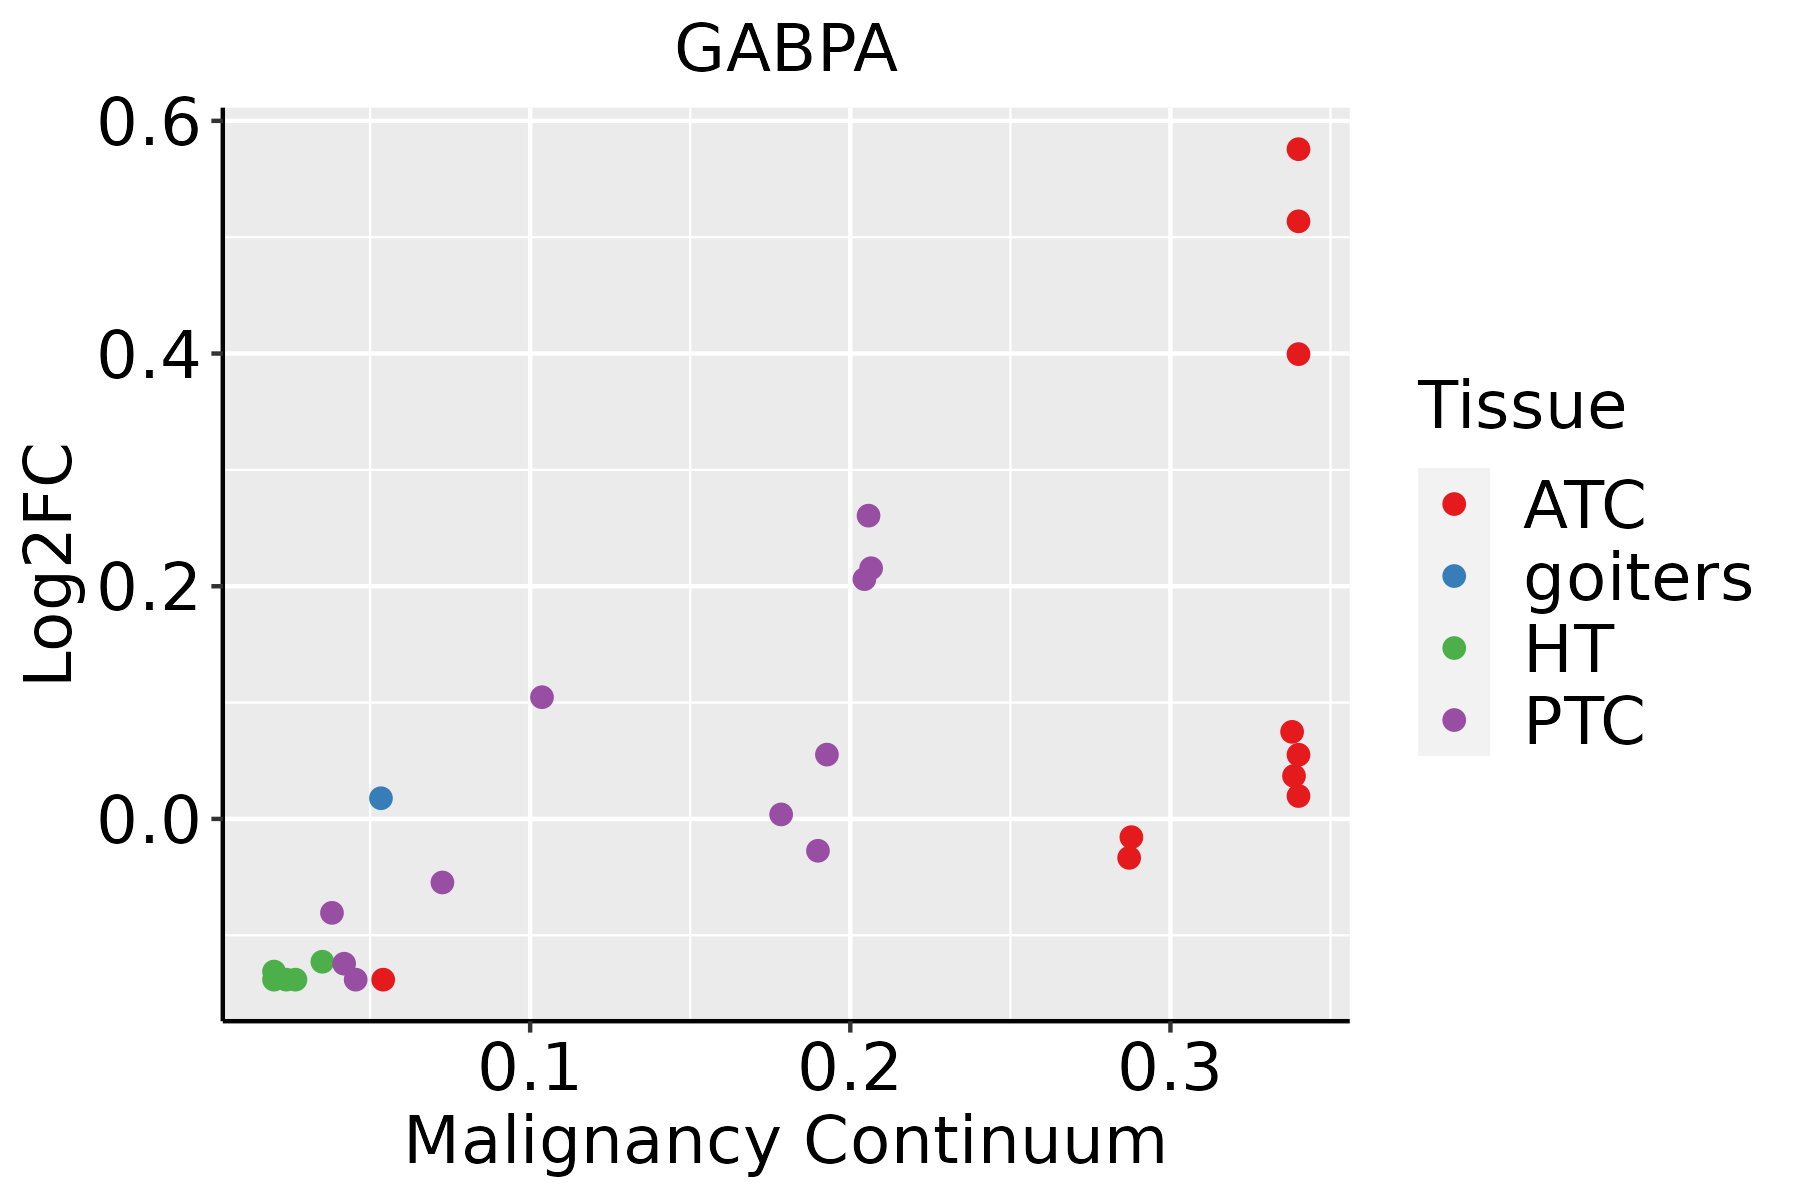 | ATC: Anaplastic thyroid cancer |
| HT: Hashimoto's thyroiditis | ||
| PTC: Papillary thyroid cancer |
| ∗log2FC in expression of this searched gene in stem-like cells from each diseased tissue sample relative to stem-like cells in normal samples in each tissue plotted against the malignancy continuum. Samples are colored based on if they are from different disease stage. |
Top |
Malignant transformation related pathway analysis |
| Find out the enriched GO biological processes and KEGG pathways involved in transition from healthy to precancer to cancer |
| Tissue | Disease Stage | Enriched GO biological Processes |
| Colorectum | AD |  |
| Colorectum | SER |  |
| Colorectum | MSS |  |
| Colorectum | MSI-H |  |
| Colorectum | FAP |  |
| ∗Top 15 enriched GO BP terms are showed in the bar plot of each disease state in each tissue. Each row represents a significant GO biological process which is colored according to the -log10(p.adjust). |
| Page: 1 2 3 4 5 6 7 8 9 |
| GO ID | Tissue | Disease Stage | Description | Gene Ratio | Bg Ratio | pvalue | p.adjust | Count |
| GO:0001701111 | Thyroid | PTC | in utero embryonic development | 175/5968 | 367/18723 | 1.40e-10 | 4.73e-09 | 175 |
| GO:0030099113 | Thyroid | PTC | myeloid cell differentiation | 160/5968 | 381/18723 | 1.75e-05 | 1.82e-04 | 160 |
| GO:000182513 | Thyroid | PTC | blastocyst formation | 22/5968 | 38/18723 | 8.19e-04 | 5.07e-03 | 22 |
| GO:00018246 | Thyroid | PTC | blastocyst development | 49/5968 | 106/18723 | 1.37e-03 | 7.72e-03 | 49 |
| GO:000170126 | Thyroid | ATC | in utero embryonic development | 183/6293 | 367/18723 | 6.62e-11 | 2.11e-09 | 183 |
| GO:003009933 | Thyroid | ATC | myeloid cell differentiation | 170/6293 | 381/18723 | 4.26e-06 | 4.68e-05 | 170 |
| GO:000182414 | Thyroid | ATC | blastocyst development | 53/6293 | 106/18723 | 3.48e-04 | 2.16e-03 | 53 |
| GO:000182521 | Thyroid | ATC | blastocyst formation | 23/6293 | 38/18723 | 6.05e-04 | 3.44e-03 | 23 |
| GO:1903706112 | Thyroid | ATC | regulation of hemopoiesis | 148/6293 | 367/18723 | 3.87e-03 | 1.68e-02 | 148 |
| GO:0045637113 | Thyroid | ATC | regulation of myeloid cell differentiation | 89/6293 | 210/18723 | 4.75e-03 | 1.96e-02 | 89 |
| Page: 1 |
| Pathway ID | Tissue | Disease Stage | Description | Gene Ratio | Bg Ratio | pvalue | p.adjust | qvalue | Count |
| Page: 1 |
Top |
Cell-cell communication analysis |
| Identification of potential cell-cell interactions between two cell types and their ligand-receptor pairs for different disease states |
| Ligand | Receptor | LRpair | Pathway | Tissue | Disease Stage |
| Page: 1 |
Top |
Single-cell gene regulatory network inference analysis |
| Find out the significant the regulons (TFs) and the target genes of each regulon across cell types for different disease states |
| TF | Cell Type | Tissue | Disease Stage | Target Gene | RSS | Regulon Activity |
| GABPA | TUF | Colorectum | FAP | F11-AS1,PLCG2,GPS2, etc. | 7.45e-02 |  |
| GABPA | STM | Esophagus | ESCC | EMC2,TSLP,PNCK, etc. | 4.47e-01 |  |
| GABPA | NK | Oral cavity | ADJ | KLRF1,ACVR1B,ALS2, etc. | 4.48e-02 |  |
| ∗The dot plots of a searched regulon are shown for all cell subpopulations in each disease state of each tissue based on the regulon specific score inferred using pySCENIC and by calculating the average expression. |
| Page: 1 |
Top |
Somatic mutation of malignant transformation related genes |
| Annotation of somatic variants for genes involved in malignant transformation |
| Hugo Symbol | Variant Class | Variant Classification | dbSNP RS | HGVSc | HGVSp | HGVSp Short | SWISSPROT | BIOTYPE | SIFT | PolyPhen | Tumor Sample Barcode | Tissue | Histology | Sex | Age | Stage | Therapy Types | Drugs | Outcome |
| GABPA | SNV | Missense_Mutation | novel | c.1214N>T | p.Thr405Ile | p.T405I | Q06546 | protein_coding | tolerated(0.17) | benign(0.026) | TCGA-D8-A1JL-01 | Breast | breast invasive carcinoma | Female | >=65 | I/II | Unknown | Unknown | SD |
| GABPA | SNV | Missense_Mutation | novel | c.331N>A | p.Leu111Ile | p.L111I | Q06546 | protein_coding | tolerated(0.17) | benign(0.145) | TCGA-2W-A8YY-01 | Cervix | cervical & endocervical cancer | Female | <65 | I/II | Chemotherapy | cisplatin | CR |
| GABPA | SNV | Missense_Mutation | rs2829897 | c.872N>T | p.Ala291Val | p.A291V | Q06546 | protein_coding | tolerated(0.31) | benign(0.003) | TCGA-AA-3672-01 | Colorectum | colon adenocarcinoma | Female | >=65 | III/IV | Unknown | Unknown | SD |
| GABPA | SNV | Missense_Mutation | c.1151N>T | p.Gly384Val | p.G384V | Q06546 | protein_coding | deleterious(0) | probably_damaging(1) | TCGA-AA-3950-01 | Colorectum | colon adenocarcinoma | Female | >=65 | I/II | Unknown | Unknown | SD | |
| GABPA | SNV | Missense_Mutation | c.718N>A | p.Leu240Ile | p.L240I | Q06546 | protein_coding | deleterious(0.02) | probably_damaging(0.912) | TCGA-AA-A00N-01 | Colorectum | colon adenocarcinoma | Male | >=65 | I/II | Unknown | Unknown | PD | |
| GABPA | SNV | Missense_Mutation | c.185N>A | p.Ser62Tyr | p.S62Y | Q06546 | protein_coding | deleterious(0.02) | possibly_damaging(0.764) | TCGA-AA-A010-01 | Colorectum | colon adenocarcinoma | Female | <65 | I/II | Chemotherapy | folinic | CR | |
| GABPA | SNV | Missense_Mutation | c.1126N>T | p.Arg376Cys | p.R376C | Q06546 | protein_coding | deleterious(0) | probably_damaging(1) | TCGA-AA-A010-01 | Colorectum | colon adenocarcinoma | Female | <65 | I/II | Chemotherapy | folinic | CR | |
| GABPA | SNV | Missense_Mutation | novel | c.1154N>G | p.Asp385Gly | p.D385G | Q06546 | protein_coding | deleterious(0) | possibly_damaging(0.725) | TCGA-AD-6889-01 | Colorectum | colon adenocarcinoma | Male | >=65 | I/II | Chemotherapy | xeloda | PD |
| GABPA | SNV | Missense_Mutation | novel | c.1148N>G | p.Asp383Gly | p.D383G | Q06546 | protein_coding | deleterious(0.01) | probably_damaging(1) | TCGA-DM-A28G-01 | Colorectum | colon adenocarcinoma | Male | >=65 | I/II | Unknown | Unknown | SD |
| GABPA | SNV | Missense_Mutation | c.1232C>T | p.Ala411Val | p.A411V | Q06546 | protein_coding | deleterious(0.04) | benign(0.118) | TCGA-QL-A97D-01 | Colorectum | colon adenocarcinoma | Female | >=65 | I/II | Unknown | Unknown | SD |
| Page: 1 2 3 4 5 6 |
Top |
Related drugs of malignant transformation related genes |
| Identification of chemicals and drugs interact with genes involved in malignant transfromation |
| (DGIdb 4.0) |
| Entrez ID | Symbol | Category | Interaction Types | Drug Claim Name | Drug Name | PMIDs |
| 2551 | GABPA | TRANSCRIPTION FACTOR | QUERCETIN | QUERCETIN | 17462537 | |
| 2551 | GABPA | TRANSCRIPTION FACTOR | CISPLATIN | CISPLATIN | 18036733 | |
| 2551 | GABPA | TRANSCRIPTION FACTOR | DOX | 17081560 | ||
| 2551 | GABPA | TRANSCRIPTION FACTOR | CSA | CYCLOSPORINE | 16612258 |
| Page: 1 |

Copyright 2023-Present -The University of Texas Health Science Center at Houston |