
|
|||||
|
 | |
| |
| |
| |
| |
| |
|
Gene: GABARAPL1 |
Gene summary for GABARAPL1 |
| Gene information | Species | Human | Gene symbol | GABARAPL1 | Gene ID | 23710 |
| Gene name | GABA type A receptor associated protein like 1 | |
| Gene Alias | APG8-LIKE | |
| Cytomap | 12p13.2 | |
| Gene Type | protein-coding | GO ID | GO:0000045 | UniProtAcc | A0A024RAP5 |
Top |
Malignant transformation analysis |
| Identification of the aberrant gene expression in precancerous and cancerous lesions by comparing the gene expression of stem-like cells in diseased tissues with normal stem cells |
| Entrez ID | Symbol | Replicates | Species | Organ | Tissue | Adj P-value | Log2FC | Malignancy |
| 23710 | GABARAPL1 | LZE4T | Human | Esophagus | ESCC | 7.44e-04 | 1.05e-01 | 0.0811 |
| 23710 | GABARAPL1 | LZE7T | Human | Esophagus | ESCC | 8.71e-04 | 4.36e-01 | 0.0667 |
| 23710 | GABARAPL1 | LZE8T | Human | Esophagus | ESCC | 6.05e-06 | 4.01e-01 | 0.067 |
| 23710 | GABARAPL1 | LZE20T | Human | Esophagus | ESCC | 1.10e-05 | -1.64e-01 | 0.0662 |
| 23710 | GABARAPL1 | LZE22D1 | Human | Esophagus | HGIN | 3.64e-03 | -1.28e-01 | 0.0595 |
| 23710 | GABARAPL1 | LZE24T | Human | Esophagus | ESCC | 9.85e-06 | 4.50e-01 | 0.0596 |
| 23710 | GABARAPL1 | LZE6T | Human | Esophagus | ESCC | 4.99e-04 | 7.30e-02 | 0.0845 |
| 23710 | GABARAPL1 | P1T-E | Human | Esophagus | ESCC | 2.21e-05 | 2.84e-01 | 0.0875 |
| 23710 | GABARAPL1 | P2T-E | Human | Esophagus | ESCC | 2.84e-25 | 5.15e-01 | 0.1177 |
| 23710 | GABARAPL1 | P4T-E | Human | Esophagus | ESCC | 2.74e-26 | 8.61e-01 | 0.1323 |
| 23710 | GABARAPL1 | P5T-E | Human | Esophagus | ESCC | 2.00e-07 | -6.65e-02 | 0.1327 |
| 23710 | GABARAPL1 | P8T-E | Human | Esophagus | ESCC | 2.84e-10 | 3.41e-01 | 0.0889 |
| 23710 | GABARAPL1 | P9T-E | Human | Esophagus | ESCC | 2.07e-07 | 4.97e-01 | 0.1131 |
| 23710 | GABARAPL1 | P10T-E | Human | Esophagus | ESCC | 2.64e-13 | 5.56e-02 | 0.116 |
| 23710 | GABARAPL1 | P11T-E | Human | Esophagus | ESCC | 3.76e-13 | 2.53e-01 | 0.1426 |
| 23710 | GABARAPL1 | P12T-E | Human | Esophagus | ESCC | 3.28e-18 | 5.14e-01 | 0.1122 |
| 23710 | GABARAPL1 | P15T-E | Human | Esophagus | ESCC | 2.11e-14 | 4.68e-01 | 0.1149 |
| 23710 | GABARAPL1 | P16T-E | Human | Esophagus | ESCC | 8.44e-44 | 1.20e+00 | 0.1153 |
| 23710 | GABARAPL1 | P20T-E | Human | Esophagus | ESCC | 2.07e-06 | 3.37e-01 | 0.1124 |
| 23710 | GABARAPL1 | P21T-E | Human | Esophagus | ESCC | 5.54e-09 | -7.05e-02 | 0.1617 |
| Page: 1 2 3 4 5 |
| Tissue | Expression Dynamics | Abbreviation |
| Esophagus | 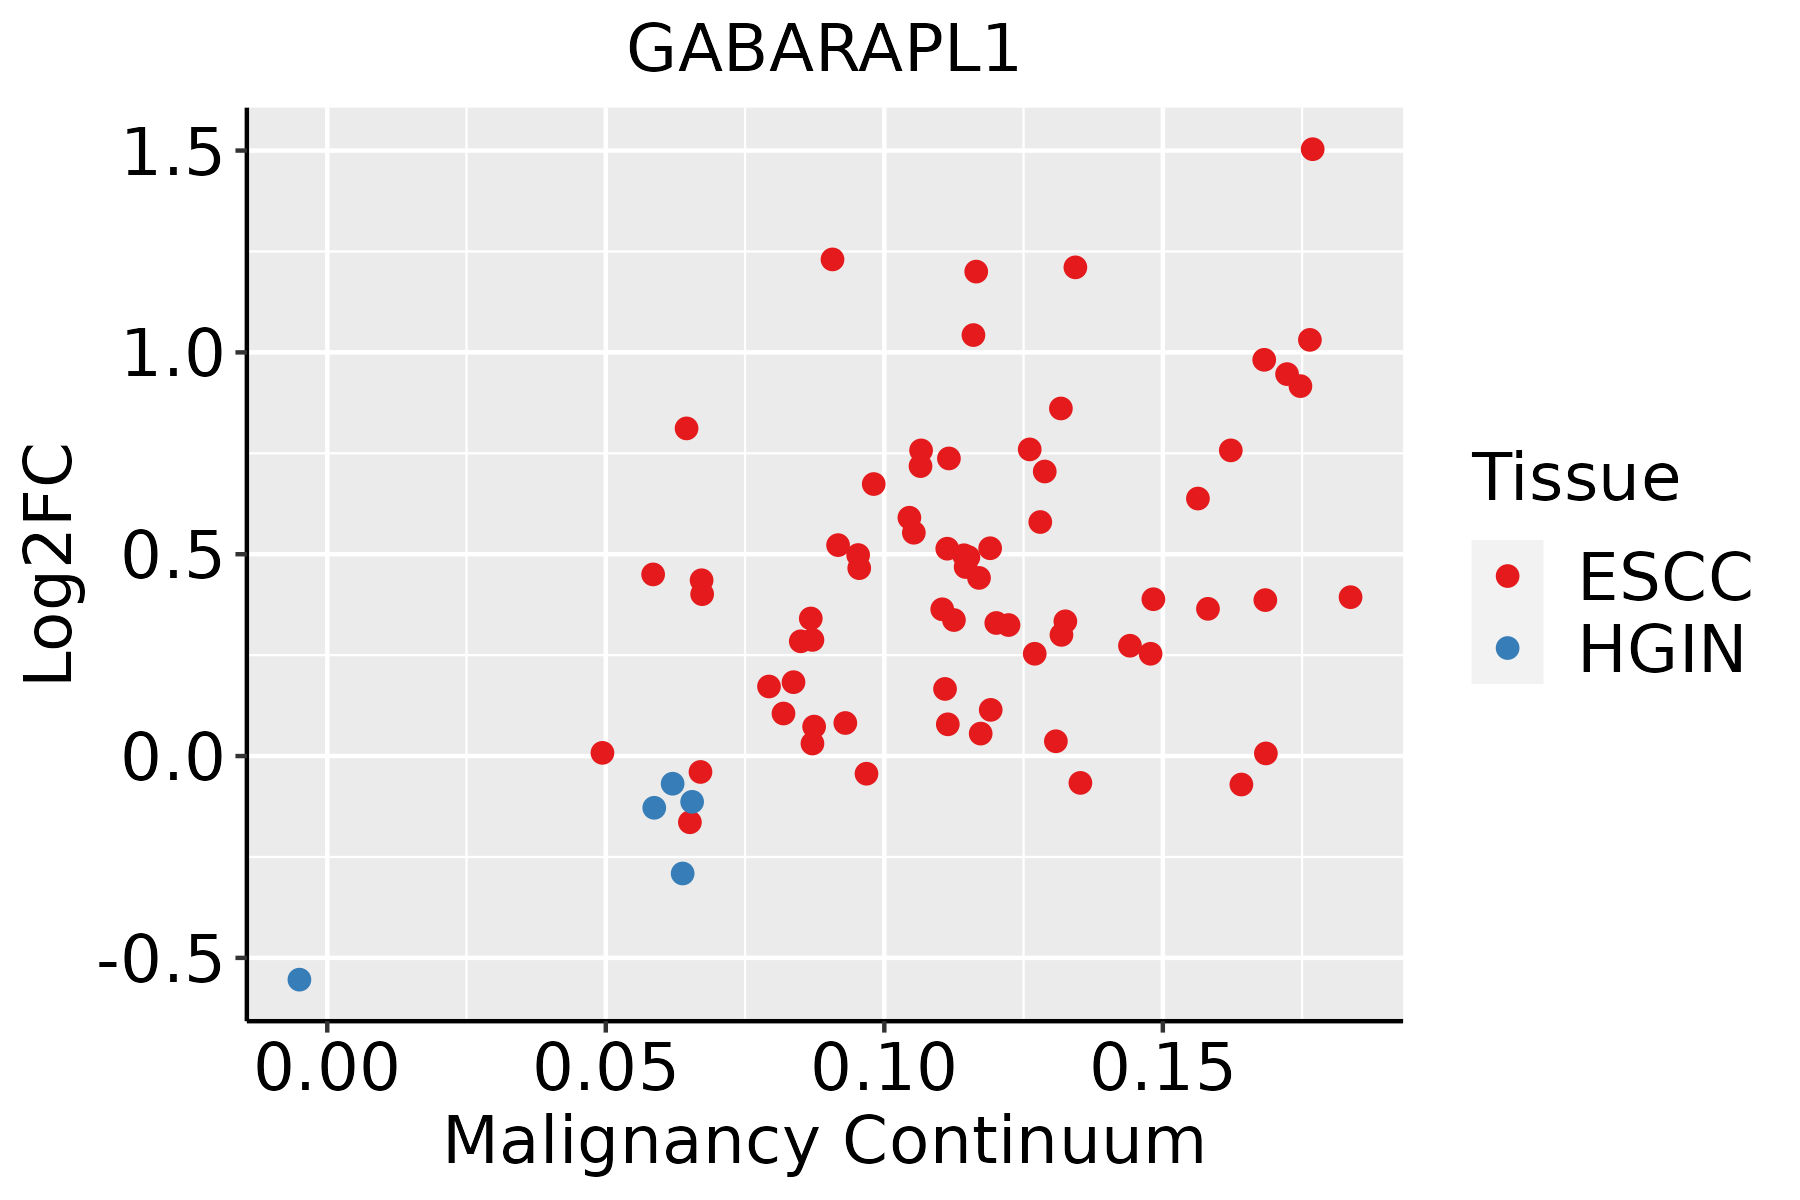 | ESCC: Esophageal squamous cell carcinoma |
| HGIN: High-grade intraepithelial neoplasias | ||
| LGIN: Low-grade intraepithelial neoplasias | ||
| Liver |  | HCC: Hepatocellular carcinoma |
| NAFLD: Non-alcoholic fatty liver disease | ||
| Oral Cavity | 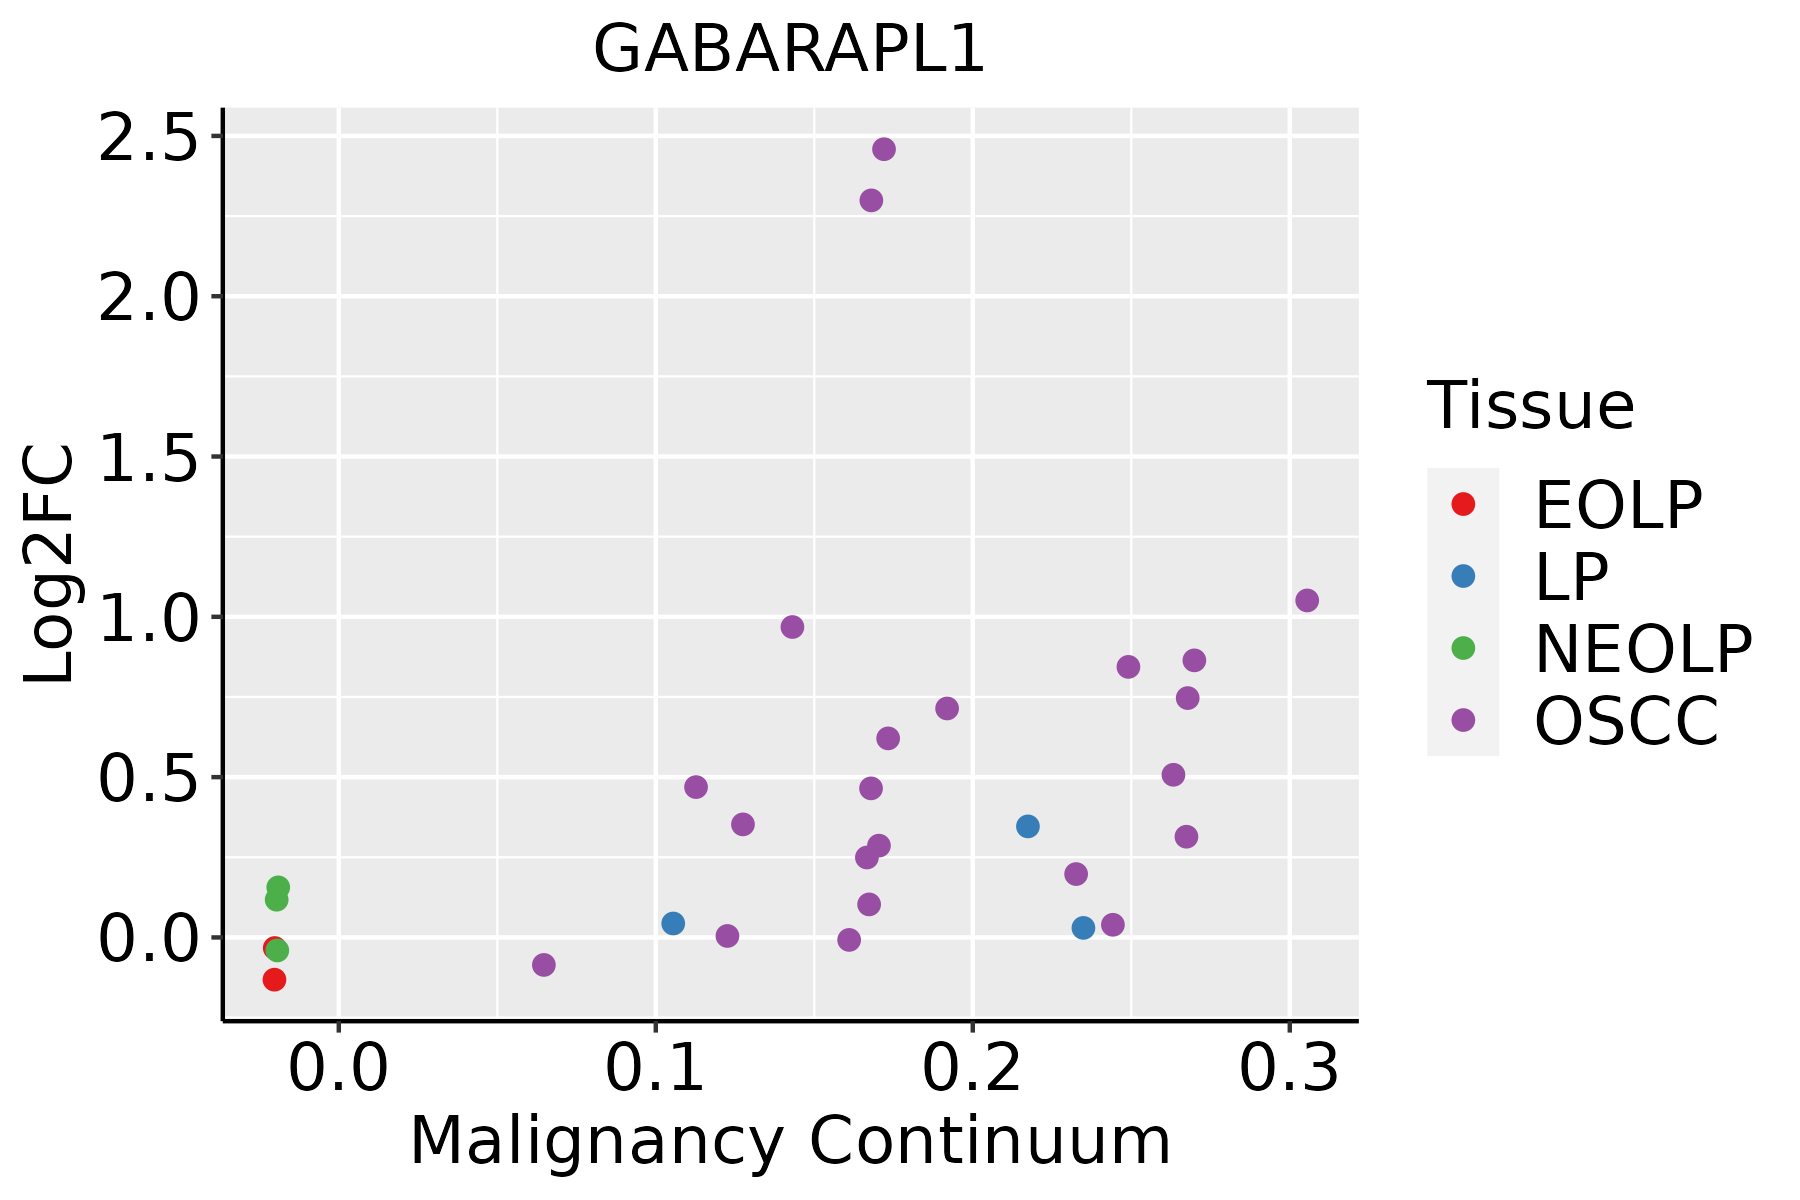 | EOLP: Erosive Oral lichen planus |
| LP: leukoplakia | ||
| NEOLP: Non-erosive oral lichen planus | ||
| OSCC: Oral squamous cell carcinoma | ||
| Thyroid | 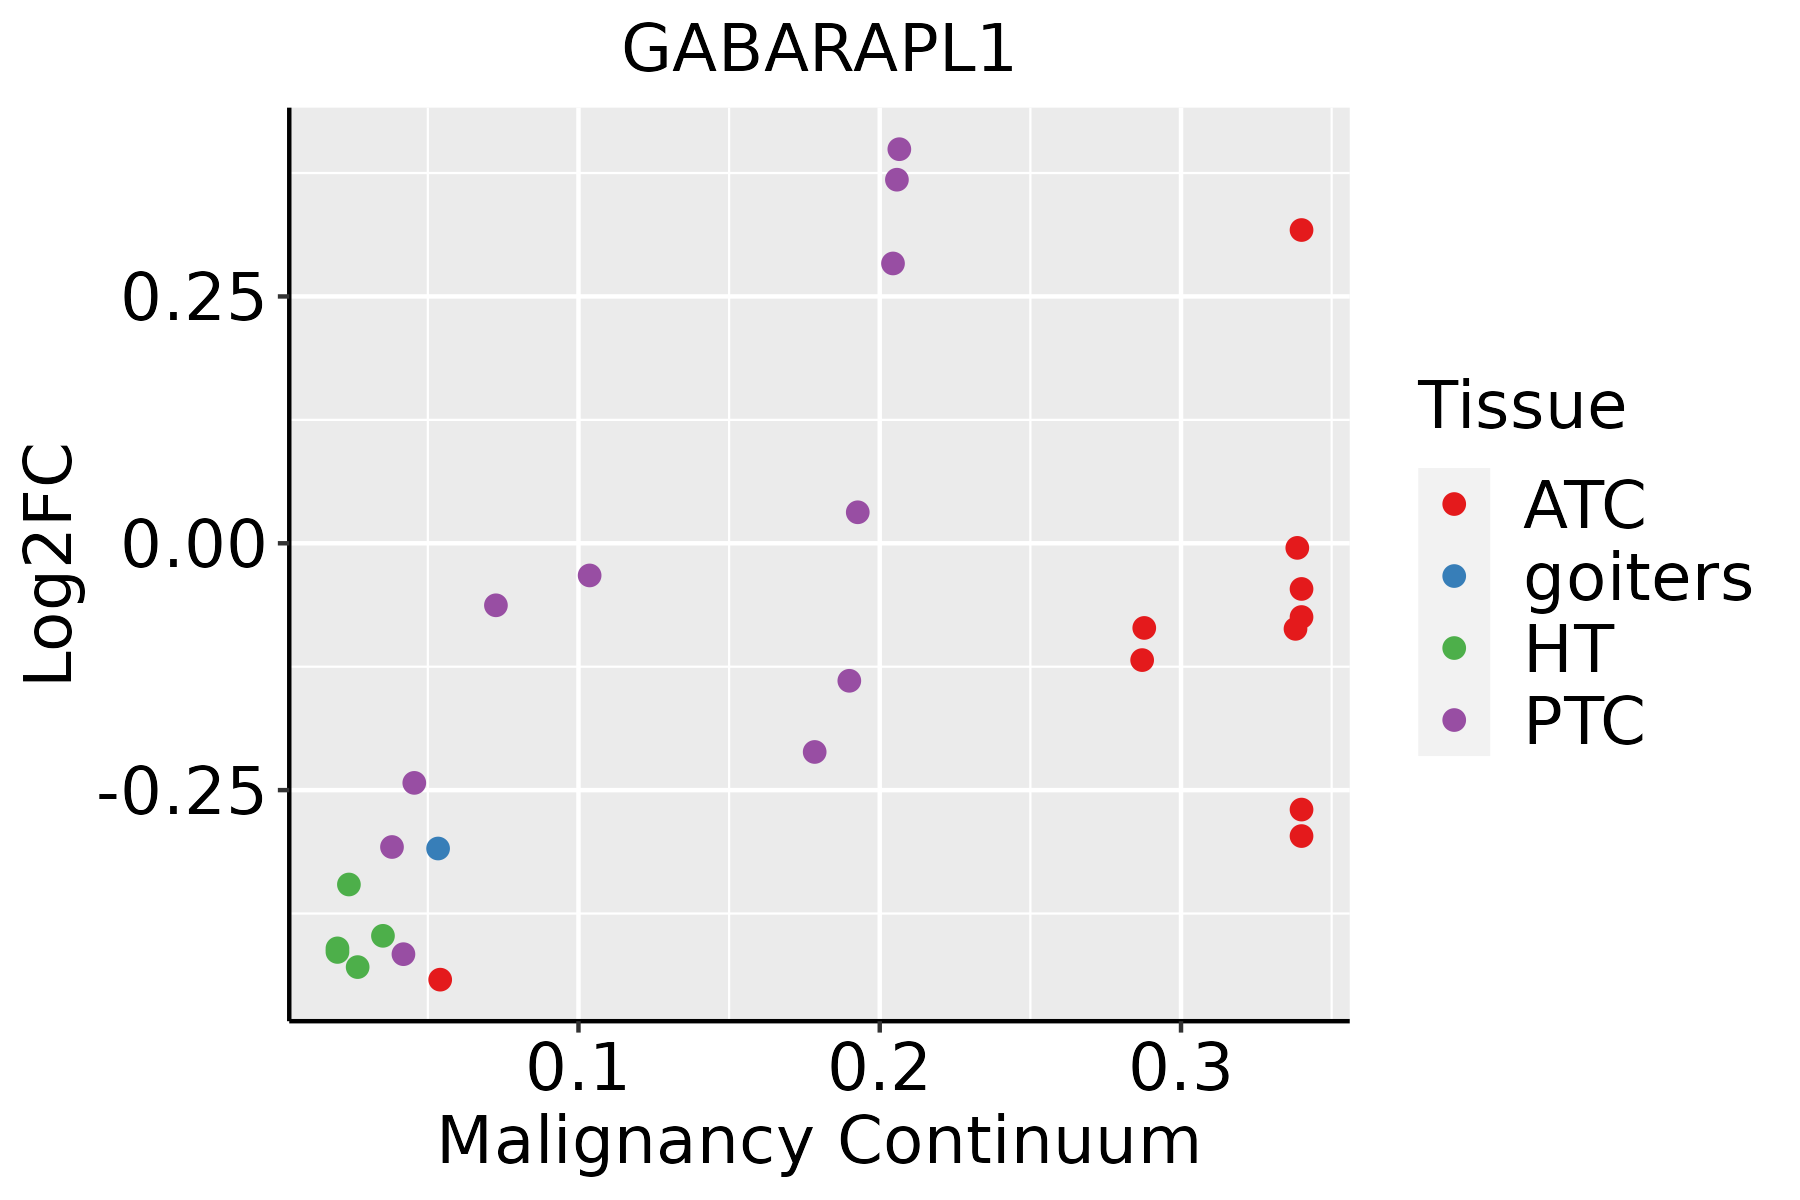 | ATC: Anaplastic thyroid cancer |
| HT: Hashimoto's thyroiditis | ||
| PTC: Papillary thyroid cancer |
| ∗log2FC in expression of this searched gene in stem-like cells from each diseased tissue sample relative to stem-like cells in normal samples in each tissue plotted against the malignancy continuum. Samples are colored based on if they are from different disease stage. |
Top |
Malignant transformation related pathway analysis |
| Find out the enriched GO biological processes and KEGG pathways involved in transition from healthy to precancer to cancer |
| Tissue | Disease Stage | Enriched GO biological Processes |
| Colorectum | AD |  |
| Colorectum | SER |  |
| Colorectum | MSS |  |
| Colorectum | MSI-H |  |
| Colorectum | FAP |  |
| ∗Top 15 enriched GO BP terms are showed in the bar plot of each disease state in each tissue. Each row represents a significant GO biological process which is colored according to the -log10(p.adjust). |
| Page: 1 2 3 4 5 6 7 8 9 |
| GO ID | Tissue | Disease Stage | Description | Gene Ratio | Bg Ratio | pvalue | p.adjust | Count |
| GO:001623616 | Esophagus | HGIN | macroautophagy | 77/2587 | 291/18723 | 7.15e-09 | 4.61e-07 | 77 |
| GO:002241120 | Esophagus | HGIN | cellular component disassembly | 102/2587 | 443/18723 | 8.31e-08 | 4.33e-06 | 102 |
| GO:19030089 | Esophagus | HGIN | organelle disassembly | 36/2587 | 114/18723 | 8.60e-07 | 3.58e-05 | 36 |
| GO:007149626 | Esophagus | HGIN | cellular response to external stimulus | 71/2587 | 320/18723 | 2.77e-05 | 7.19e-04 | 71 |
| GO:000042216 | Esophagus | HGIN | autophagy of mitochondrion | 25/2587 | 81/18723 | 5.95e-05 | 1.38e-03 | 25 |
| GO:006172616 | Esophagus | HGIN | mitochondrion disassembly | 25/2587 | 81/18723 | 5.95e-05 | 1.38e-03 | 25 |
| GO:00070336 | Esophagus | HGIN | vacuole organization | 44/2587 | 180/18723 | 8.97e-05 | 1.96e-03 | 44 |
| GO:003166820 | Esophagus | HGIN | cellular response to extracellular stimulus | 56/2587 | 246/18723 | 9.05e-05 | 1.97e-03 | 56 |
| GO:19050375 | Esophagus | HGIN | autophagosome organization | 28/2587 | 103/18723 | 2.58e-04 | 4.53e-03 | 28 |
| GO:00000455 | Esophagus | HGIN | autophagosome assembly | 26/2587 | 99/18723 | 7.45e-04 | 9.90e-03 | 26 |
| GO:003166920 | Esophagus | HGIN | cellular response to nutrient levels | 47/2587 | 215/18723 | 8.20e-04 | 1.07e-02 | 47 |
| GO:003166726 | Esophagus | HGIN | response to nutrient levels | 89/2587 | 474/18723 | 1.41e-03 | 1.64e-02 | 89 |
| GO:000926719 | Esophagus | HGIN | cellular response to starvation | 34/2587 | 156/18723 | 4.21e-03 | 3.77e-02 | 34 |
| GO:004259418 | Esophagus | HGIN | response to starvation | 41/2587 | 197/18723 | 4.34e-03 | 3.84e-02 | 41 |
| GO:001623617 | Esophagus | ESCC | macroautophagy | 216/8552 | 291/18723 | 1.94e-23 | 4.57e-21 | 216 |
| GO:0022411111 | Esophagus | ESCC | cellular component disassembly | 305/8552 | 443/18723 | 1.94e-23 | 4.57e-21 | 305 |
| GO:0071496111 | Esophagus | ESCC | cellular response to external stimulus | 215/8552 | 320/18723 | 4.29e-15 | 2.43e-13 | 215 |
| GO:0031668111 | Esophagus | ESCC | cellular response to extracellular stimulus | 168/8552 | 246/18723 | 4.93e-13 | 2.23e-11 | 168 |
| GO:190300816 | Esophagus | ESCC | organelle disassembly | 89/8552 | 114/18723 | 1.36e-12 | 5.80e-11 | 89 |
| GO:0031669110 | Esophagus | ESCC | cellular response to nutrient levels | 148/8552 | 215/18723 | 4.58e-12 | 1.76e-10 | 148 |
| Page: 1 2 3 4 5 6 |
| Pathway ID | Tissue | Disease Stage | Description | Gene Ratio | Bg Ratio | pvalue | p.adjust | qvalue | Count |
| hsa0413730 | Esophagus | HGIN | Mitophagy - animal | 23/1383 | 72/8465 | 7.69e-04 | 7.59e-03 | 6.03e-03 | 23 |
| hsa046219 | Esophagus | HGIN | NOD-like receptor signaling pathway | 45/1383 | 186/8465 | 3.40e-03 | 2.54e-02 | 2.02e-02 | 45 |
| hsa04137113 | Esophagus | HGIN | Mitophagy - animal | 23/1383 | 72/8465 | 7.69e-04 | 7.59e-03 | 6.03e-03 | 23 |
| hsa0462114 | Esophagus | HGIN | NOD-like receptor signaling pathway | 45/1383 | 186/8465 | 3.40e-03 | 2.54e-02 | 2.02e-02 | 45 |
| hsa0414010 | Esophagus | ESCC | Autophagy - animal | 101/4205 | 141/8465 | 7.60e-08 | 6.21e-07 | 3.18e-07 | 101 |
| hsa04137210 | Esophagus | ESCC | Mitophagy - animal | 54/4205 | 72/8465 | 9.33e-06 | 4.96e-05 | 2.54e-05 | 54 |
| hsa040689 | Esophagus | ESCC | FoxO signaling pathway | 89/4205 | 131/8465 | 1.56e-05 | 7.98e-05 | 4.09e-05 | 89 |
| hsa0462122 | Esophagus | ESCC | NOD-like receptor signaling pathway | 116/4205 | 186/8465 | 2.90e-04 | 1.03e-03 | 5.30e-04 | 116 |
| hsa041362 | Esophagus | ESCC | Autophagy - other | 23/4205 | 32/8465 | 8.99e-03 | 2.14e-02 | 1.09e-02 | 23 |
| hsa0414015 | Esophagus | ESCC | Autophagy - animal | 101/4205 | 141/8465 | 7.60e-08 | 6.21e-07 | 3.18e-07 | 101 |
| hsa0413738 | Esophagus | ESCC | Mitophagy - animal | 54/4205 | 72/8465 | 9.33e-06 | 4.96e-05 | 2.54e-05 | 54 |
| hsa0406814 | Esophagus | ESCC | FoxO signaling pathway | 89/4205 | 131/8465 | 1.56e-05 | 7.98e-05 | 4.09e-05 | 89 |
| hsa0462132 | Esophagus | ESCC | NOD-like receptor signaling pathway | 116/4205 | 186/8465 | 2.90e-04 | 1.03e-03 | 5.30e-04 | 116 |
| hsa0413611 | Esophagus | ESCC | Autophagy - other | 23/4205 | 32/8465 | 8.99e-03 | 2.14e-02 | 1.09e-02 | 23 |
| hsa04068 | Liver | NAFLD | FoxO signaling pathway | 30/1043 | 131/8465 | 4.91e-04 | 8.05e-03 | 6.49e-03 | 30 |
| hsa0413712 | Liver | NAFLD | Mitophagy - animal | 18/1043 | 72/8465 | 2.27e-03 | 2.46e-02 | 1.99e-02 | 18 |
| hsa040681 | Liver | NAFLD | FoxO signaling pathway | 30/1043 | 131/8465 | 4.91e-04 | 8.05e-03 | 6.49e-03 | 30 |
| hsa0413713 | Liver | NAFLD | Mitophagy - animal | 18/1043 | 72/8465 | 2.27e-03 | 2.46e-02 | 1.99e-02 | 18 |
| hsa0413721 | Liver | Cirrhotic | Mitophagy - animal | 39/2530 | 72/8465 | 1.38e-05 | 1.24e-04 | 7.64e-05 | 39 |
| hsa041406 | Liver | Cirrhotic | Autophagy - animal | 65/2530 | 141/8465 | 3.10e-05 | 2.47e-04 | 1.52e-04 | 65 |
| Page: 1 2 |
Top |
Cell-cell communication analysis |
| Identification of potential cell-cell interactions between two cell types and their ligand-receptor pairs for different disease states |
| Ligand | Receptor | LRpair | Pathway | Tissue | Disease Stage |
| Page: 1 |
Top |
Single-cell gene regulatory network inference analysis |
| Find out the significant the regulons (TFs) and the target genes of each regulon across cell types for different disease states |
| TF | Cell Type | Tissue | Disease Stage | Target Gene | RSS | Regulon Activity |
| ∗The dot plots of a searched regulon are shown for all cell subpopulations in each disease state of each tissue based on the regulon specific score inferred using pySCENIC and by calculating the average expression. |
| Page: 1 |
Top |
Somatic mutation of malignant transformation related genes |
| Annotation of somatic variants for genes involved in malignant transformation |
| Hugo Symbol | Variant Class | Variant Classification | dbSNP RS | HGVSc | HGVSp | HGVSp Short | SWISSPROT | BIOTYPE | SIFT | PolyPhen | Tumor Sample Barcode | Tissue | Histology | Sex | Age | Stage | Therapy Types | Drugs | Outcome |
| GABARAPL1 | SNV | Missense_Mutation | c.221N>G | p.Asp74Gly | p.D74G | Q9H0R8 | protein_coding | deleterious(0.01) | possibly_damaging(0.446) | TCGA-A6-6780-01 | Colorectum | colon adenocarcinoma | Male | >=65 | I/II | Unknown | Unknown | SD | |
| GABARAPL1 | SNV | Missense_Mutation | novel | c.154N>T | p.Pro52Ser | p.P52S | Q9H0R8 | protein_coding | deleterious(0) | probably_damaging(1) | TCGA-AA-3984-01 | Colorectum | colon adenocarcinoma | Female | <65 | I/II | Unknown | Unknown | SD |
| GABARAPL1 | SNV | Missense_Mutation | novel | c.13N>C | p.Tyr5His | p.Y5H | Q9H0R8 | protein_coding | deleterious(0.01) | probably_damaging(0.949) | TCGA-CA-6717-01 | Colorectum | colon adenocarcinoma | Male | <65 | I/II | Chemotherapy | oxaliplatin | CR |
| GABARAPL1 | SNV | Missense_Mutation | novel | c.242N>G | p.Asn81Ser | p.N81S | Q9H0R8 | protein_coding | deleterious(0.04) | benign(0.374) | TCGA-AJ-A3EK-01 | Endometrium | uterine corpus endometrioid carcinoma | Female | <65 | I/II | Chemotherapy | carboplatin | CR |
| GABARAPL1 | SNV | Missense_Mutation | novel | c.60N>T | p.Lys20Asn | p.K20N | Q9H0R8 | protein_coding | tolerated(0.16) | benign(0.11) | TCGA-AJ-A3EL-01 | Endometrium | uterine corpus endometrioid carcinoma | Female | <65 | I/II | Unknown | Unknown | SD |
| GABARAPL1 | SNV | Missense_Mutation | c.146N>C | p.Tyr49Ser | p.Y49S | Q9H0R8 | protein_coding | deleterious(0) | probably_damaging(0.975) | TCGA-AJ-A3EL-01 | Endometrium | uterine corpus endometrioid carcinoma | Female | <65 | I/II | Unknown | Unknown | SD | |
| GABARAPL1 | SNV | Missense_Mutation | c.260N>T | p.Thr87Ile | p.T87I | Q9H0R8 | protein_coding | deleterious(0.01) | benign(0.1) | TCGA-AP-A059-01 | Endometrium | uterine corpus endometrioid carcinoma | Female | >=65 | I/II | Unknown | Unknown | SD | |
| GABARAPL1 | SNV | Missense_Mutation | c.329N>A | p.Ser110Asn | p.S110N | Q9H0R8 | protein_coding | deleterious(0.02) | probably_damaging(0.919) | TCGA-AP-A059-01 | Endometrium | uterine corpus endometrioid carcinoma | Female | >=65 | I/II | Unknown | Unknown | SD | |
| GABARAPL1 | SNV | Missense_Mutation | c.313C>A | p.Leu105Met | p.L105M | Q9H0R8 | protein_coding | deleterious(0.03) | probably_damaging(0.999) | TCGA-AP-A1E0-01 | Endometrium | uterine corpus endometrioid carcinoma | Female | <65 | III/IV | Chemotherapy | paclitaxel | SD | |
| GABARAPL1 | SNV | Missense_Mutation | rs370731162 | c.200N>T | p.Arg67Ile | p.R67I | Q9H0R8 | protein_coding | deleterious(0) | probably_damaging(0.938) | TCGA-AX-A05Z-01 | Endometrium | uterine corpus endometrioid carcinoma | Female | <65 | III/IV | Chemotherapy | adriamycin | SD |
| Page: 1 2 |
Top |
Related drugs of malignant transformation related genes |
| Identification of chemicals and drugs interact with genes involved in malignant transfromation |
| (DGIdb 4.0) |
| Entrez ID | Symbol | Category | Interaction Types | Drug Claim Name | Drug Name | PMIDs |
| Page: 1 |

Copyright 2023-Present -The University of Texas Health Science Center at Houston |