
|
|||||
|
 | |
| |
| |
| |
| |
| |
|
Gene: GAA |
Gene summary for GAA |
| Gene information | Species | Human | Gene symbol | GAA | Gene ID | 2548 |
| Gene name | alpha glucosidase | |
| Gene Alias | LYAG | |
| Cytomap | 17q25.3 | |
| Gene Type | protein-coding | GO ID | GO:0000023 | UniProtAcc | P10253 |
Top |
Malignant transformation analysis |
| Identification of the aberrant gene expression in precancerous and cancerous lesions by comparing the gene expression of stem-like cells in diseased tissues with normal stem cells |
| Entrez ID | Symbol | Replicates | Species | Organ | Tissue | Adj P-value | Log2FC | Malignancy |
| 2548 | GAA | LZE2T | Human | Esophagus | ESCC | 1.83e-02 | 2.96e-01 | 0.082 |
| 2548 | GAA | LZE4T | Human | Esophagus | ESCC | 1.66e-14 | 4.27e-01 | 0.0811 |
| 2548 | GAA | LZE5T | Human | Esophagus | ESCC | 4.61e-04 | 1.89e-01 | 0.0514 |
| 2548 | GAA | LZE7T | Human | Esophagus | ESCC | 2.73e-04 | 3.27e-01 | 0.0667 |
| 2548 | GAA | LZE8T | Human | Esophagus | ESCC | 3.78e-11 | 3.33e-01 | 0.067 |
| 2548 | GAA | LZE20T | Human | Esophagus | ESCC | 1.22e-07 | 2.12e-01 | 0.0662 |
| 2548 | GAA | LZE21D1 | Human | Esophagus | HGIN | 9.44e-04 | 2.11e-01 | 0.0632 |
| 2548 | GAA | LZE22T | Human | Esophagus | ESCC | 6.78e-03 | 4.19e-01 | 0.068 |
| 2548 | GAA | LZE24T | Human | Esophagus | ESCC | 2.88e-39 | 1.19e+00 | 0.0596 |
| 2548 | GAA | LZE21T | Human | Esophagus | ESCC | 1.97e-09 | 7.35e-01 | 0.0655 |
| 2548 | GAA | LZE6T | Human | Esophagus | ESCC | 1.50e-02 | 3.45e-01 | 0.0845 |
| 2548 | GAA | P1T-E | Human | Esophagus | ESCC | 4.55e-11 | 4.94e-01 | 0.0875 |
| 2548 | GAA | P2T-E | Human | Esophagus | ESCC | 2.45e-24 | 3.98e-01 | 0.1177 |
| 2548 | GAA | P4T-E | Human | Esophagus | ESCC | 1.63e-14 | 2.32e-01 | 0.1323 |
| 2548 | GAA | P5T-E | Human | Esophagus | ESCC | 3.44e-03 | 2.03e-02 | 0.1327 |
| 2548 | GAA | P8T-E | Human | Esophagus | ESCC | 1.62e-40 | 8.03e-01 | 0.0889 |
| 2548 | GAA | P9T-E | Human | Esophagus | ESCC | 1.11e-20 | 3.91e-01 | 0.1131 |
| 2548 | GAA | P10T-E | Human | Esophagus | ESCC | 2.68e-19 | 3.59e-01 | 0.116 |
| 2548 | GAA | P11T-E | Human | Esophagus | ESCC | 2.08e-32 | 1.73e+00 | 0.1426 |
| 2548 | GAA | P12T-E | Human | Esophagus | ESCC | 1.06e-50 | 1.15e+00 | 0.1122 |
| Page: 1 2 3 4 5 6 7 |
| Tissue | Expression Dynamics | Abbreviation |
| Esophagus | 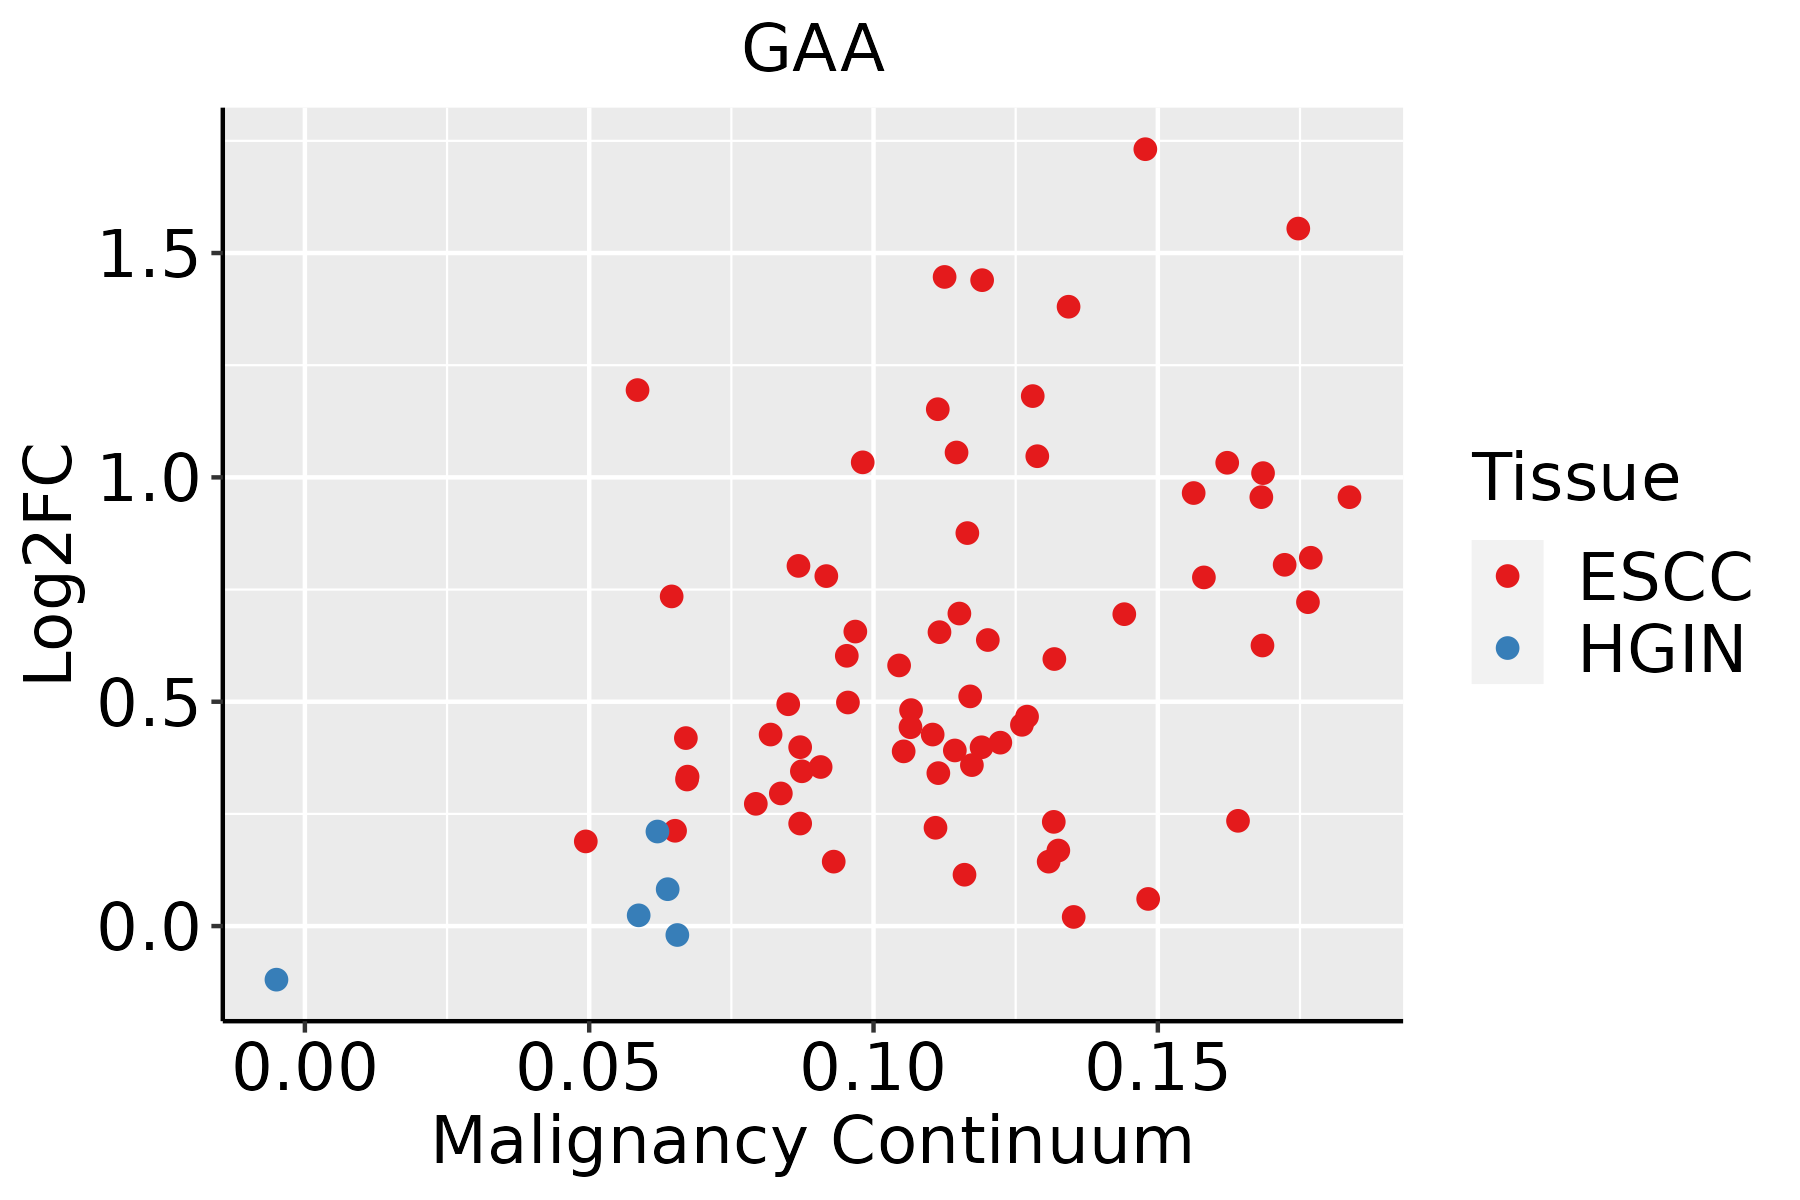 | ESCC: Esophageal squamous cell carcinoma |
| HGIN: High-grade intraepithelial neoplasias | ||
| LGIN: Low-grade intraepithelial neoplasias | ||
| Liver |  | HCC: Hepatocellular carcinoma |
| NAFLD: Non-alcoholic fatty liver disease | ||
| Oral Cavity | 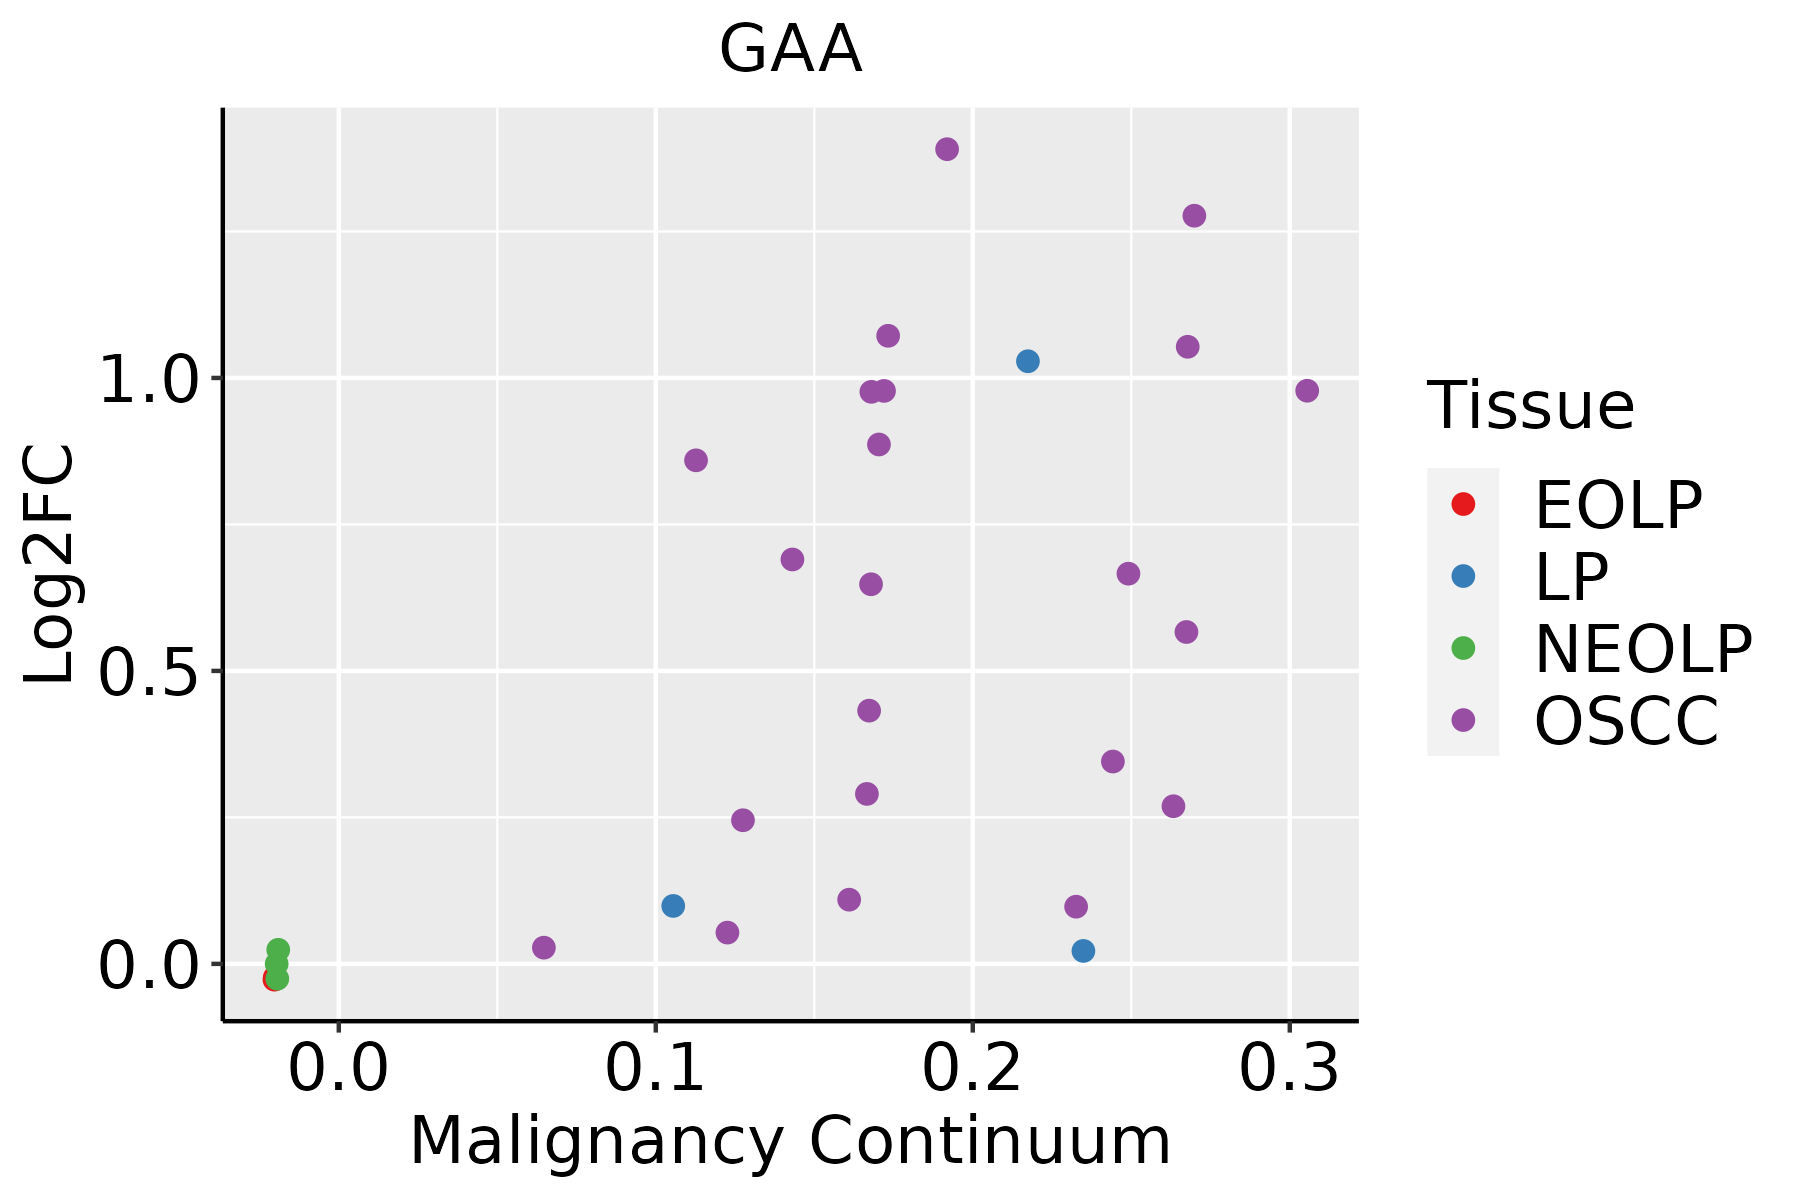 | EOLP: Erosive Oral lichen planus |
| LP: leukoplakia | ||
| NEOLP: Non-erosive oral lichen planus | ||
| OSCC: Oral squamous cell carcinoma | ||
| Prostate | 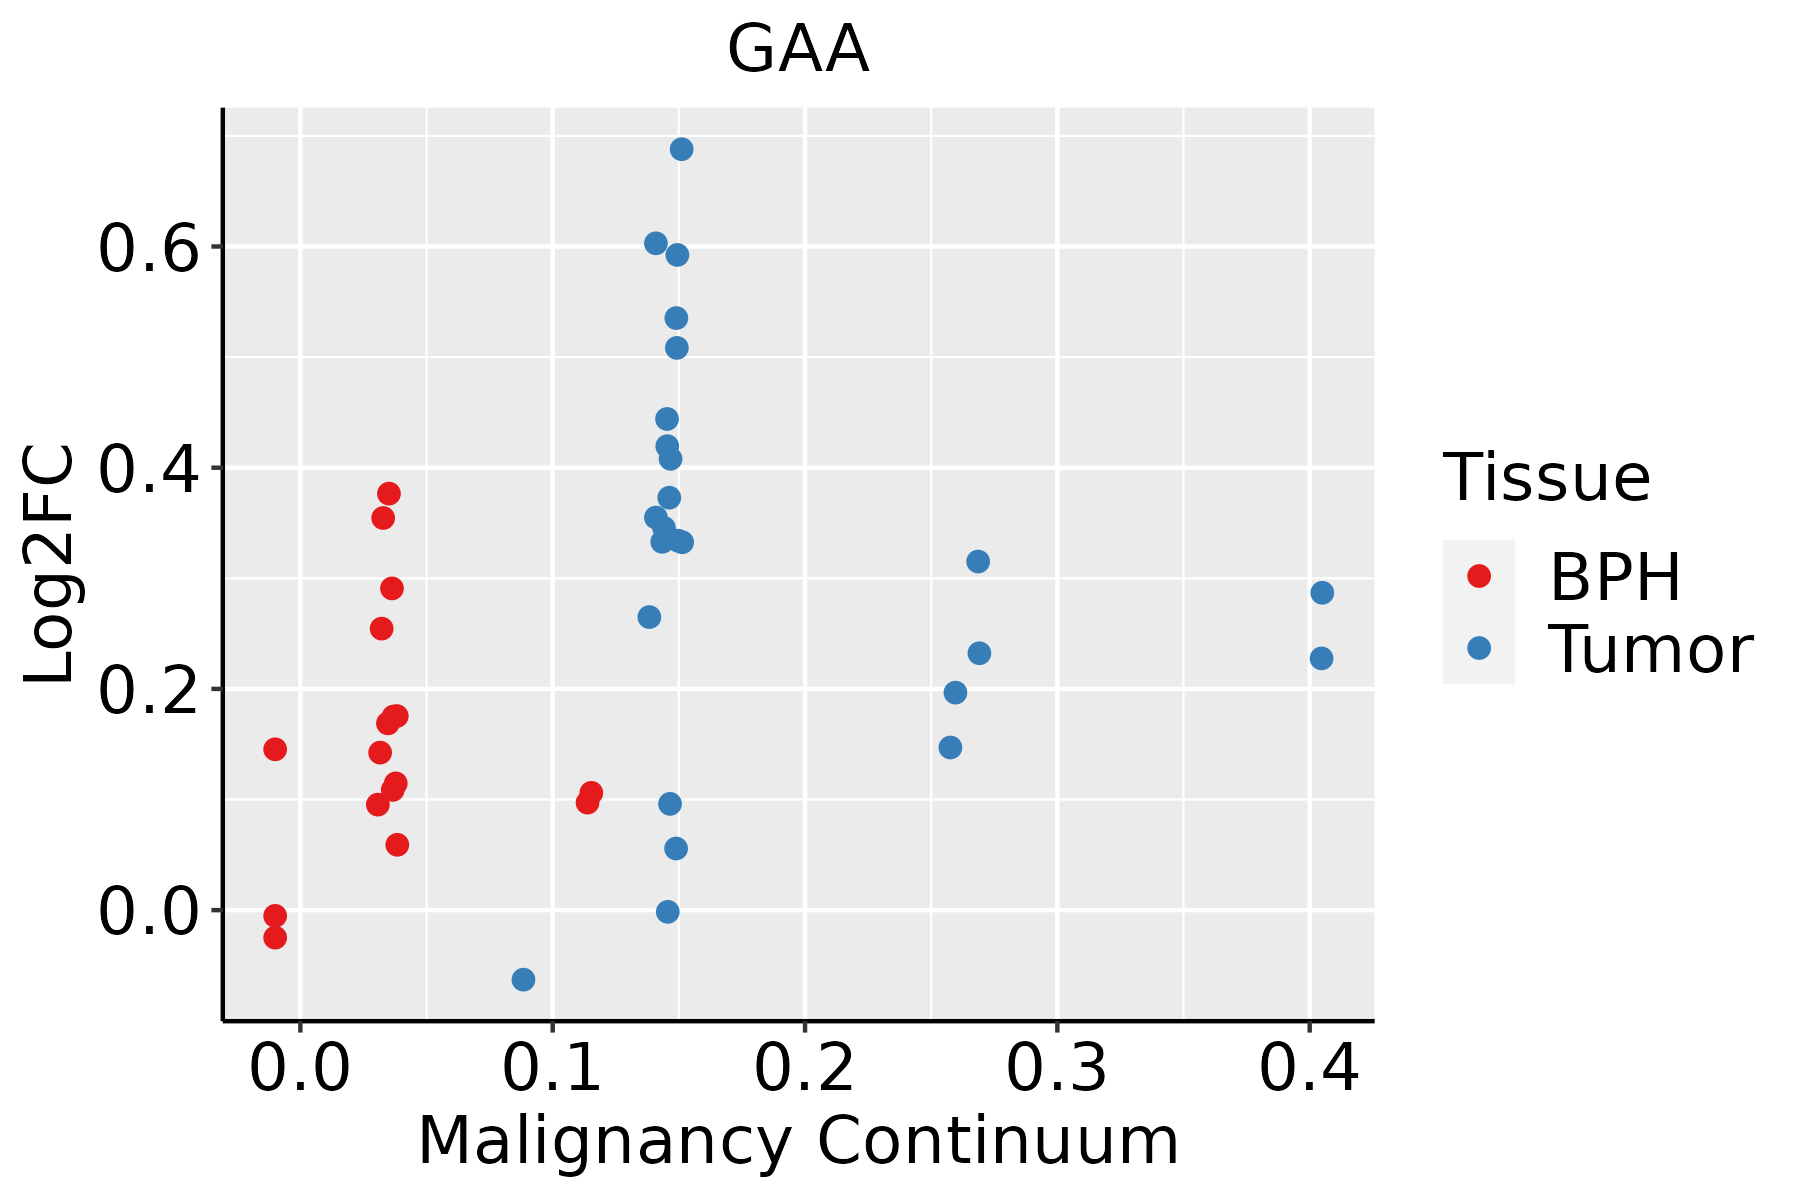 | BPH: Benign Prostatic Hyperplasia |
| Thyroid |  | ATC: Anaplastic thyroid cancer |
| HT: Hashimoto's thyroiditis | ||
| PTC: Papillary thyroid cancer |
| ∗log2FC in expression of this searched gene in stem-like cells from each diseased tissue sample relative to stem-like cells in normal samples in each tissue plotted against the malignancy continuum. Samples are colored based on if they are from different disease stage. |
Top |
Malignant transformation related pathway analysis |
| Find out the enriched GO biological processes and KEGG pathways involved in transition from healthy to precancer to cancer |
| Tissue | Disease Stage | Enriched GO biological Processes |
| Colorectum | AD |  |
| Colorectum | SER |  |
| Colorectum | MSS |  |
| Colorectum | MSI-H |  |
| Colorectum | FAP |  |
| ∗Top 15 enriched GO BP terms are showed in the bar plot of each disease state in each tissue. Each row represents a significant GO biological process which is colored according to the -log10(p.adjust). |
| Page: 1 2 3 4 5 6 7 8 9 |
| GO ID | Tissue | Disease Stage | Description | Gene Ratio | Bg Ratio | pvalue | p.adjust | Count |
| GO:000609120 | Esophagus | HGIN | generation of precursor metabolites and energy | 145/2587 | 490/18723 | 3.41e-20 | 2.04e-17 | 145 |
| GO:001598020 | Esophagus | HGIN | energy derivation by oxidation of organic compounds | 105/2587 | 318/18723 | 1.16e-18 | 4.99e-16 | 105 |
| GO:005165126 | Esophagus | HGIN | maintenance of location in cell | 53/2587 | 214/18723 | 1.22e-05 | 3.45e-04 | 53 |
| GO:005123520 | Esophagus | HGIN | maintenance of location | 73/2587 | 327/18723 | 1.73e-05 | 4.71e-04 | 73 |
| GO:00070336 | Esophagus | HGIN | vacuole organization | 44/2587 | 180/18723 | 8.97e-05 | 1.96e-03 | 44 |
| GO:0006091110 | Esophagus | ESCC | generation of precursor metabolites and energy | 331/8552 | 490/18723 | 3.86e-23 | 8.45e-21 | 331 |
| GO:0015980110 | Esophagus | ESCC | energy derivation by oxidation of organic compounds | 220/8552 | 318/18723 | 1.20e-17 | 1.09e-15 | 220 |
| GO:000703314 | Esophagus | ESCC | vacuole organization | 127/8552 | 180/18723 | 1.04e-11 | 3.85e-10 | 127 |
| GO:0051235110 | Esophagus | ESCC | maintenance of location | 200/8552 | 327/18723 | 1.01e-08 | 2.02e-07 | 200 |
| GO:00059969 | Esophagus | ESCC | monosaccharide metabolic process | 159/8552 | 257/18723 | 1.11e-07 | 1.81e-06 | 159 |
| GO:00193189 | Esophagus | ESCC | hexose metabolic process | 147/8552 | 237/18723 | 2.63e-07 | 3.94e-06 | 147 |
| GO:00070403 | Esophagus | ESCC | lysosome organization | 53/8552 | 74/18723 | 5.34e-06 | 5.57e-05 | 53 |
| GO:00801713 | Esophagus | ESCC | lytic vacuole organization | 53/8552 | 74/18723 | 5.34e-06 | 5.57e-05 | 53 |
| GO:00060069 | Esophagus | ESCC | glucose metabolic process | 119/8552 | 196/18723 | 1.51e-05 | 1.36e-04 | 119 |
| GO:0051651111 | Esophagus | ESCC | maintenance of location in cell | 126/8552 | 214/18723 | 6.57e-05 | 5.00e-04 | 126 |
| GO:00442626 | Esophagus | ESCC | cellular carbohydrate metabolic process | 160/8552 | 283/18723 | 1.43e-04 | 9.66e-04 | 160 |
| GO:001605216 | Esophagus | ESCC | carbohydrate catabolic process | 91/8552 | 154/18723 | 5.39e-04 | 2.97e-03 | 91 |
| GO:00442751 | Esophagus | ESCC | cellular carbohydrate catabolic process | 27/8552 | 40/18723 | 4.39e-03 | 1.73e-02 | 27 |
| GO:000609112 | Liver | Cirrhotic | generation of precursor metabolites and energy | 238/4634 | 490/18723 | 6.85e-31 | 1.07e-27 | 238 |
| GO:001598012 | Liver | Cirrhotic | energy derivation by oxidation of organic compounds | 154/4634 | 318/18723 | 3.11e-20 | 8.87e-18 | 154 |
| Page: 1 2 3 4 5 6 7 |
| Pathway ID | Tissue | Disease Stage | Description | Gene Ratio | Bg Ratio | pvalue | p.adjust | qvalue | Count |
| hsa041426 | Esophagus | HGIN | Lysosome | 33/1383 | 132/8465 | 6.65e-03 | 4.37e-02 | 3.47e-02 | 33 |
| hsa0414213 | Esophagus | HGIN | Lysosome | 33/1383 | 132/8465 | 6.65e-03 | 4.37e-02 | 3.47e-02 | 33 |
| hsa0414222 | Esophagus | ESCC | Lysosome | 102/4205 | 132/8465 | 5.11e-11 | 7.13e-10 | 3.65e-10 | 102 |
| hsa0414232 | Esophagus | ESCC | Lysosome | 102/4205 | 132/8465 | 5.11e-11 | 7.13e-10 | 3.65e-10 | 102 |
| hsa041424 | Liver | Cirrhotic | Lysosome | 68/2530 | 132/8465 | 1.34e-07 | 1.97e-06 | 1.21e-06 | 68 |
| hsa0414211 | Liver | Cirrhotic | Lysosome | 68/2530 | 132/8465 | 1.34e-07 | 1.97e-06 | 1.21e-06 | 68 |
| hsa041422 | Liver | HCC | Lysosome | 100/4020 | 132/8465 | 2.32e-11 | 4.31e-10 | 2.40e-10 | 100 |
| hsa041423 | Liver | HCC | Lysosome | 100/4020 | 132/8465 | 2.32e-11 | 4.31e-10 | 2.40e-10 | 100 |
| hsa041425 | Oral cavity | OSCC | Lysosome | 87/3704 | 132/8465 | 1.97e-07 | 1.35e-06 | 6.86e-07 | 87 |
| hsa0414212 | Oral cavity | OSCC | Lysosome | 87/3704 | 132/8465 | 1.97e-07 | 1.35e-06 | 6.86e-07 | 87 |
| hsa0414221 | Oral cavity | LP | Lysosome | 67/2418 | 132/8465 | 5.13e-08 | 7.77e-07 | 5.01e-07 | 67 |
| hsa0414231 | Oral cavity | LP | Lysosome | 67/2418 | 132/8465 | 5.13e-08 | 7.77e-07 | 5.01e-07 | 67 |
| Page: 1 |
Top |
Cell-cell communication analysis |
| Identification of potential cell-cell interactions between two cell types and their ligand-receptor pairs for different disease states |
| Ligand | Receptor | LRpair | Pathway | Tissue | Disease Stage |
| Page: 1 |
Top |
Single-cell gene regulatory network inference analysis |
| Find out the significant the regulons (TFs) and the target genes of each regulon across cell types for different disease states |
| TF | Cell Type | Tissue | Disease Stage | Target Gene | RSS | Regulon Activity |
| ∗The dot plots of a searched regulon are shown for all cell subpopulations in each disease state of each tissue based on the regulon specific score inferred using pySCENIC and by calculating the average expression. |
| Page: 1 |
Top |
Somatic mutation of malignant transformation related genes |
| Annotation of somatic variants for genes involved in malignant transformation |
| Hugo Symbol | Variant Class | Variant Classification | dbSNP RS | HGVSc | HGVSp | HGVSp Short | SWISSPROT | BIOTYPE | SIFT | PolyPhen | Tumor Sample Barcode | Tissue | Histology | Sex | Age | Stage | Therapy Types | Drugs | Outcome |
| GAA | SNV | Missense_Mutation | novel | c.2233N>A | p.Leu745Met | p.L745M | P10253 | protein_coding | tolerated(0.22) | possibly_damaging(0.785) | TCGA-AN-A046-01 | Breast | breast invasive carcinoma | Female | >=65 | I/II | Unknown | Unknown | SD |
| GAA | SNV | Missense_Mutation | novel | c.2728N>A | p.Ala910Thr | p.A910T | P10253 | protein_coding | tolerated(0.77) | benign(0) | TCGA-BH-A0HF-01 | Breast | breast invasive carcinoma | Female | >=65 | I/II | Hormone Therapy | arimidex | SD |
| GAA | SNV | Missense_Mutation | novel | c.826N>T | p.Ile276Phe | p.I276F | P10253 | protein_coding | tolerated(0.54) | benign(0.006) | TCGA-BH-A18G-01 | Breast | breast invasive carcinoma | Female | >=65 | I/II | Unknown | Unknown | SD |
| GAA | SNV | Missense_Mutation | c.1483N>A | p.Ala495Thr | p.A495T | P10253 | protein_coding | tolerated(1) | benign(0.014) | TCGA-BH-A18G-01 | Breast | breast invasive carcinoma | Female | >=65 | I/II | Unknown | Unknown | SD | |
| GAA | SNV | Missense_Mutation | rs374569672 | c.664N>A | p.Val222Met | p.V222M | P10253 | protein_coding | deleterious(0.02) | possibly_damaging(0.771) | TCGA-E2-A15J-01 | Breast | breast invasive carcinoma | Female | <65 | I/II | Chemotherapy | docetaxel | SD |
| GAA | deletion | Frame_Shift_Del | novel | c.1664delN | p.Thr556ProfsTer22 | p.T556Pfs*22 | P10253 | protein_coding | TCGA-D8-A27V-01 | Breast | breast invasive carcinoma | Female | <65 | I/II | Hormone Therapy | tamoxiphen | SD | ||
| GAA | deletion | Frame_Shift_Del | novel | c.348delG | p.Leu117CysfsTer25 | p.L117Cfs*25 | P10253 | protein_coding | TCGA-EW-A1IZ-01 | Breast | breast invasive carcinoma | Female | <65 | III/IV | Chemotherapy | taxotere | SD | ||
| GAA | SNV | Missense_Mutation | rs762439362 | c.532N>T | p.Arg178Cys | p.R178C | P10253 | protein_coding | tolerated(0.12) | benign(0.247) | TCGA-EK-A2PG-01 | Cervix | cervical & endocervical cancer | Female | >=65 | I/II | Unknown | Unknown | SD |
| GAA | SNV | Missense_Mutation | c.1961C>T | p.Ser654Leu | p.S654L | P10253 | protein_coding | deleterious(0) | benign(0.41) | TCGA-JX-A3Q0-01 | Cervix | cervical & endocervical cancer | Female | <65 | III/IV | Unknown | Unknown | SD | |
| GAA | SNV | Missense_Mutation | c.1173G>A | p.Met391Ile | p.M391I | P10253 | protein_coding | deleterious(0.01) | probably_damaging(0.925) | TCGA-MU-A5YI-01 | Cervix | cervical & endocervical cancer | Female | <65 | I/II | Unknown | Unknown | PD |
| Page: 1 2 3 4 5 6 7 8 |
Top |
Related drugs of malignant transformation related genes |
| Identification of chemicals and drugs interact with genes involved in malignant transfromation |
| (DGIdb 4.0) |
| Entrez ID | Symbol | Category | Interaction Types | Drug Claim Name | Drug Name | PMIDs |
| 2548 | GAA | DRUGGABLE GENOME, ENZYME | CID 667285 | CHEMBL267160 | ||
| 2548 | GAA | DRUGGABLE GENOME, ENZYME | TCMDC-124544 | CHEMBL531322 | ||
| 2548 | GAA | DRUGGABLE GENOME, ENZYME | ISOTHYMONIN | ISOTHYMONIN | ||
| 2548 | GAA | DRUGGABLE GENOME, ENZYME | LUTEOLIN | LUTEOLIN | ||
| 2548 | GAA | DRUGGABLE GENOME, ENZYME | GNF-PF-3537 | CHEMBL601110 | ||
| 2548 | GAA | DRUGGABLE GENOME, ENZYME | 4-HYDROXYESTRADIOL | CHEMBL1412489 | ||
| 2548 | GAA | DRUGGABLE GENOME, ENZYME | ACRIDIN-1-YLAMINE | CHEMBL146525 | ||
| 2548 | GAA | DRUGGABLE GENOME, ENZYME | 4-METHYLUMBELLIFERYL ACETATE | CHEMBL12019 | ||
| 2548 | GAA | DRUGGABLE GENOME, ENZYME | 3-O-METHYLQUERCETIN | 3-O-METHYLQUERCETIN | ||
| 2548 | GAA | DRUGGABLE GENOME, ENZYME | DNDI1417523 | CHEMBL598663 |
| Page: 1 2 3 4 5 6 7 8 |

Copyright 2023-Present -The University of Texas Health Science Center at Houston |