
|
|||||
|
 | |
| |
| |
| |
| |
| |
|
Gene: G6PD |
Gene summary for G6PD |
| Gene information | Species | Human | Gene symbol | G6PD | Gene ID | 2539 |
| Gene name | glucose-6-phosphate dehydrogenase | |
| Gene Alias | G6PD1 | |
| Cytomap | Xq28 | |
| Gene Type | protein-coding | GO ID | GO:0001558 | UniProtAcc | P11413 |
Top |
Malignant transformation analysis |
| Identification of the aberrant gene expression in precancerous and cancerous lesions by comparing the gene expression of stem-like cells in diseased tissues with normal stem cells |
| Entrez ID | Symbol | Replicates | Species | Organ | Tissue | Adj P-value | Log2FC | Malignancy |
| 2539 | G6PD | LZE2D | Human | Esophagus | HGIN | 1.29e-02 | 8.37e-01 | 0.0642 |
| 2539 | G6PD | LZE2T | Human | Esophagus | ESCC | 9.02e-11 | 1.54e+00 | 0.082 |
| 2539 | G6PD | LZE4T | Human | Esophagus | ESCC | 1.65e-32 | 1.75e+00 | 0.0811 |
| 2539 | G6PD | LZE5T | Human | Esophagus | ESCC | 6.99e-03 | 2.74e-01 | 0.0514 |
| 2539 | G6PD | LZE7T | Human | Esophagus | ESCC | 2.68e-20 | 1.20e+00 | 0.0667 |
| 2539 | G6PD | LZE8T | Human | Esophagus | ESCC | 1.78e-06 | 2.88e-01 | 0.067 |
| 2539 | G6PD | LZE20T | Human | Esophagus | ESCC | 8.91e-13 | 3.39e-01 | 0.0662 |
| 2539 | G6PD | LZE22D1 | Human | Esophagus | HGIN | 3.44e-09 | 4.30e-01 | 0.0595 |
| 2539 | G6PD | LZE22T | Human | Esophagus | ESCC | 1.69e-16 | 1.39e+00 | 0.068 |
| 2539 | G6PD | LZE24T | Human | Esophagus | ESCC | 1.28e-44 | 1.70e+00 | 0.0596 |
| 2539 | G6PD | LZE21T | Human | Esophagus | ESCC | 6.18e-06 | 6.70e-01 | 0.0655 |
| 2539 | G6PD | LZE6T | Human | Esophagus | ESCC | 2.40e-06 | 4.65e-01 | 0.0845 |
| 2539 | G6PD | P1T-E | Human | Esophagus | ESCC | 5.92e-12 | 6.74e-01 | 0.0875 |
| 2539 | G6PD | P2T-E | Human | Esophagus | ESCC | 1.15e-26 | 5.29e-01 | 0.1177 |
| 2539 | G6PD | P4T-E | Human | Esophagus | ESCC | 2.04e-41 | 9.95e-01 | 0.1323 |
| 2539 | G6PD | P5T-E | Human | Esophagus | ESCC | 1.86e-21 | 3.76e-01 | 0.1327 |
| 2539 | G6PD | P8T-E | Human | Esophagus | ESCC | 8.19e-37 | 7.23e-01 | 0.0889 |
| 2539 | G6PD | P9T-E | Human | Esophagus | ESCC | 9.05e-56 | 1.84e+00 | 0.1131 |
| 2539 | G6PD | P10T-E | Human | Esophagus | ESCC | 2.20e-32 | 5.81e-01 | 0.116 |
| 2539 | G6PD | P11T-E | Human | Esophagus | ESCC | 1.95e-19 | 8.85e-01 | 0.1426 |
| Page: 1 2 3 4 5 6 7 |
| Tissue | Expression Dynamics | Abbreviation |
| Esophagus |  | ESCC: Esophageal squamous cell carcinoma |
| HGIN: High-grade intraepithelial neoplasias | ||
| LGIN: Low-grade intraepithelial neoplasias | ||
| Liver |  | HCC: Hepatocellular carcinoma |
| NAFLD: Non-alcoholic fatty liver disease | ||
| Oral Cavity |  | EOLP: Erosive Oral lichen planus |
| LP: leukoplakia | ||
| NEOLP: Non-erosive oral lichen planus | ||
| OSCC: Oral squamous cell carcinoma | ||
| Skin |  | AK: Actinic keratosis |
| cSCC: Cutaneous squamous cell carcinoma | ||
| SCCIS:squamous cell carcinoma in situ | ||
| Thyroid | 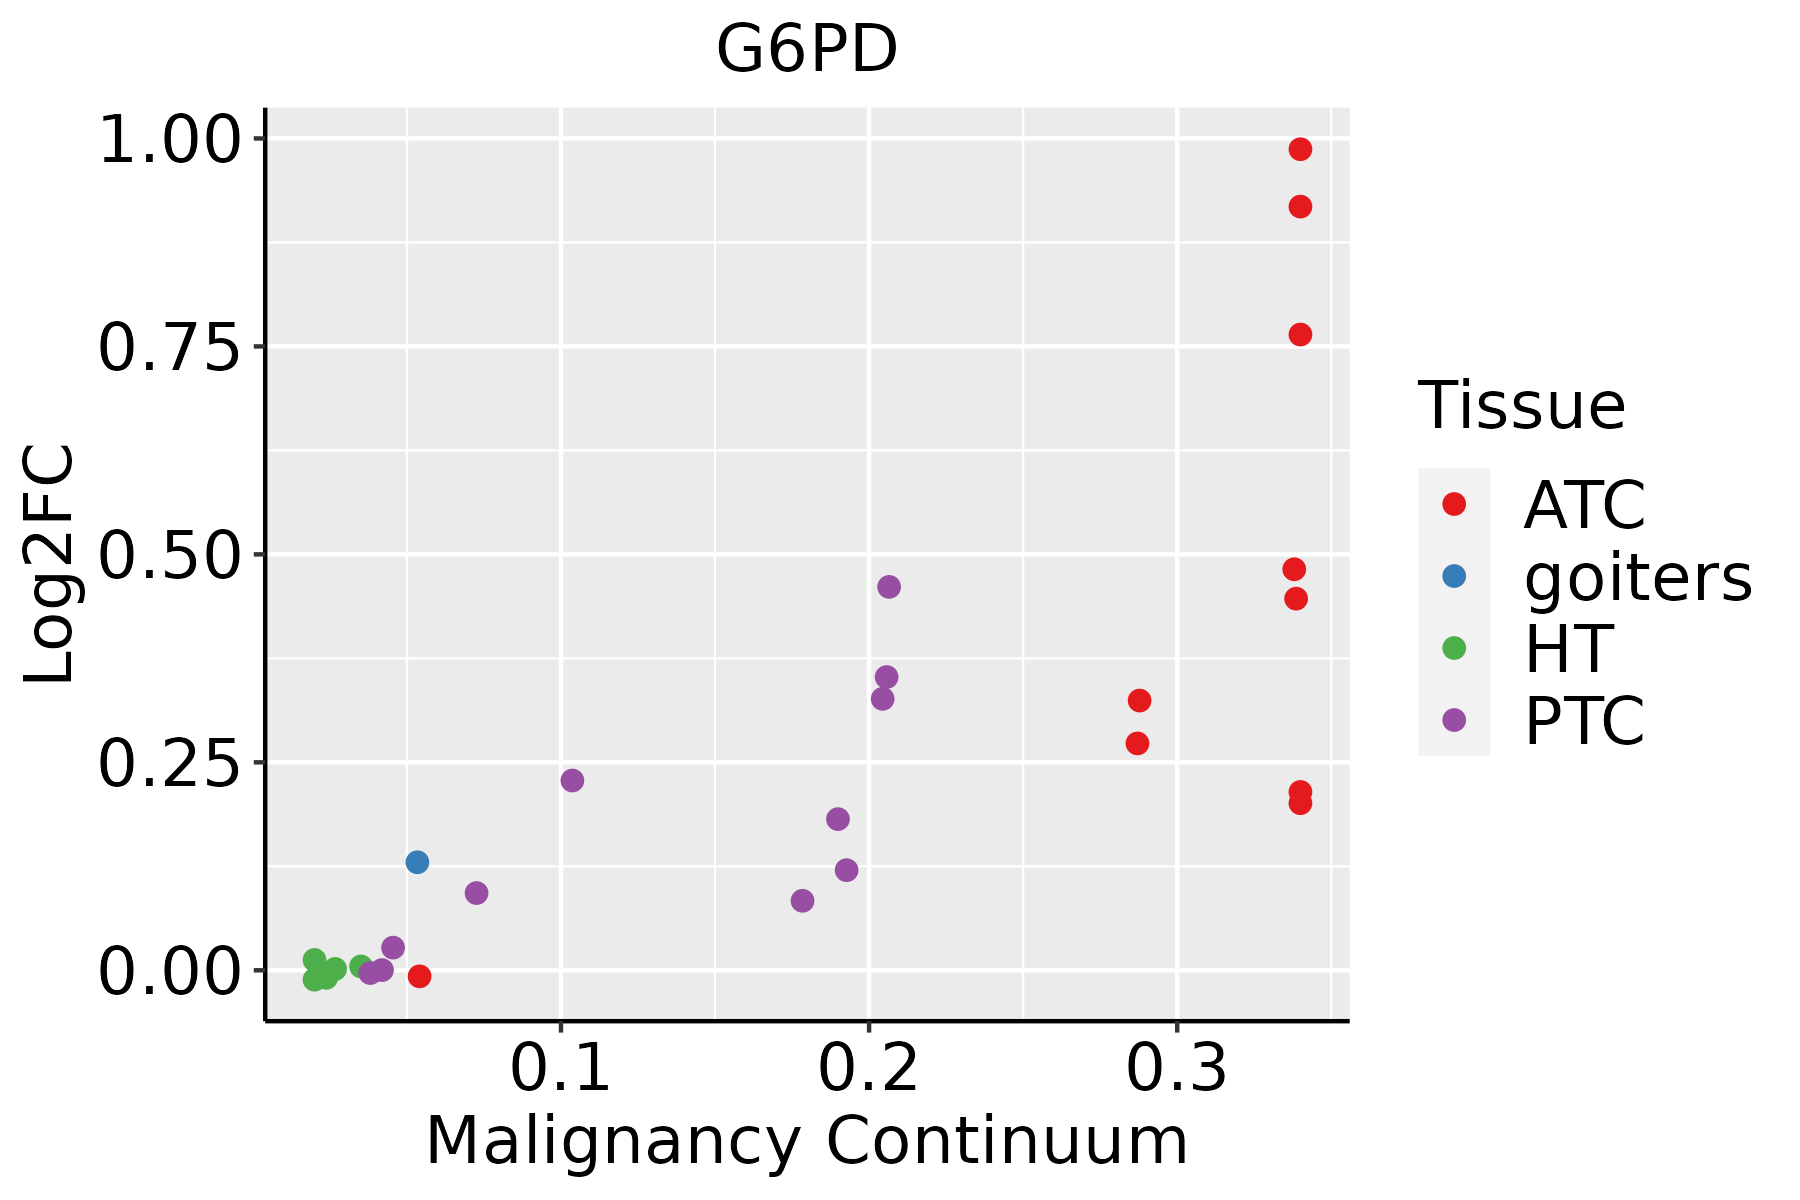 | ATC: Anaplastic thyroid cancer |
| HT: Hashimoto's thyroiditis | ||
| PTC: Papillary thyroid cancer |
| ∗log2FC in expression of this searched gene in stem-like cells from each diseased tissue sample relative to stem-like cells in normal samples in each tissue plotted against the malignancy continuum. Samples are colored based on if they are from different disease stage. |
Top |
Malignant transformation related pathway analysis |
| Find out the enriched GO biological processes and KEGG pathways involved in transition from healthy to precancer to cancer |
| Tissue | Disease Stage | Enriched GO biological Processes |
| Colorectum | AD |  |
| Colorectum | SER |  |
| Colorectum | MSS |  |
| Colorectum | MSI-H |  |
| Colorectum | FAP |  |
| ∗Top 15 enriched GO BP terms are showed in the bar plot of each disease state in each tissue. Each row represents a significant GO biological process which is colored according to the -log10(p.adjust). |
| Page: 1 2 3 4 5 6 7 8 9 |
| GO ID | Tissue | Disease Stage | Description | Gene Ratio | Bg Ratio | pvalue | p.adjust | Count |
| GO:000609120 | Esophagus | HGIN | generation of precursor metabolites and energy | 145/2587 | 490/18723 | 3.41e-20 | 2.04e-17 | 145 |
| GO:000697927 | Esophagus | HGIN | response to oxidative stress | 107/2587 | 446/18723 | 3.91e-09 | 2.76e-07 | 107 |
| GO:007099727 | Esophagus | HGIN | neuron death | 81/2587 | 361/18723 | 5.01e-06 | 1.61e-04 | 81 |
| GO:006219727 | Esophagus | HGIN | cellular response to chemical stress | 76/2587 | 337/18723 | 8.00e-06 | 2.41e-04 | 76 |
| GO:003009927 | Esophagus | HGIN | myeloid cell differentiation | 83/2587 | 381/18723 | 1.26e-05 | 3.52e-04 | 83 |
| GO:003459926 | Esophagus | HGIN | cellular response to oxidative stress | 65/2587 | 288/18723 | 3.42e-05 | 8.66e-04 | 65 |
| GO:004639019 | Esophagus | HGIN | ribose phosphate biosynthetic process | 46/2587 | 190/18723 | 8.06e-05 | 1.79e-03 | 46 |
| GO:003410127 | Esophagus | HGIN | erythrocyte homeostasis | 34/2587 | 129/18723 | 1.16e-04 | 2.43e-03 | 34 |
| GO:190121424 | Esophagus | HGIN | regulation of neuron death | 68/2587 | 319/18723 | 1.46e-04 | 2.91e-03 | 68 |
| GO:00067497 | Esophagus | HGIN | glutathione metabolic process | 20/2587 | 64/18723 | 2.63e-04 | 4.58e-03 | 20 |
| GO:003021826 | Esophagus | HGIN | erythrocyte differentiation | 31/2587 | 120/18723 | 3.35e-04 | 5.50e-03 | 31 |
| GO:001604919 | Esophagus | HGIN | cell growth | 93/2587 | 482/18723 | 4.49e-04 | 6.62e-03 | 93 |
| GO:009730520 | Esophagus | HGIN | response to alcohol | 54/2587 | 253/18723 | 6.46e-04 | 8.87e-03 | 54 |
| GO:000226227 | Esophagus | HGIN | myeloid cell homeostasis | 37/2587 | 157/18723 | 6.63e-04 | 9.04e-03 | 37 |
| GO:005140219 | Esophagus | HGIN | neuron apoptotic process | 52/2587 | 246/18723 | 1.01e-03 | 1.26e-02 | 52 |
| GO:003166726 | Esophagus | HGIN | response to nutrient levels | 89/2587 | 474/18723 | 1.41e-03 | 1.64e-02 | 89 |
| GO:002176220 | Esophagus | HGIN | substantia nigra development | 14/2587 | 44/18723 | 1.75e-03 | 1.90e-02 | 14 |
| GO:00060983 | Esophagus | HGIN | pentose-phosphate shunt | 7/2587 | 15/18723 | 2.22e-03 | 2.28e-02 | 7 |
| GO:001969320 | Esophagus | HGIN | ribose phosphate metabolic process | 75/2587 | 396/18723 | 2.53e-03 | 2.51e-02 | 75 |
| GO:00605379 | Esophagus | HGIN | muscle tissue development | 76/2587 | 403/18723 | 2.67e-03 | 2.63e-02 | 76 |
| Page: 1 2 3 4 5 6 7 8 9 10 11 12 13 14 15 16 17 18 19 20 |
| Pathway ID | Tissue | Disease Stage | Description | Gene Ratio | Bg Ratio | pvalue | p.adjust | qvalue | Count |
| hsa0541530 | Esophagus | HGIN | Diabetic cardiomyopathy | 80/1383 | 203/8465 | 1.35e-15 | 3.38e-14 | 2.69e-14 | 80 |
| hsa0120016 | Esophagus | HGIN | Carbon metabolism | 31/1383 | 115/8465 | 2.51e-03 | 2.10e-02 | 1.67e-02 | 31 |
| hsa05415114 | Esophagus | HGIN | Diabetic cardiomyopathy | 80/1383 | 203/8465 | 1.35e-15 | 3.38e-14 | 2.69e-14 | 80 |
| hsa0120017 | Esophagus | HGIN | Carbon metabolism | 31/1383 | 115/8465 | 2.51e-03 | 2.10e-02 | 1.67e-02 | 31 |
| hsa05415211 | Esophagus | ESCC | Diabetic cardiomyopathy | 146/4205 | 203/8465 | 5.81e-11 | 7.78e-10 | 3.99e-10 | 146 |
| hsa0120023 | Esophagus | ESCC | Carbon metabolism | 79/4205 | 115/8465 | 2.50e-05 | 1.21e-04 | 6.22e-05 | 79 |
| hsa0523018 | Esophagus | ESCC | Central carbon metabolism in cancer | 50/4205 | 70/8465 | 1.70e-04 | 6.62e-04 | 3.39e-04 | 50 |
| hsa0541538 | Esophagus | ESCC | Diabetic cardiomyopathy | 146/4205 | 203/8465 | 5.81e-11 | 7.78e-10 | 3.99e-10 | 146 |
| hsa0120033 | Esophagus | ESCC | Carbon metabolism | 79/4205 | 115/8465 | 2.50e-05 | 1.21e-04 | 6.22e-05 | 79 |
| hsa0523019 | Esophagus | ESCC | Central carbon metabolism in cancer | 50/4205 | 70/8465 | 1.70e-04 | 6.62e-04 | 3.39e-04 | 50 |
| hsa0541514 | Liver | Cirrhotic | Diabetic cardiomyopathy | 108/2530 | 203/8465 | 1.99e-12 | 4.41e-11 | 2.72e-11 | 108 |
| hsa0120021 | Liver | Cirrhotic | Carbon metabolism | 64/2530 | 115/8465 | 6.37e-09 | 1.18e-07 | 7.26e-08 | 64 |
| hsa004809 | Liver | Cirrhotic | Glutathione metabolism | 30/2530 | 57/8465 | 2.63e-04 | 1.72e-03 | 1.06e-03 | 30 |
| hsa00030 | Liver | Cirrhotic | Pentose phosphate pathway | 16/2530 | 30/8465 | 6.04e-03 | 2.12e-02 | 1.30e-02 | 16 |
| hsa052308 | Liver | Cirrhotic | Central carbon metabolism in cancer | 30/2530 | 70/8465 | 1.41e-02 | 4.35e-02 | 2.68e-02 | 30 |
| hsa0541515 | Liver | Cirrhotic | Diabetic cardiomyopathy | 108/2530 | 203/8465 | 1.99e-12 | 4.41e-11 | 2.72e-11 | 108 |
| hsa0120031 | Liver | Cirrhotic | Carbon metabolism | 64/2530 | 115/8465 | 6.37e-09 | 1.18e-07 | 7.26e-08 | 64 |
| hsa0048012 | Liver | Cirrhotic | Glutathione metabolism | 30/2530 | 57/8465 | 2.63e-04 | 1.72e-03 | 1.06e-03 | 30 |
| hsa000301 | Liver | Cirrhotic | Pentose phosphate pathway | 16/2530 | 30/8465 | 6.04e-03 | 2.12e-02 | 1.30e-02 | 16 |
| hsa0523011 | Liver | Cirrhotic | Central carbon metabolism in cancer | 30/2530 | 70/8465 | 1.41e-02 | 4.35e-02 | 2.68e-02 | 30 |
| Page: 1 2 3 |
Top |
Cell-cell communication analysis |
| Identification of potential cell-cell interactions between two cell types and their ligand-receptor pairs for different disease states |
| Ligand | Receptor | LRpair | Pathway | Tissue | Disease Stage |
| Page: 1 |
Top |
Single-cell gene regulatory network inference analysis |
| Find out the significant the regulons (TFs) and the target genes of each regulon across cell types for different disease states |
| TF | Cell Type | Tissue | Disease Stage | Target Gene | RSS | Regulon Activity |
| ∗The dot plots of a searched regulon are shown for all cell subpopulations in each disease state of each tissue based on the regulon specific score inferred using pySCENIC and by calculating the average expression. |
| Page: 1 |
Top |
Somatic mutation of malignant transformation related genes |
| Annotation of somatic variants for genes involved in malignant transformation |
| Hugo Symbol | Variant Class | Variant Classification | dbSNP RS | HGVSc | HGVSp | HGVSp Short | SWISSPROT | BIOTYPE | SIFT | PolyPhen | Tumor Sample Barcode | Tissue | Histology | Sex | Age | Stage | Therapy Types | Drugs | Outcome |
| G6PD | SNV | Missense_Mutation | rs782690505 | c.865N>A | p.Val289Met | p.V289M | P11413 | protein_coding | deleterious(0) | probably_damaging(0.997) | TCGA-B6-A0IB-01 | Breast | breast invasive carcinoma | Female | <65 | III/IV | Unknown | Unknown | PD |
| G6PD | SNV | Missense_Mutation | rs137852345 | c.1172N>T | p.Ala391Val | p.A391V | P11413 | protein_coding | deleterious(0) | probably_damaging(0.986) | TCGA-D8-A1J8-01 | Breast | breast invasive carcinoma | Female | >=65 | I/II | Hormone Therapy | nolvadex | SD |
| G6PD | SNV | Missense_Mutation | novel | c.278A>C | p.Glu93Ala | p.E93A | P11413 | protein_coding | tolerated(0.24) | benign(0.007) | TCGA-OL-A66P-01 | Breast | breast invasive carcinoma | Female | >=65 | I/II | Chemotherapy | cytoxan | CR |
| G6PD | SNV | Missense_Mutation | rs398123546 | c.1450N>T | p.Arg484Cys | p.R484C | P11413 | protein_coding | deleterious(0) | probably_damaging(0.997) | TCGA-2W-A8YY-01 | Cervix | cervical & endocervical cancer | Female | <65 | I/II | Chemotherapy | cisplatin | CR |
| G6PD | SNV | Missense_Mutation | rs387906470 | c.1159N>T | p.Arg387Cys | p.R387C | P11413 | protein_coding | deleterious(0) | probably_damaging(0.994) | TCGA-2W-A8YY-01 | Cervix | cervical & endocervical cancer | Female | <65 | I/II | Chemotherapy | cisplatin | CR |
| G6PD | SNV | Missense_Mutation | novel | c.179N>G | p.Asp60Gly | p.D60G | P11413 | protein_coding | tolerated(0.12) | benign(0.056) | TCGA-2W-A8YY-01 | Cervix | cervical & endocervical cancer | Female | <65 | I/II | Chemotherapy | cisplatin | CR |
| G6PD | SNV | Missense_Mutation | novel | c.1405N>T | p.Arg469Cys | p.R469C | P11413 | protein_coding | deleterious(0) | probably_damaging(0.994) | TCGA-EA-A3HS-01 | Cervix | cervical & endocervical cancer | Female | <65 | I/II | Unknown | Unknown | SD |
| G6PD | SNV | Missense_Mutation | rs782372471 | c.400N>T | p.Arg134Cys | p.R134C | P11413 | protein_coding | tolerated(0.15) | benign(0.025) | TCGA-Q1-A73R-01 | Cervix | cervical & endocervical cancer | Female | <65 | I/II | Unknown | Unknown | SD |
| G6PD | SNV | Missense_Mutation | c.781N>A | p.Ala261Thr | p.A261T | P11413 | protein_coding | tolerated(0.06) | possibly_damaging(0.735) | TCGA-AA-3968-01 | Colorectum | colon adenocarcinoma | Female | <65 | I/II | Unknown | Unknown | SD | |
| G6PD | SNV | Missense_Mutation | c.940G>A | p.Val314Ile | p.V314I | P11413 | protein_coding | tolerated(1) | benign(0.006) | TCGA-CK-4947-01 | Colorectum | colon adenocarcinoma | Female | <65 | III/IV | Other, specify in notes | folinic | SD |
| Page: 1 2 3 4 5 6 |
Top |
Related drugs of malignant transformation related genes |
| Identification of chemicals and drugs interact with genes involved in malignant transfromation |
| (DGIdb 4.0) |
| Entrez ID | Symbol | Category | Interaction Types | Drug Claim Name | Drug Name | PMIDs |
| 2539 | G6PD | DRUGGABLE GENOME, ENZYME, CLINICALLY ACTIONABLE | Sulfamethoxazole | SULFAMETHOXAZOLE | ||
| 2539 | G6PD | DRUGGABLE GENOME, ENZYME, CLINICALLY ACTIONABLE | acetaminophen / tramadol | |||
| 2539 | G6PD | DRUGGABLE GENOME, ENZYME, CLINICALLY ACTIONABLE | PROGESTOGENS | 7450248 | ||
| 2539 | G6PD | DRUGGABLE GENOME, ENZYME, CLINICALLY ACTIONABLE | acetaminophen / codeine | |||
| 2539 | G6PD | DRUGGABLE GENOME, ENZYME, CLINICALLY ACTIONABLE | Sodium Ascorbate | |||
| 2539 | G6PD | DRUGGABLE GENOME, ENZYME, CLINICALLY ACTIONABLE | Nalidixic Acid | |||
| 2539 | G6PD | DRUGGABLE GENOME, ENZYME, CLINICALLY ACTIONABLE | prilocaine | PRILOCAINE | ||
| 2539 | G6PD | DRUGGABLE GENOME, ENZYME, CLINICALLY ACTIONABLE | dabrafenib | DABRAFENIB | ||
| 2539 | G6PD | DRUGGABLE GENOME, ENZYME, CLINICALLY ACTIONABLE | Oxymetazoline | OXYMETAZOLINE | ||
| 2539 | G6PD | DRUGGABLE GENOME, ENZYME, CLINICALLY ACTIONABLE | phenazopyridine | PHENAZOPYRIDINE | 24372186,20701405,6125724,6410650 |
| Page: 1 2 3 4 5 6 7 8 9 10 11 12 13 14 |

Copyright 2023-Present -The University of Texas Health Science Center at Houston |