
|
|||||
|
 | |
| |
| |
| |
| |
| |
|
Gene: G6PC3 |
Gene summary for G6PC3 |
| Gene information | Species | Human | Gene symbol | G6PC3 | Gene ID | 92579 |
| Gene name | glucose-6-phosphatase catalytic subunit 3 | |
| Gene Alias | SCN4 | |
| Cytomap | 17q21.31 | |
| Gene Type | protein-coding | GO ID | GO:0005975 | UniProtAcc | Q9BUM1 |
Top |
Malignant transformation analysis |
| Identification of the aberrant gene expression in precancerous and cancerous lesions by comparing the gene expression of stem-like cells in diseased tissues with normal stem cells |
| Entrez ID | Symbol | Replicates | Species | Organ | Tissue | Adj P-value | Log2FC | Malignancy |
| 92579 | G6PC3 | LZE2T | Human | Esophagus | ESCC | 1.57e-02 | 3.25e-01 | 0.082 |
| 92579 | G6PC3 | LZE7T | Human | Esophagus | ESCC | 3.55e-08 | 4.68e-01 | 0.0667 |
| 92579 | G6PC3 | LZE8T | Human | Esophagus | ESCC | 9.34e-06 | 2.59e-01 | 0.067 |
| 92579 | G6PC3 | LZE24T | Human | Esophagus | ESCC | 8.76e-08 | 2.92e-01 | 0.0596 |
| 92579 | G6PC3 | LZE6T | Human | Esophagus | ESCC | 1.66e-12 | 7.56e-01 | 0.0845 |
| 92579 | G6PC3 | P1T-E | Human | Esophagus | ESCC | 1.79e-05 | 2.03e-01 | 0.0875 |
| 92579 | G6PC3 | P2T-E | Human | Esophagus | ESCC | 2.05e-17 | 3.26e-01 | 0.1177 |
| 92579 | G6PC3 | P4T-E | Human | Esophagus | ESCC | 1.57e-35 | 8.49e-01 | 0.1323 |
| 92579 | G6PC3 | P5T-E | Human | Esophagus | ESCC | 1.28e-22 | 5.44e-01 | 0.1327 |
| 92579 | G6PC3 | P8T-E | Human | Esophagus | ESCC | 2.61e-22 | 3.69e-01 | 0.0889 |
| 92579 | G6PC3 | P9T-E | Human | Esophagus | ESCC | 2.08e-21 | 5.04e-01 | 0.1131 |
| 92579 | G6PC3 | P10T-E | Human | Esophagus | ESCC | 4.43e-18 | 3.10e-01 | 0.116 |
| 92579 | G6PC3 | P11T-E | Human | Esophagus | ESCC | 2.22e-16 | 5.92e-01 | 0.1426 |
| 92579 | G6PC3 | P12T-E | Human | Esophagus | ESCC | 2.00e-24 | 5.38e-01 | 0.1122 |
| 92579 | G6PC3 | P15T-E | Human | Esophagus | ESCC | 7.56e-04 | 1.14e-01 | 0.1149 |
| 92579 | G6PC3 | P16T-E | Human | Esophagus | ESCC | 7.24e-39 | 7.66e-01 | 0.1153 |
| 92579 | G6PC3 | P17T-E | Human | Esophagus | ESCC | 2.66e-08 | 4.97e-01 | 0.1278 |
| 92579 | G6PC3 | P19T-E | Human | Esophagus | ESCC | 1.12e-13 | 1.20e+00 | 0.1662 |
| 92579 | G6PC3 | P21T-E | Human | Esophagus | ESCC | 1.93e-51 | 1.09e+00 | 0.1617 |
| 92579 | G6PC3 | P22T-E | Human | Esophagus | ESCC | 2.85e-54 | 1.04e+00 | 0.1236 |
| Page: 1 2 3 4 5 6 |
| Tissue | Expression Dynamics | Abbreviation |
| Esophagus | 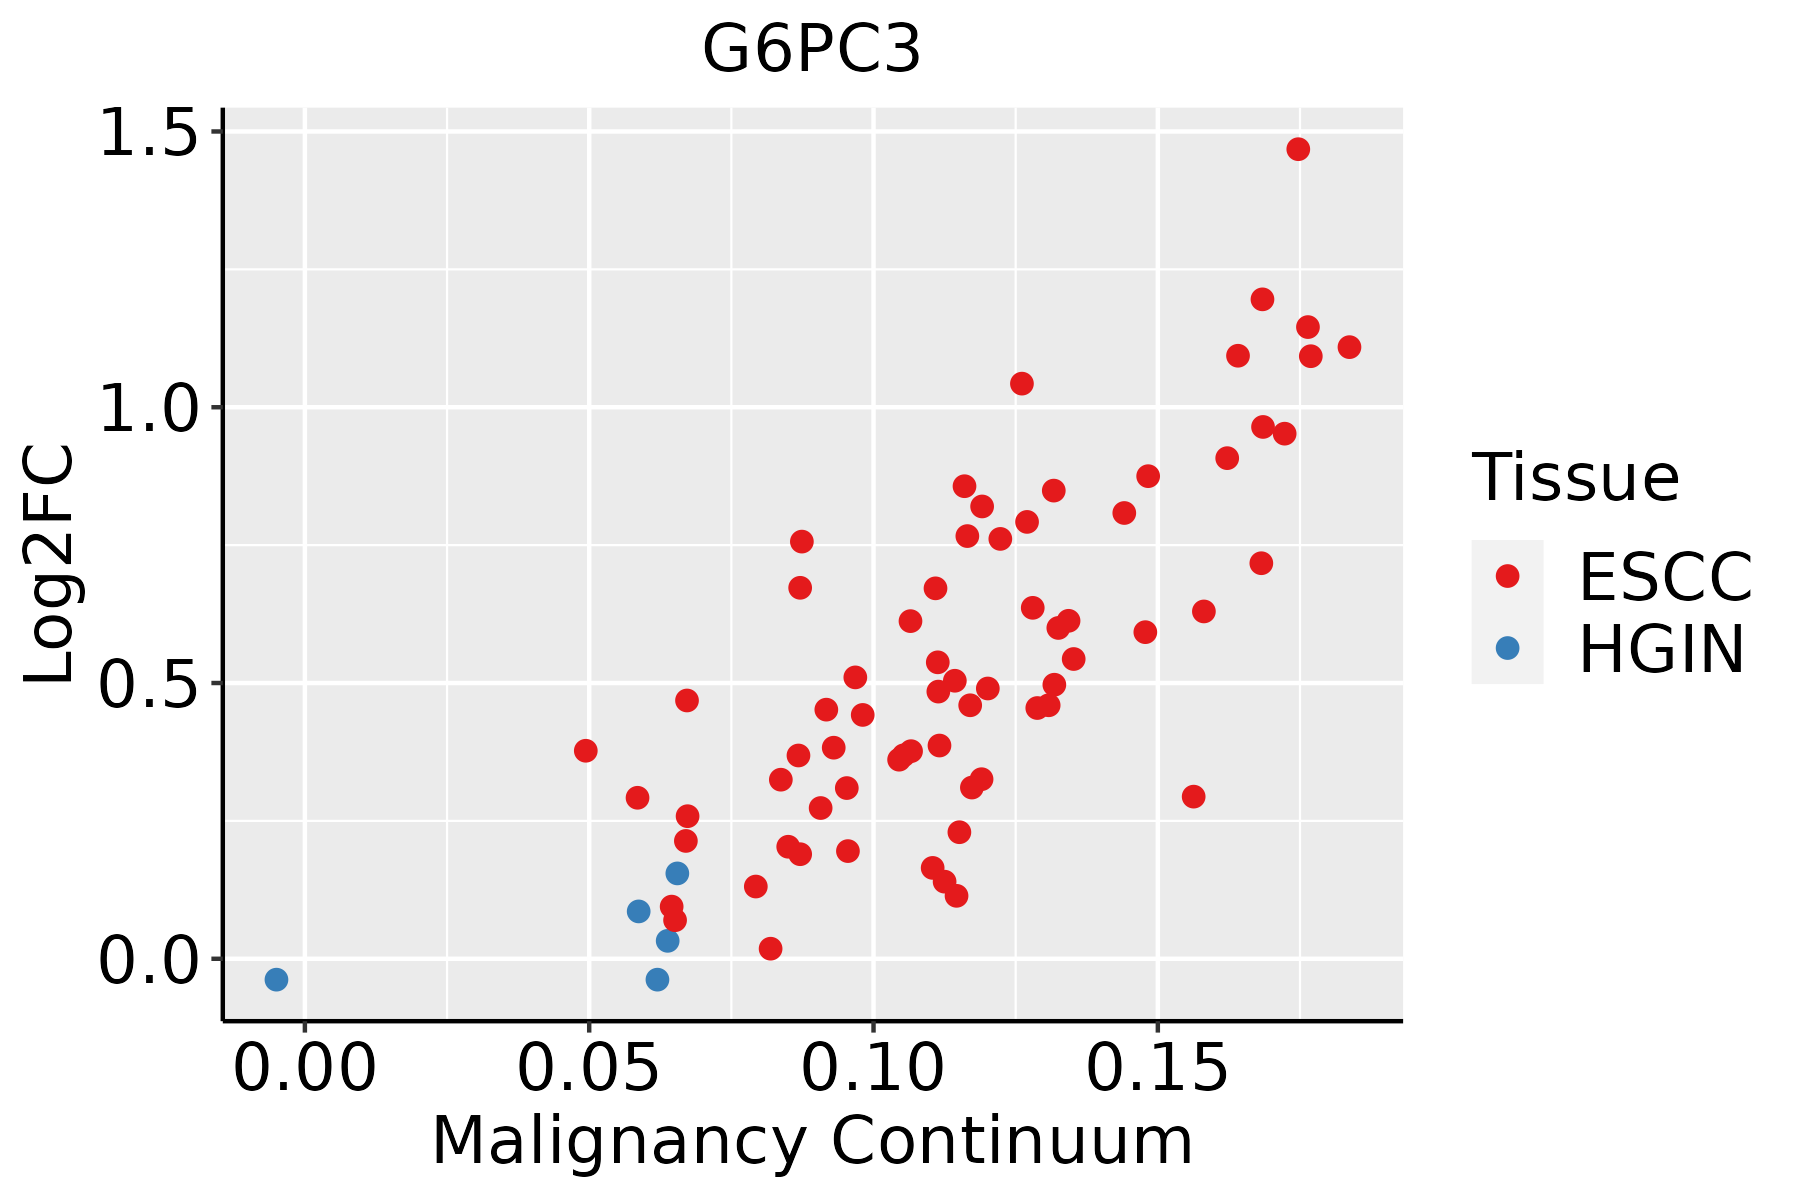 | ESCC: Esophageal squamous cell carcinoma |
| HGIN: High-grade intraepithelial neoplasias | ||
| LGIN: Low-grade intraepithelial neoplasias | ||
| Liver | 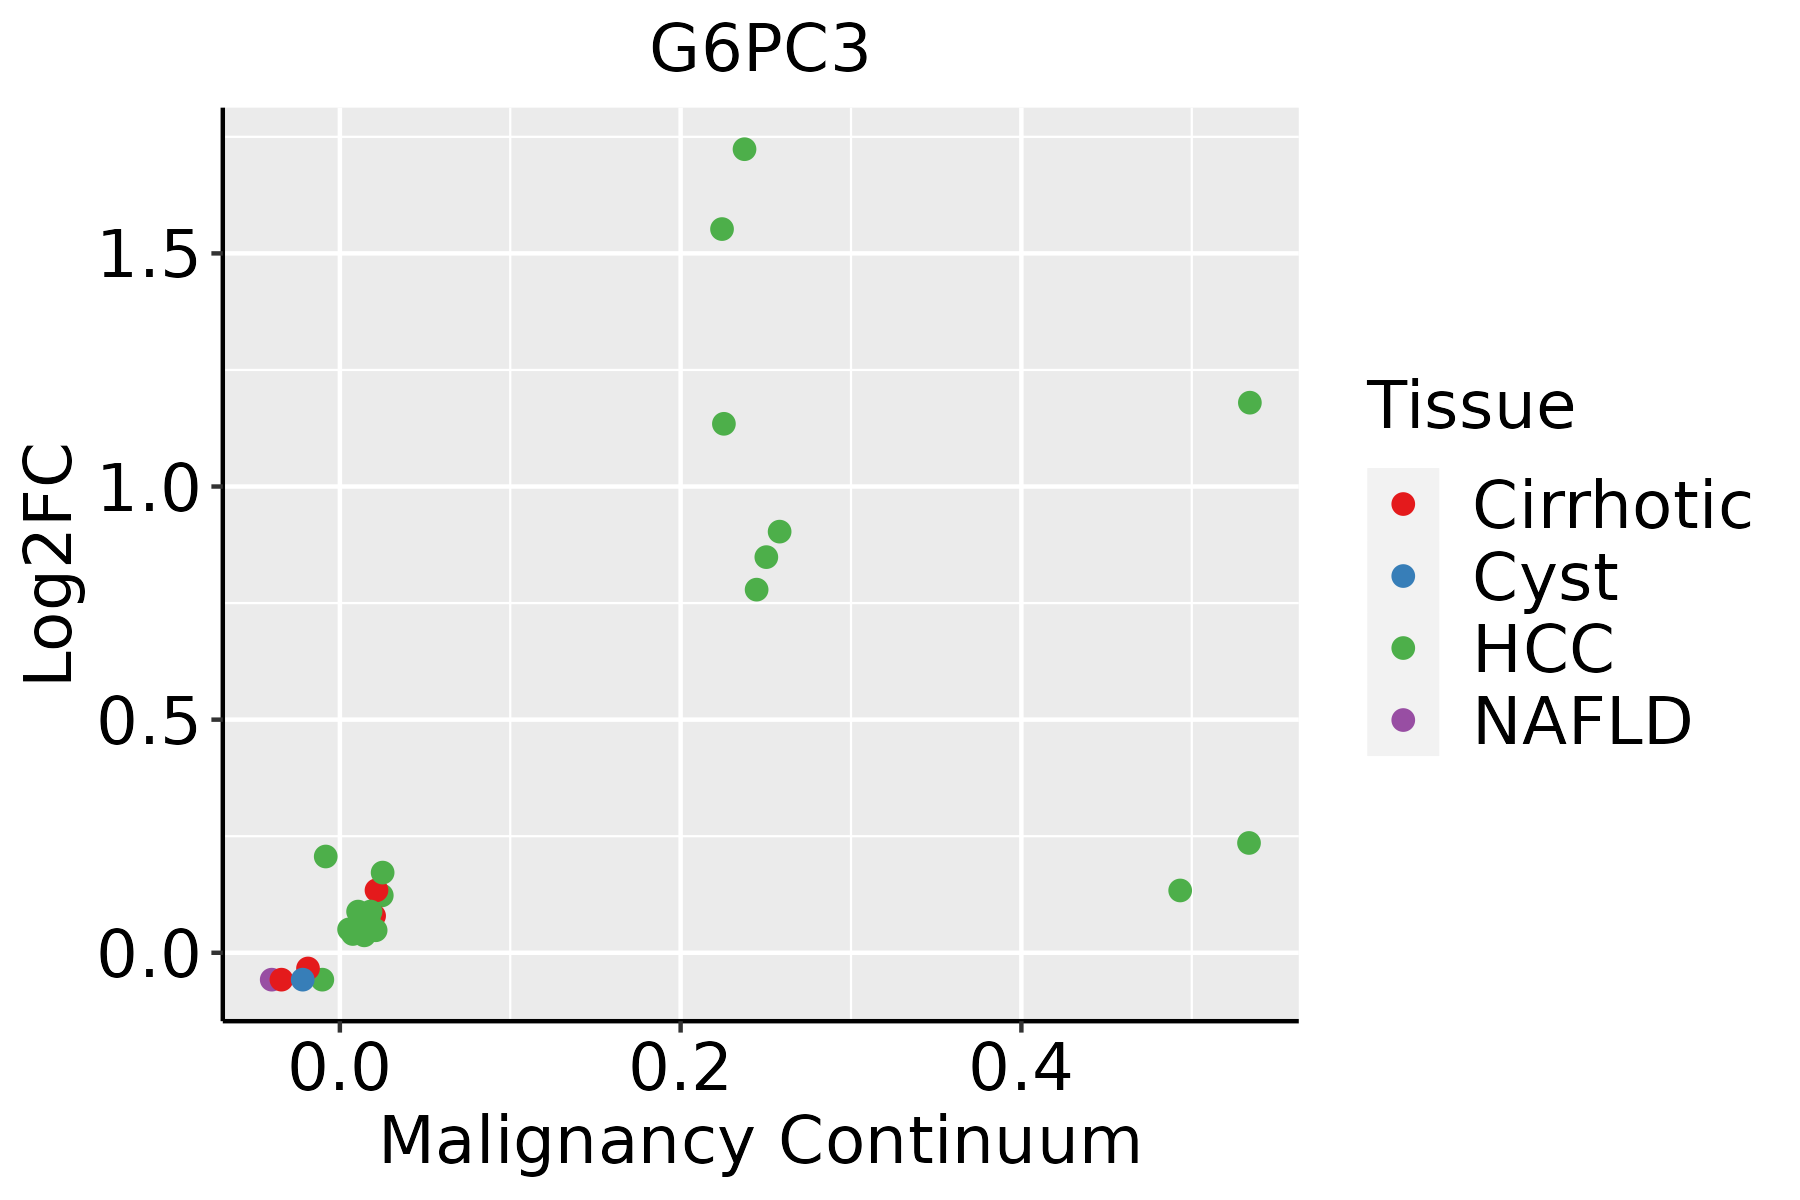 | HCC: Hepatocellular carcinoma |
| NAFLD: Non-alcoholic fatty liver disease | ||
| Oral Cavity |  | EOLP: Erosive Oral lichen planus |
| LP: leukoplakia | ||
| NEOLP: Non-erosive oral lichen planus | ||
| OSCC: Oral squamous cell carcinoma | ||
| Thyroid | 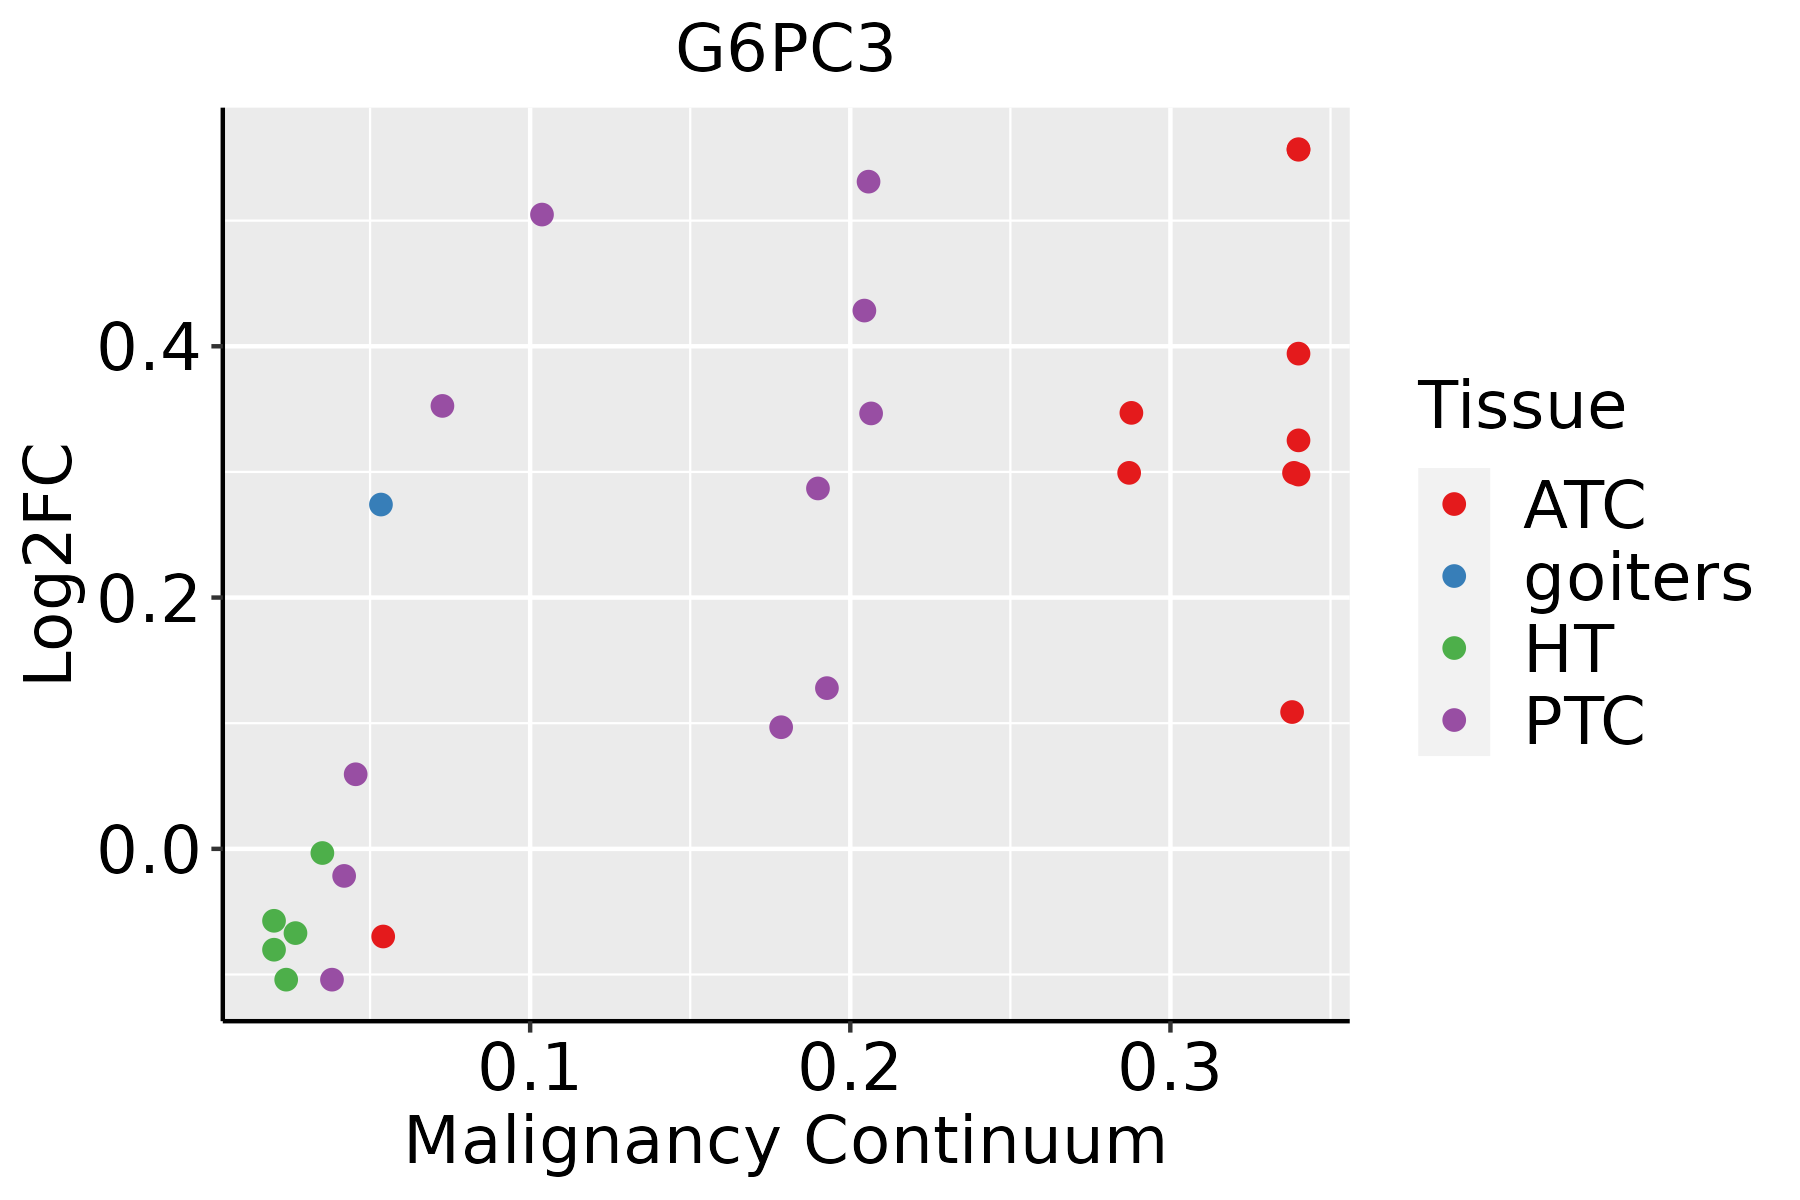 | ATC: Anaplastic thyroid cancer |
| HT: Hashimoto's thyroiditis | ||
| PTC: Papillary thyroid cancer |
| ∗log2FC in expression of this searched gene in stem-like cells from each diseased tissue sample relative to stem-like cells in normal samples in each tissue plotted against the malignancy continuum. Samples are colored based on if they are from different disease stage. |
Top |
Malignant transformation related pathway analysis |
| Find out the enriched GO biological processes and KEGG pathways involved in transition from healthy to precancer to cancer |
| Tissue | Disease Stage | Enriched GO biological Processes |
| Colorectum | AD |  |
| Colorectum | SER |  |
| Colorectum | MSS |  |
| Colorectum | MSI-H |  |
| Colorectum | FAP |  |
| ∗Top 15 enriched GO BP terms are showed in the bar plot of each disease state in each tissue. Each row represents a significant GO biological process which is colored according to the -log10(p.adjust). |
| Page: 1 2 3 4 5 6 7 8 9 |
| GO ID | Tissue | Disease Stage | Description | Gene Ratio | Bg Ratio | pvalue | p.adjust | Count |
| GO:001631110 | Esophagus | ESCC | dephosphorylation | 251/8552 | 417/18723 | 1.26e-09 | 2.99e-08 | 251 |
| GO:00059969 | Esophagus | ESCC | monosaccharide metabolic process | 159/8552 | 257/18723 | 1.11e-07 | 1.81e-06 | 159 |
| GO:00193189 | Esophagus | ESCC | hexose metabolic process | 147/8552 | 237/18723 | 2.63e-07 | 3.94e-06 | 147 |
| GO:00060069 | Esophagus | ESCC | glucose metabolic process | 119/8552 | 196/18723 | 1.51e-05 | 1.36e-04 | 119 |
| GO:00160514 | Esophagus | ESCC | carbohydrate biosynthetic process | 117/8552 | 202/18723 | 2.96e-04 | 1.79e-03 | 117 |
| GO:00463643 | Esophagus | ESCC | monosaccharide biosynthetic process | 52/8552 | 82/18723 | 9.03e-04 | 4.61e-03 | 52 |
| GO:00193193 | Esophagus | ESCC | hexose biosynthetic process | 49/8552 | 78/18723 | 1.69e-03 | 7.81e-03 | 49 |
| GO:00060943 | Esophagus | ESCC | gluconeogenesis | 46/8552 | 75/18723 | 4.54e-03 | 1.78e-02 | 46 |
| GO:000599612 | Liver | Cirrhotic | monosaccharide metabolic process | 104/4634 | 257/18723 | 1.74e-08 | 6.32e-07 | 104 |
| GO:001931812 | Liver | Cirrhotic | hexose metabolic process | 97/4634 | 237/18723 | 2.67e-08 | 9.16e-07 | 97 |
| GO:000600611 | Liver | Cirrhotic | glucose metabolic process | 82/4634 | 196/18723 | 1.01e-07 | 2.93e-06 | 82 |
| GO:00463641 | Liver | Cirrhotic | monosaccharide biosynthetic process | 37/4634 | 82/18723 | 4.52e-05 | 5.30e-04 | 37 |
| GO:00160511 | Liver | Cirrhotic | carbohydrate biosynthetic process | 73/4634 | 202/18723 | 1.91e-04 | 1.77e-03 | 73 |
| GO:00193191 | Liver | Cirrhotic | hexose biosynthetic process | 33/4634 | 78/18723 | 4.94e-04 | 3.96e-03 | 33 |
| GO:00060941 | Liver | Cirrhotic | gluconeogenesis | 32/4634 | 75/18723 | 5.00e-04 | 3.98e-03 | 32 |
| GO:001631111 | Liver | Cirrhotic | dephosphorylation | 130/4634 | 417/18723 | 1.58e-03 | 1.03e-02 | 130 |
| GO:0051156 | Liver | Cirrhotic | glucose 6-phosphate metabolic process | 12/4634 | 24/18723 | 6.58e-03 | 3.25e-02 | 12 |
| GO:000599621 | Liver | HCC | monosaccharide metabolic process | 167/7958 | 257/18723 | 2.31e-13 | 1.25e-11 | 167 |
| GO:001931821 | Liver | HCC | hexose metabolic process | 155/7958 | 237/18723 | 7.63e-13 | 3.90e-11 | 155 |
| GO:000600621 | Liver | HCC | glucose metabolic process | 128/7958 | 196/18723 | 8.60e-11 | 3.06e-09 | 128 |
| Page: 1 2 3 |
| Pathway ID | Tissue | Disease Stage | Description | Gene Ratio | Bg Ratio | pvalue | p.adjust | qvalue | Count |
| hsa040689 | Esophagus | ESCC | FoxO signaling pathway | 89/4205 | 131/8465 | 1.56e-05 | 7.98e-05 | 4.09e-05 | 89 |
| hsa0415210 | Esophagus | ESCC | AMPK signaling pathway | 80/4205 | 121/8465 | 1.73e-04 | 6.67e-04 | 3.42e-04 | 80 |
| hsa049109 | Esophagus | ESCC | Insulin signaling pathway | 89/4205 | 137/8465 | 1.97e-04 | 7.32e-04 | 3.75e-04 | 89 |
| hsa049318 | Esophagus | ESCC | Insulin resistance | 69/4205 | 108/8465 | 1.92e-03 | 5.54e-03 | 2.84e-03 | 69 |
| hsa041517 | Esophagus | ESCC | PI3K-Akt signaling pathway | 197/4205 | 354/8465 | 1.24e-02 | 2.83e-02 | 1.45e-02 | 197 |
| hsa0001016 | Esophagus | ESCC | Glycolysis / Gluconeogenesis | 42/4205 | 67/8465 | 2.15e-02 | 4.78e-02 | 2.45e-02 | 42 |
| hsa0492214 | Esophagus | ESCC | Glucagon signaling pathway | 64/4205 | 107/8465 | 2.18e-02 | 4.80e-02 | 2.46e-02 | 64 |
| hsa0406814 | Esophagus | ESCC | FoxO signaling pathway | 89/4205 | 131/8465 | 1.56e-05 | 7.98e-05 | 4.09e-05 | 89 |
| hsa0415213 | Esophagus | ESCC | AMPK signaling pathway | 80/4205 | 121/8465 | 1.73e-04 | 6.67e-04 | 3.42e-04 | 80 |
| hsa0491014 | Esophagus | ESCC | Insulin signaling pathway | 89/4205 | 137/8465 | 1.97e-04 | 7.32e-04 | 3.75e-04 | 89 |
| hsa0493113 | Esophagus | ESCC | Insulin resistance | 69/4205 | 108/8465 | 1.92e-03 | 5.54e-03 | 2.84e-03 | 69 |
| hsa0415114 | Esophagus | ESCC | PI3K-Akt signaling pathway | 197/4205 | 354/8465 | 1.24e-02 | 2.83e-02 | 1.45e-02 | 197 |
| hsa0001017 | Esophagus | ESCC | Glycolysis / Gluconeogenesis | 42/4205 | 67/8465 | 2.15e-02 | 4.78e-02 | 2.45e-02 | 42 |
| hsa0492215 | Esophagus | ESCC | Glucagon signaling pathway | 64/4205 | 107/8465 | 2.18e-02 | 4.80e-02 | 2.46e-02 | 64 |
| hsa0491021 | Liver | Cirrhotic | Insulin signaling pathway | 56/2530 | 137/8465 | 3.74e-03 | 1.50e-02 | 9.26e-03 | 56 |
| hsa040682 | Liver | Cirrhotic | FoxO signaling pathway | 52/2530 | 131/8465 | 9.98e-03 | 3.32e-02 | 2.05e-02 | 52 |
| hsa0491031 | Liver | Cirrhotic | Insulin signaling pathway | 56/2530 | 137/8465 | 3.74e-03 | 1.50e-02 | 9.26e-03 | 56 |
| hsa040683 | Liver | Cirrhotic | FoxO signaling pathway | 52/2530 | 131/8465 | 9.98e-03 | 3.32e-02 | 2.05e-02 | 52 |
| hsa0491041 | Liver | HCC | Insulin signaling pathway | 95/4020 | 137/8465 | 1.53e-07 | 1.97e-06 | 1.10e-06 | 95 |
| hsa0493121 | Liver | HCC | Insulin resistance | 77/4020 | 108/8465 | 3.89e-07 | 4.46e-06 | 2.48e-06 | 77 |
| Page: 1 2 3 |
Top |
Cell-cell communication analysis |
| Identification of potential cell-cell interactions between two cell types and their ligand-receptor pairs for different disease states |
| Ligand | Receptor | LRpair | Pathway | Tissue | Disease Stage |
| Page: 1 |
Top |
Single-cell gene regulatory network inference analysis |
| Find out the significant the regulons (TFs) and the target genes of each regulon across cell types for different disease states |
| TF | Cell Type | Tissue | Disease Stage | Target Gene | RSS | Regulon Activity |
| ∗The dot plots of a searched regulon are shown for all cell subpopulations in each disease state of each tissue based on the regulon specific score inferred using pySCENIC and by calculating the average expression. |
| Page: 1 |
Top |
Somatic mutation of malignant transformation related genes |
| Annotation of somatic variants for genes involved in malignant transformation |
| Hugo Symbol | Variant Class | Variant Classification | dbSNP RS | HGVSc | HGVSp | HGVSp Short | SWISSPROT | BIOTYPE | SIFT | PolyPhen | Tumor Sample Barcode | Tissue | Histology | Sex | Age | Stage | Therapy Types | Drugs | Outcome |
| G6PC3 | SNV | Missense_Mutation | novel | c.496N>A | p.Ala166Thr | p.A166T | Q9BUM1 | protein_coding | deleterious(0) | probably_damaging(0.999) | TCGA-JW-AAVH-01 | Cervix | cervical & endocervical cancer | Female | <65 | I/II | Unknown | Unknown | SD |
| G6PC3 | SNV | Missense_Mutation | c.256N>C | p.Glu86Gln | p.E86Q | Q9BUM1 | protein_coding | tolerated(0.06) | possibly_damaging(0.545) | TCGA-Q1-A73O-01 | Cervix | cervical & endocervical cancer | Female | <65 | I/II | Chemotherapy | cisplatin | CR | |
| G6PC3 | SNV | Missense_Mutation | rs140785361 | c.727G>A | p.Val243Met | p.V243M | Q9BUM1 | protein_coding | tolerated(0.48) | benign(0) | TCGA-AA-A01R-01 | Colorectum | colon adenocarcinoma | Male | <65 | III/IV | Chemotherapy | 5-fluorouracil | PD |
| G6PC3 | SNV | Missense_Mutation | c.835G>A | p.Gly279Arg | p.G279R | Q9BUM1 | protein_coding | tolerated(0.3) | benign(0.005) | TCGA-CK-4951-01 | Colorectum | colon adenocarcinoma | Female | >=65 | I/II | Unknown | Unknown | PD | |
| G6PC3 | SNV | Missense_Mutation | rs762579612 | c.920N>A | p.Ser307Asn | p.S307N | Q9BUM1 | protein_coding | tolerated(0.3) | benign(0.444) | TCGA-A5-A0G2-01 | Endometrium | uterine corpus endometrioid carcinoma | Female | <65 | III/IV | Unknown | Unknown | SD |
| G6PC3 | SNV | Missense_Mutation | c.985C>T | p.Pro329Ser | p.P329S | Q9BUM1 | protein_coding | deleterious(0) | probably_damaging(0.997) | TCGA-A5-A0VQ-01 | Endometrium | uterine corpus endometrioid carcinoma | Female | <65 | I/II | Chemotherapy | carboplatin | SD | |
| G6PC3 | SNV | Missense_Mutation | novel | c.198N>T | p.Trp66Cys | p.W66C | Q9BUM1 | protein_coding | deleterious(0) | probably_damaging(0.996) | TCGA-AJ-A3EL-01 | Endometrium | uterine corpus endometrioid carcinoma | Female | <65 | I/II | Unknown | Unknown | SD |
| G6PC3 | SNV | Missense_Mutation | novel | c.628N>C | p.Thr210Pro | p.T210P | Q9BUM1 | protein_coding | tolerated(0.06) | benign(0.057) | TCGA-AX-A0IS-01 | Endometrium | uterine corpus endometrioid carcinoma | Female | <65 | I/II | Chemotherapy | carboplatin | PD |
| G6PC3 | SNV | Missense_Mutation | novel | c.233N>G | p.Asp78Gly | p.D78G | Q9BUM1 | protein_coding | deleterious(0) | possibly_damaging(0.596) | TCGA-AX-A0J1-01 | Endometrium | uterine corpus endometrioid carcinoma | Female | >=65 | I/II | Unknown | Unknown | SD |
| G6PC3 | SNV | Missense_Mutation | novel | c.435N>A | p.Met145Ile | p.M145I | Q9BUM1 | protein_coding | tolerated(0.9) | benign(0) | TCGA-AX-A1CE-01 | Endometrium | uterine corpus endometrioid carcinoma | Female | <65 | I/II | Unspecific | Paclitaxel | SD |
| Page: 1 2 3 |
Top |
Related drugs of malignant transformation related genes |
| Identification of chemicals and drugs interact with genes involved in malignant transfromation |
| (DGIdb 4.0) |
| Entrez ID | Symbol | Category | Interaction Types | Drug Claim Name | Drug Name | PMIDs |
| Page: 1 |

Copyright 2023-Present -The University of Texas Health Science Center at Houston |