Schematic overview of the cellular and molecular mechanisms involved in the cancer progression, including the proposed cellular and molecular mechanisms in cancer cells trajectory. AT1: alveolar type 1 cells; AT2: alveolar type 2 cells; AAH: atypical adenomatous hyperplasia; AIS: adenocarcinoma in situ; MIA: minimally invasive adenocarcinoma; IA: invasive adenocarcinoma; EMT: epithelial-mesenchymal transition

Home

Download

Statistics

Help

Contact

Center for Computational Systems Medicine
leaf

Gene summary

leaf

Malignant transformation analysis

leaf

Malignant transformation related pathway analysis

leaf

Cell-cell communication analysis

leaf

Single-cell gene regulatory network inference analysis

leaf

Somatic mutation of malignant transformation related genes

leaf

Related drugs of malignant transformation related genes

Gene: G3BP2

Gene summary for G3BP2

check button Gene summary.

Gene informationSpeciesHuman
Gene symbol

G3BP2

Gene ID

9908

Gene nameG3BP stress granule assembly factor 2
Gene AliasG3BP2
Cytomap4q21.1
Gene Typeprotein-coding
GO ID

GO:0002376

UniProtAcc

A0A024RDE5


Top

Malignant transformation analysis

check button Identification of the aberrant gene expression in precancerous and cancerous lesions by comparing the gene expression of stem-like cells in diseased tissues with normal stem cells
check button Malignant transformation involving gene list.
Entrez IDSymbolReplicatesSpeciesOrganTissueAdj P-valueLog2FCMalignancy
9908G3BP2LZE4THumanEsophagusESCC4.80e-061.41e-010.0811
9908G3BP2LZE7THumanEsophagusESCC1.84e-048.96e-010.0667
9908G3BP2LZE20THumanEsophagusESCC9.90e-05-1.50e-020.0662
9908G3BP2LZE21D1HumanEsophagusHGIN4.49e-03-7.48e-020.0632
9908G3BP2LZE22D1HumanEsophagusHGIN1.46e-07-9.60e-020.0595
9908G3BP2LZE22THumanEsophagusESCC1.30e-058.54e-020.068
9908G3BP2LZE24THumanEsophagusESCC5.97e-073.03e-010.0596
9908G3BP2LZE6THumanEsophagusESCC7.45e-055.01e-010.0845
9908G3BP2P1T-EHumanEsophagusESCC2.28e-032.65e-010.0875
9908G3BP2P2T-EHumanEsophagusESCC1.84e-429.44e-010.1177
9908G3BP2P4T-EHumanEsophagusESCC3.27e-187.00e-010.1323
9908G3BP2P5T-EHumanEsophagusESCC2.60e-11-2.34e-020.1327
9908G3BP2P8T-EHumanEsophagusESCC1.48e-121.65e-010.0889
9908G3BP2P9T-EHumanEsophagusESCC8.17e-228.24e-030.1131
9908G3BP2P10T-EHumanEsophagusESCC8.43e-252.76e-010.116
9908G3BP2P11T-EHumanEsophagusESCC1.23e-055.86e-010.1426
9908G3BP2P12T-EHumanEsophagusESCC4.56e-193.12e-010.1122
9908G3BP2P15T-EHumanEsophagusESCC1.15e-205.63e-010.1149
9908G3BP2P16T-EHumanEsophagusESCC1.44e-285.82e-010.1153
9908G3BP2P17T-EHumanEsophagusESCC3.07e-123.65e-010.1278
Page: 1 2 3 4 5 6 7 8 

check button Transcriptomic changes along malignancy continuum.
TissueExpression DynamicsAbbreviation
EsophagusThe image shows the transcriptomic changes along malignancy continuum.log2FC in expression of this searched gene in stem-like cells from each diseased tissue sample relative to stem-like cells in normal samples in each tissue plotted against the malignancy continuum. Samples are colored based on if they are from different disease stage.ESCC: Esophageal squamous cell carcinoma
HGIN: High-grade intraepithelial neoplasias
LGIN: Low-grade intraepithelial neoplasias
LiverThe image shows the transcriptomic changes along malignancy continuum.log2FC in expression of this searched gene in stem-like cells from each diseased tissue sample relative to stem-like cells in normal samples in each tissue plotted against the malignancy continuum. Samples are colored based on if they are from different disease stage.HCC: Hepatocellular carcinoma
NAFLD: Non-alcoholic fatty liver disease
Oral CavityThe image shows the transcriptomic changes along malignancy continuum.log2FC in expression of this searched gene in stem-like cells from each diseased tissue sample relative to stem-like cells in normal samples in each tissue plotted against the malignancy continuum. Samples are colored based on if they are from different disease stage.
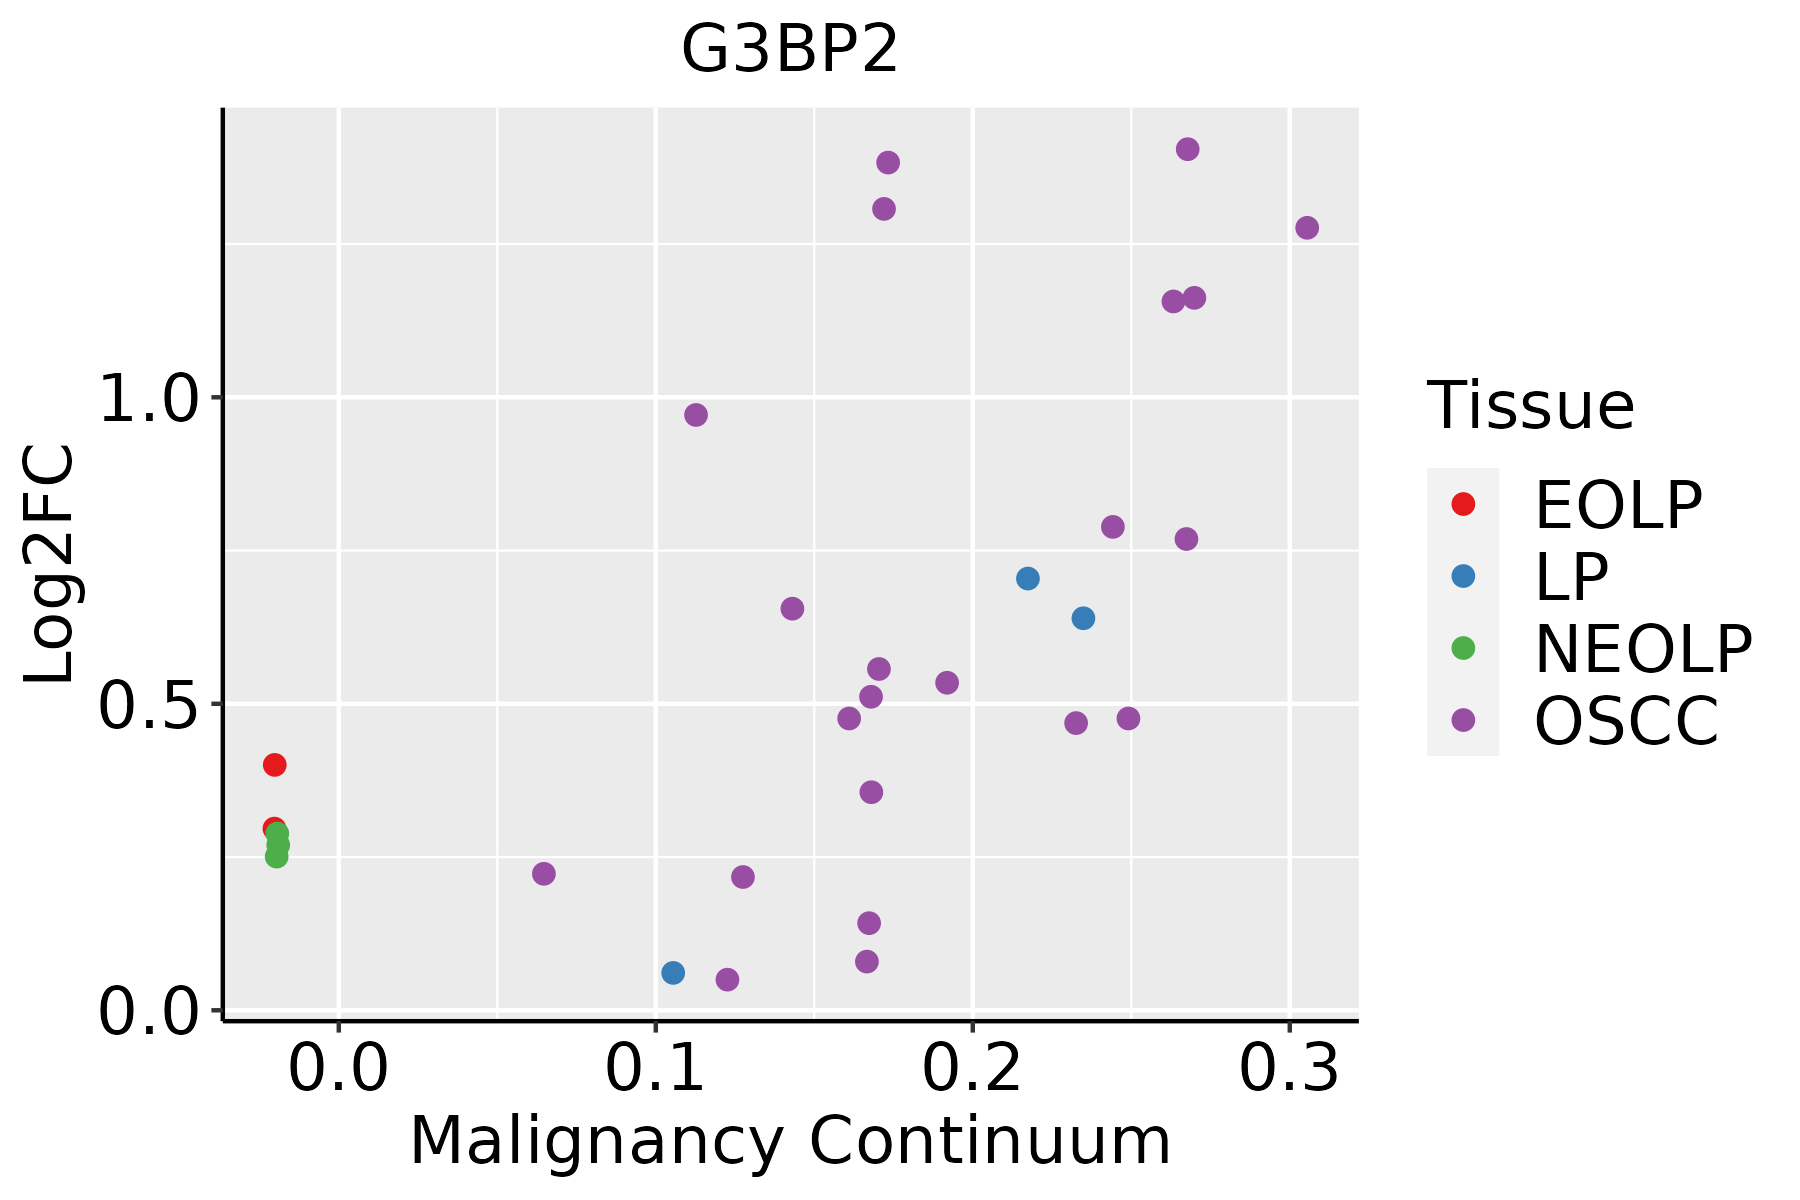
EOLP: Erosive Oral lichen planus
LP: leukoplakia
NEOLP: Non-erosive oral lichen planus
OSCC: Oral squamous cell carcinoma
ProstateThe image shows the transcriptomic changes along malignancy continuum.log2FC in expression of this searched gene in stem-like cells from each diseased tissue sample relative to stem-like cells in normal samples in each tissue plotted against the malignancy continuum. Samples are colored based on if they are from different disease stage.
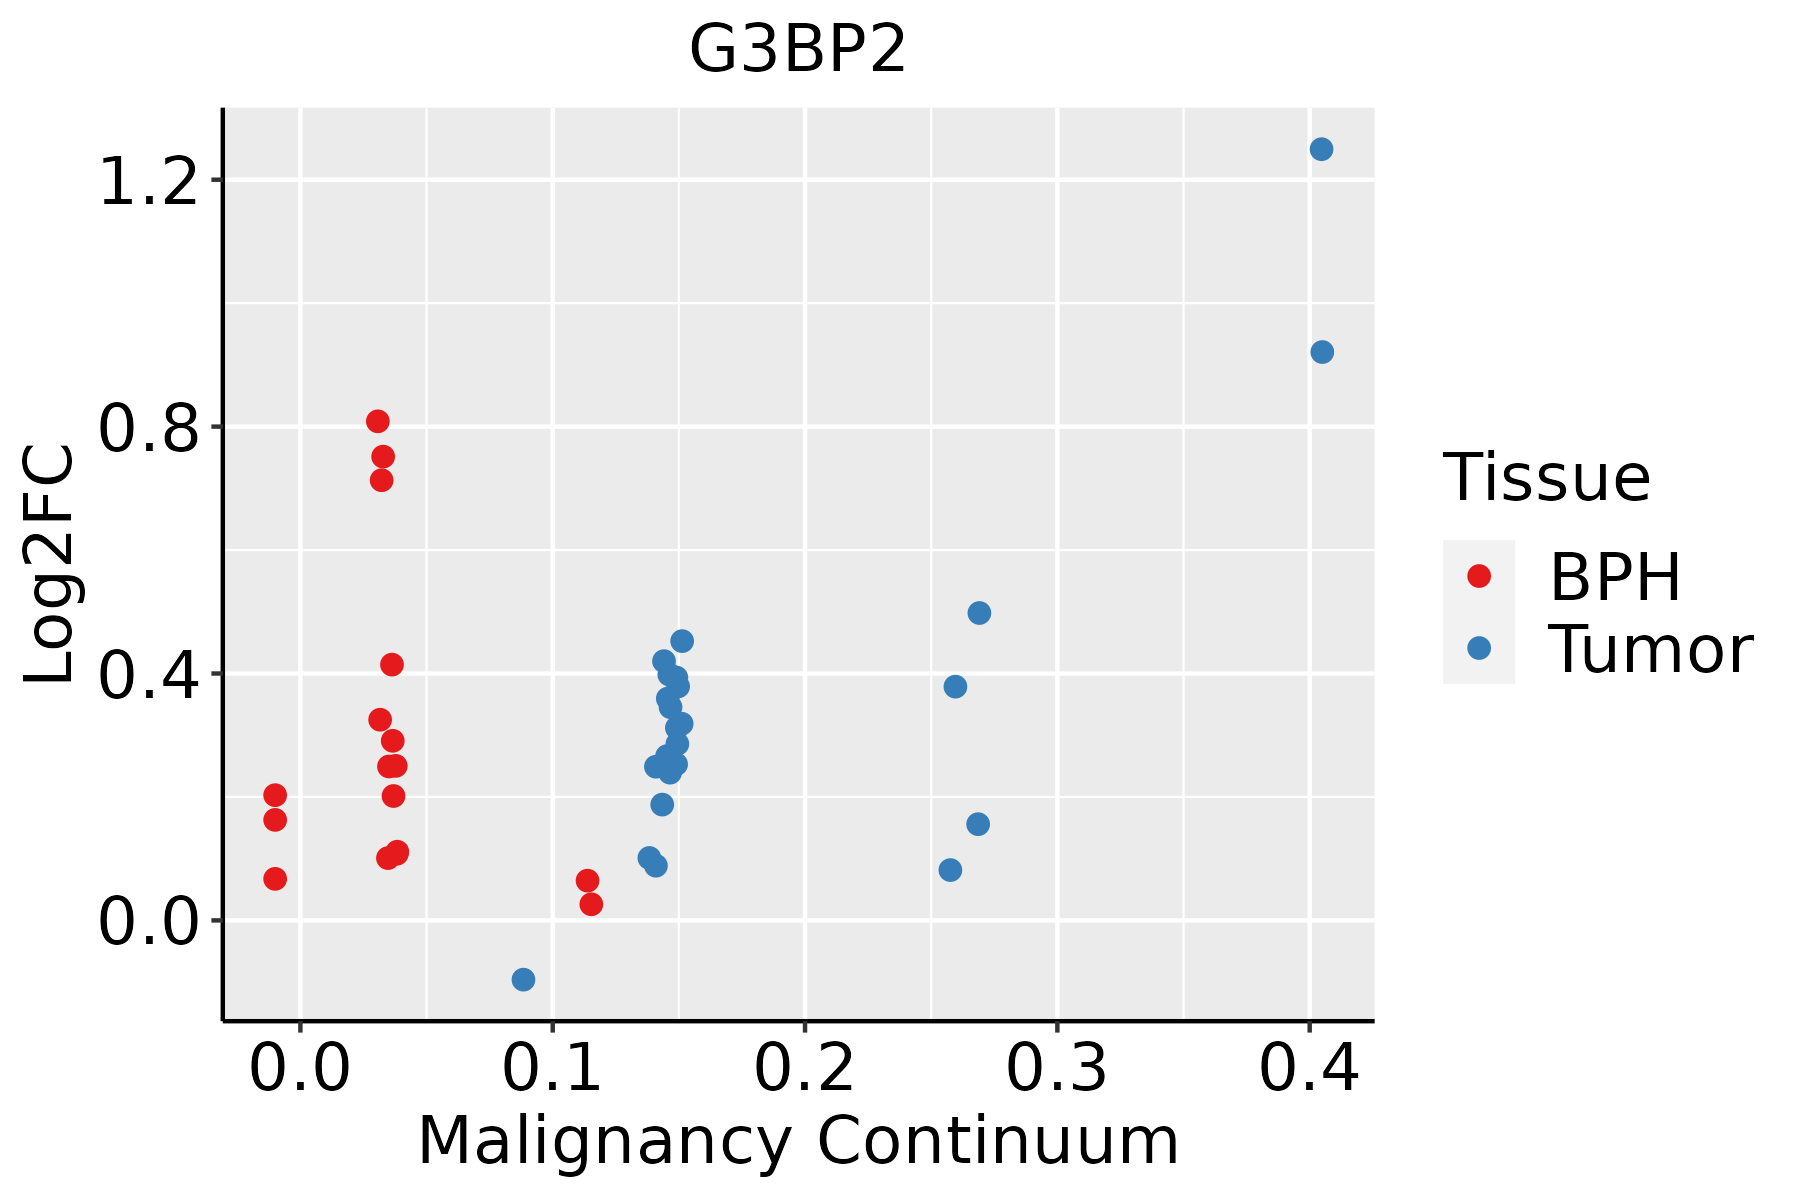
BPH: Benign Prostatic Hyperplasia
SkinThe image shows the transcriptomic changes along malignancy continuum.log2FC in expression of this searched gene in stem-like cells from each diseased tissue sample relative to stem-like cells in normal samples in each tissue plotted against the malignancy continuum. Samples are colored based on if they are from different disease stage.AK: Actinic keratosis
cSCC: Cutaneous squamous cell carcinoma
SCCIS:squamous cell carcinoma in situ
ThyroidThe image shows the transcriptomic changes along malignancy continuum.log2FC in expression of this searched gene in stem-like cells from each diseased tissue sample relative to stem-like cells in normal samples in each tissue plotted against the malignancy continuum. Samples are colored based on if they are from different disease stage.ATC: Anaplastic thyroid cancer
HT: Hashimoto's thyroiditis
PTC: Papillary thyroid cancer
∗log2FC in expression of this searched gene in stem-like cells from each diseased tissue sample relative to stem-like cells in normal samples in each tissue plotted against the malignancy continuum. Samples are colored based on if they are from different disease stage.

Top

Malignant transformation related pathway analysis

check buttonFind out the enriched GO biological processes and KEGG pathways involved in transition from healthy to precancer to cancer
check button Figure of enriched GO biological processes.
TissueDisease StageEnriched GO biological Processes
ColorectumADGO analysis - Figure of enriched GO biological processes: Top 15 enriched GO BP terms are showed in the bar plot of each disease state in each tissue. Each row represents a significant GO biological process which is colored according to the -log10(p.adjust).
ColorectumSERGO analysis - Figure of enriched GO biological processes: Top 15 enriched GO BP terms are showed in the bar plot of each disease state in each tissue. Each row represents a significant GO biological process which is colored according to the -log10(p.adjust).
ColorectumMSSGO analysis - Figure of enriched GO biological processes: Top 15 enriched GO BP terms are showed in the bar plot of each disease state in each tissue. Each row represents a significant GO biological process which is colored according to the -log10(p.adjust).
ColorectumMSI-HGO analysis - Figure of enriched GO biological processes: Top 15 enriched GO BP terms are showed in the bar plot of each disease state in each tissue. Each row represents a significant GO biological process which is colored according to the -log10(p.adjust).
ColorectumFAPGO analysis - Figure of enriched GO biological processes: Top 15 enriched GO BP terms are showed in the bar plot of each disease state in each tissue. Each row represents a significant GO biological process which is colored according to the -log10(p.adjust).
∗Top 15 enriched GO BP terms are showed in the bar plot of each disease state in each tissue. Each row represents a significant GO biological process which is colored according to the -log10(p.adjust).
Page: 1 2 3 4 5 6 7 8 9 

check button Enriched GO biological processes.
GO IDTissueDisease StageDescriptionGene RatioBg Ratiopvaluep.adjustCount
GO:000640320EsophagusHGINRNA localization66/2587201/187234.06e-125.41e-1066
GO:005065716EsophagusHGINnucleic acid transport49/2587163/187235.71e-083.06e-0649
GO:005065816EsophagusHGINRNA transport49/2587163/187235.71e-083.06e-0649
GO:005123616EsophagusHGINestablishment of RNA localization49/2587166/187231.07e-075.47e-0649
GO:00510288EsophagusHGINmRNA transport40/2587130/187234.67e-072.07e-0540
GO:001593116EsophagusHGINnucleobase-containing compound transport57/2587222/187231.76e-066.52e-0557
GO:005123520EsophagusHGINmaintenance of location73/2587327/187231.73e-054.71e-0473
GO:004518523EsophagusHGINmaintenance of protein location28/258794/187234.52e-051.09e-0328
GO:19021156EsophagusHGINregulation of organelle assembly46/2587186/187234.63e-051.12e-0346
GO:00340638EsophagusHGINstress granule assembly10/258726/187231.60e-031.79e-0210
GO:00512205EsophagusHGINcytoplasmic sequestering of protein9/258722/187231.64e-031.82e-029
GO:0006403110EsophagusESCCRNA localization166/8552201/187231.95e-276.18e-25166
GO:005123617EsophagusESCCestablishment of RNA localization134/8552166/187231.23e-201.81e-18134
GO:005102815EsophagusESCCmRNA transport110/8552130/187232.76e-203.80e-18110
GO:005065717EsophagusESCCnucleic acid transport131/8552163/187236.94e-208.46e-18131
GO:005065817EsophagusESCCRNA transport131/8552163/187236.94e-208.46e-18131
GO:001593117EsophagusESCCnucleobase-containing compound transport162/8552222/187239.87e-177.93e-15162
GO:0045185111EsophagusESCCmaintenance of protein location71/855294/187233.41e-097.24e-0871
GO:0051235110EsophagusESCCmaintenance of location200/8552327/187231.01e-082.02e-07200
GO:000726510EsophagusESCCRas protein signal transduction201/8552337/187231.44e-072.30e-06201
Page: 1 2 3 4 5 6 7 8 9 10 

check button Enriched KEGG pathways.
Pathway IDTissueDisease StageDescriptionGene RatioBg Ratiopvaluep.adjustqvalueCount
Page: 1 

Top

Cell-cell communication analysis

check buttonIdentification of potential cell-cell interactions between two cell types and their ligand-receptor pairs for different disease states
LigandReceptorLRpairPathwayTissueDisease Stage
Page: 1 

Top

Single-cell gene regulatory network inference analysis

check buttonFind out the significant the regulons (TFs) and the target genes of each regulon across cell types for different disease states
TFCell TypeTissueDisease StageTarget GeneRSSRegulon Activity
∗The dot plots of a searched regulon are shown for all cell subpopulations in each disease state of each tissue based on the regulon specific score inferred using pySCENIC and by calculating the average expression.
Page: 1 

Top

Somatic mutation of malignant transformation related genes

check buttonAnnotation of somatic variants for genes involved in malignant transformation
Hugo SymbolVariant ClassVariant ClassificationdbSNP RSHGVScHGVSpHGVSp ShortSWISSPROTBIOTYPESIFTPolyPhenTumor Sample BarcodeTissueHistologySexAgeStageTherapy TypesDrugsOutcome
G3BP2SNVMissense_Mutationc.1264N>Tp.Asp422Tyrp.D422YQ9UN86protein_codingtolerated(0.1)probably_damaging(0.994)TCGA-A2-A0YK-01Breastbreast invasive carcinomaFemale<65I/IIChemotherapycytoxanSD
G3BP2SNVMissense_Mutationc.884N>Tp.Arg295Leup.R295LQ9UN86protein_codingdeleterious(0)possibly_damaging(0.863)TCGA-AN-A0FW-01Breastbreast invasive carcinomaFemale>=65III/IVUnknownUnknownSD
G3BP2SNVMissense_Mutationnovelc.1218G>Cp.Glu406Aspp.E406DQ9UN86protein_codingdeleterious(0.01)possibly_damaging(0.515)TCGA-BH-A2L8-01Breastbreast invasive carcinomaFemale<65I/IIChemotherapycytoxanCR
G3BP2SNVMissense_Mutationc.1363N>Ap.Pro455Thrp.P455TQ9UN86protein_codingdeleterious_low_confidence(0.01)probably_damaging(0.987)TCGA-D8-A1J8-01Breastbreast invasive carcinomaFemale>=65I/IIHormone TherapynolvadexSD
G3BP2SNVMissense_Mutationnovelc.346N>Tp.Pro116Serp.P116SQ9UN86protein_codingdeleterious(0.01)probably_damaging(0.999)TCGA-OL-A5D6-01Breastbreast invasive carcinomaFemale>=65I/IIUnknownUnknownSD
G3BP2SNVMissense_Mutationrs771668396c.116N>Tp.Ser39Phep.S39FQ9UN86protein_codingdeleterious(0)probably_damaging(1)TCGA-OL-A5RU-01Breastbreast invasive carcinomaFemale<65I/IIChemotherapycyclophosphamideCR
G3BP2SNVMissense_Mutationrs267600258c.232C>Tp.Arg78Cysp.R78CQ9UN86protein_codingtolerated(0.08)benign(0.054)TCGA-2W-A8YY-01Cervixcervical & endocervical cancerFemale<65I/IIChemotherapycisplatinCR
G3BP2SNVMissense_Mutationrs767685659c.1445N>Ap.Arg482Hisp.R482HQ9UN86protein_codingdeleterious_low_confidence(0.01)probably_damaging(0.976)TCGA-A6-5661-01Colorectumcolon adenocarcinomaFemale>=65I/IIUnknownUnknownSD
G3BP2SNVMissense_Mutationc.1178N>Tp.Pro393Leup.P393LQ9UN86protein_codingdeleterious(0)benign(0.216)TCGA-AA-A00N-01Colorectumcolon adenocarcinomaMale>=65I/IIUnknownUnknownPD
G3BP2SNVMissense_Mutationnovelc.1160N>Ap.Arg387Lysp.R387KQ9UN86protein_codingtolerated(1)benign(0.001)TCGA-AA-A00N-01Colorectumcolon adenocarcinomaMale>=65I/IIUnknownUnknownPD
Page: 1 2 3 4 5 6 

Top

Related drugs of malignant transformation related genes

check buttonIdentification of chemicals and drugs interact with genes involved in malignant transfromation
(DGIdb 4.0)
Entrez IDSymbolCategoryInteraction TypesDrug Claim NameDrug NamePMIDs
Page: 1