
|
|||||
|
 | |
| |
| |
| |
| |
| |
|
Gene: G3BP1 |
Gene summary for G3BP1 |
| Gene information | Species | Human | Gene symbol | G3BP1 | Gene ID | 10146 |
| Gene name | G3BP stress granule assembly factor 1 | |
| Gene Alias | G3BP | |
| Cytomap | 5q33.1 | |
| Gene Type | protein-coding | GO ID | GO:0001816 | UniProtAcc | Q13283 |
Top |
Malignant transformation analysis |
| Identification of the aberrant gene expression in precancerous and cancerous lesions by comparing the gene expression of stem-like cells in diseased tissues with normal stem cells |
| Entrez ID | Symbol | Replicates | Species | Organ | Tissue | Adj P-value | Log2FC | Malignancy |
| 10146 | G3BP1 | HTA11_3410_2000001011 | Human | Colorectum | AD | 1.19e-06 | -3.51e-01 | 0.0155 |
| 10146 | G3BP1 | HTA11_99999970781_79442 | Human | Colorectum | MSS | 1.01e-05 | 4.84e-01 | 0.294 |
| 10146 | G3BP1 | HTA11_99999974143_84620 | Human | Colorectum | MSS | 3.90e-07 | -2.69e-01 | 0.3005 |
| 10146 | G3BP1 | A001-C-207 | Human | Colorectum | FAP | 5.71e-05 | -3.15e-01 | 0.1278 |
| 10146 | G3BP1 | A015-C-203 | Human | Colorectum | FAP | 1.07e-19 | -3.38e-01 | -0.1294 |
| 10146 | G3BP1 | A015-C-204 | Human | Colorectum | FAP | 1.90e-06 | -2.99e-01 | -0.0228 |
| 10146 | G3BP1 | A014-C-040 | Human | Colorectum | FAP | 3.67e-03 | -2.69e-01 | -0.1184 |
| 10146 | G3BP1 | A002-C-201 | Human | Colorectum | FAP | 6.29e-09 | -1.94e-01 | 0.0324 |
| 10146 | G3BP1 | A002-C-203 | Human | Colorectum | FAP | 1.43e-02 | -8.04e-02 | 0.2786 |
| 10146 | G3BP1 | A001-C-119 | Human | Colorectum | FAP | 2.89e-06 | -3.51e-01 | -0.1557 |
| 10146 | G3BP1 | A001-C-108 | Human | Colorectum | FAP | 1.24e-14 | -3.50e-01 | -0.0272 |
| 10146 | G3BP1 | A002-C-205 | Human | Colorectum | FAP | 6.18e-18 | -3.47e-01 | -0.1236 |
| 10146 | G3BP1 | A001-C-104 | Human | Colorectum | FAP | 2.06e-03 | -2.17e-01 | 0.0184 |
| 10146 | G3BP1 | A015-C-005 | Human | Colorectum | FAP | 2.36e-07 | -3.58e-01 | -0.0336 |
| 10146 | G3BP1 | A015-C-006 | Human | Colorectum | FAP | 8.12e-13 | -3.01e-01 | -0.0994 |
| 10146 | G3BP1 | A015-C-106 | Human | Colorectum | FAP | 3.26e-06 | -2.27e-01 | -0.0511 |
| 10146 | G3BP1 | A002-C-114 | Human | Colorectum | FAP | 3.93e-17 | -4.17e-01 | -0.1561 |
| 10146 | G3BP1 | A015-C-104 | Human | Colorectum | FAP | 7.85e-22 | -3.49e-01 | -0.1899 |
| 10146 | G3BP1 | A001-C-014 | Human | Colorectum | FAP | 4.72e-10 | -2.95e-01 | 0.0135 |
| 10146 | G3BP1 | A002-C-016 | Human | Colorectum | FAP | 2.58e-12 | -2.41e-01 | 0.0521 |
| Page: 1 2 3 4 5 6 7 8 9 |
| Tissue | Expression Dynamics | Abbreviation |
| Colorectum (GSE201348) |  | FAP: Familial adenomatous polyposis |
| CRC: Colorectal cancer | ||
| Colorectum (HTA11) |  | AD: Adenomas |
| SER: Sessile serrated lesions | ||
| MSI-H: Microsatellite-high colorectal cancer | ||
| MSS: Microsatellite stable colorectal cancer | ||
| Esophagus |  | ESCC: Esophageal squamous cell carcinoma |
| HGIN: High-grade intraepithelial neoplasias | ||
| LGIN: Low-grade intraepithelial neoplasias | ||
| Liver | 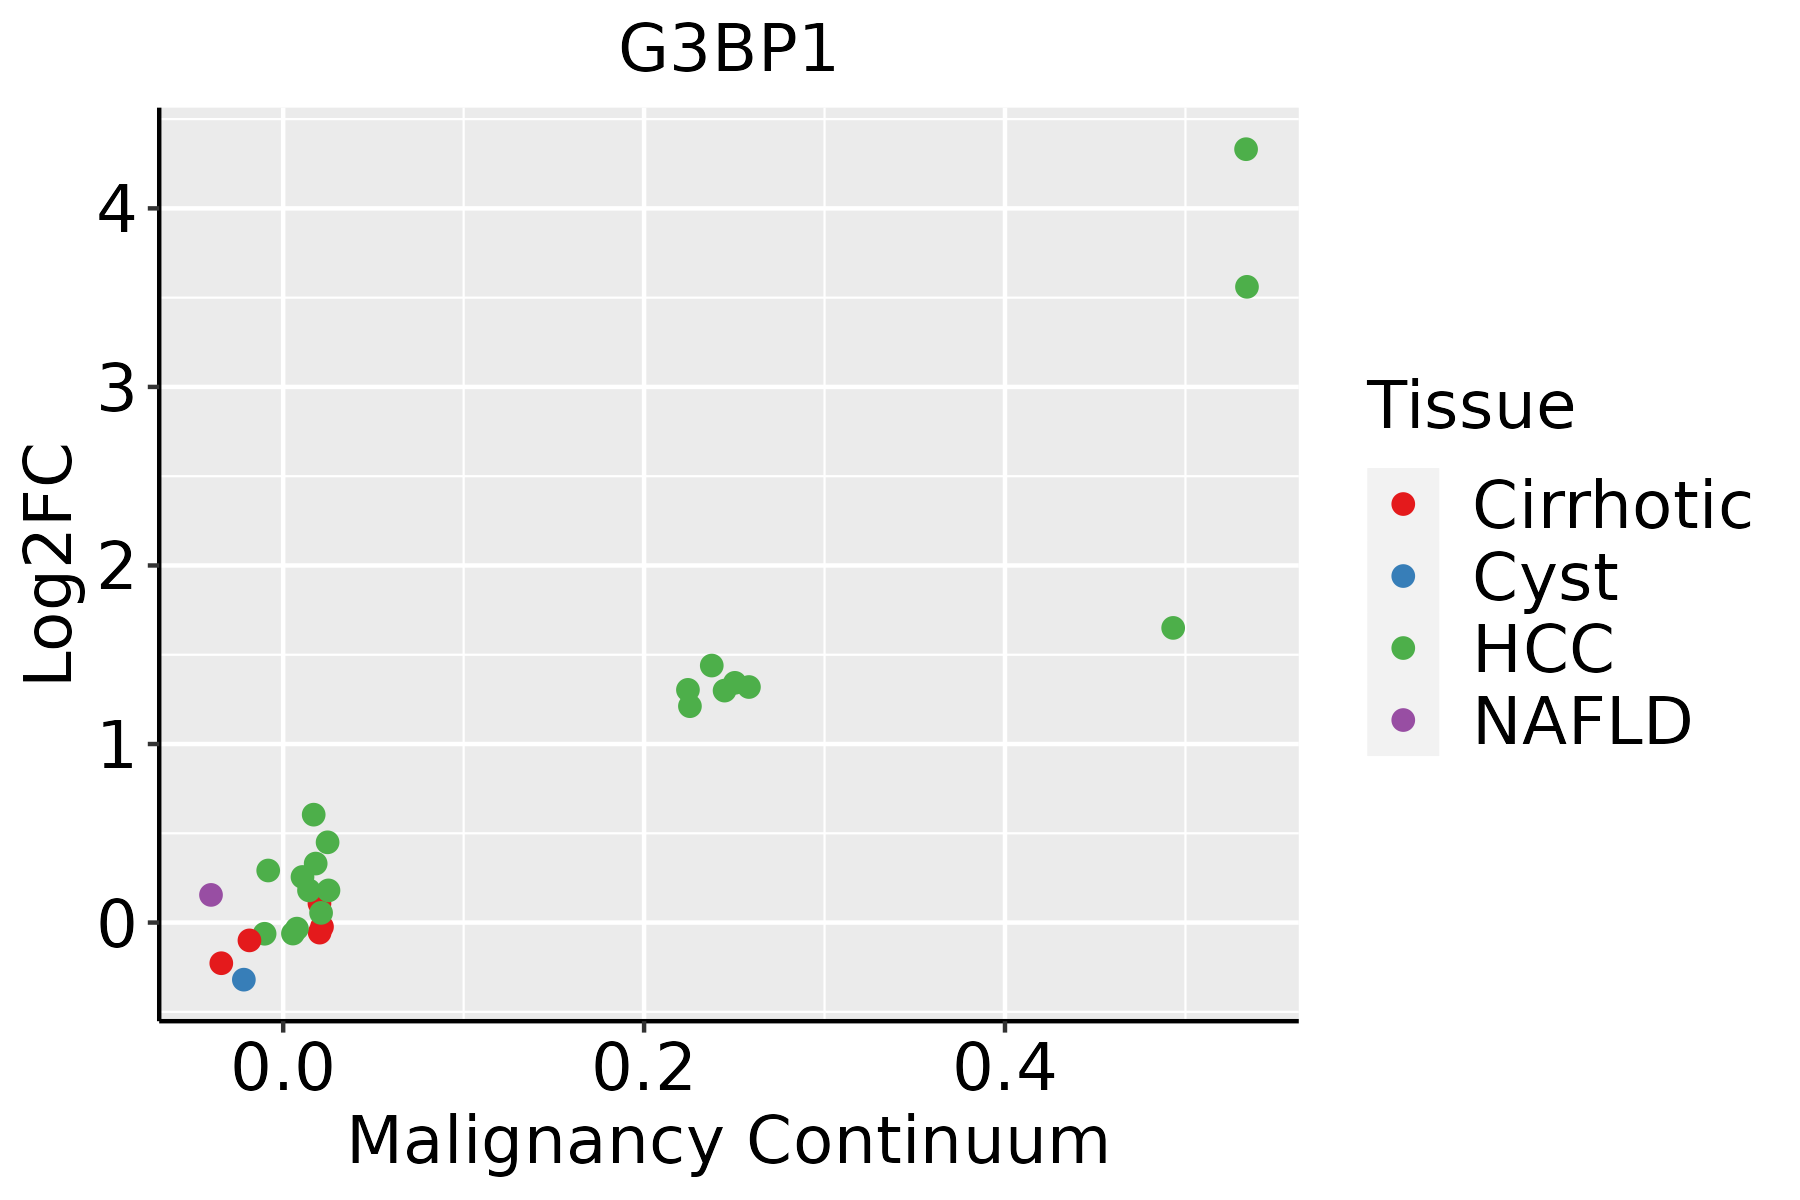 | HCC: Hepatocellular carcinoma |
| NAFLD: Non-alcoholic fatty liver disease | ||
| Oral Cavity | 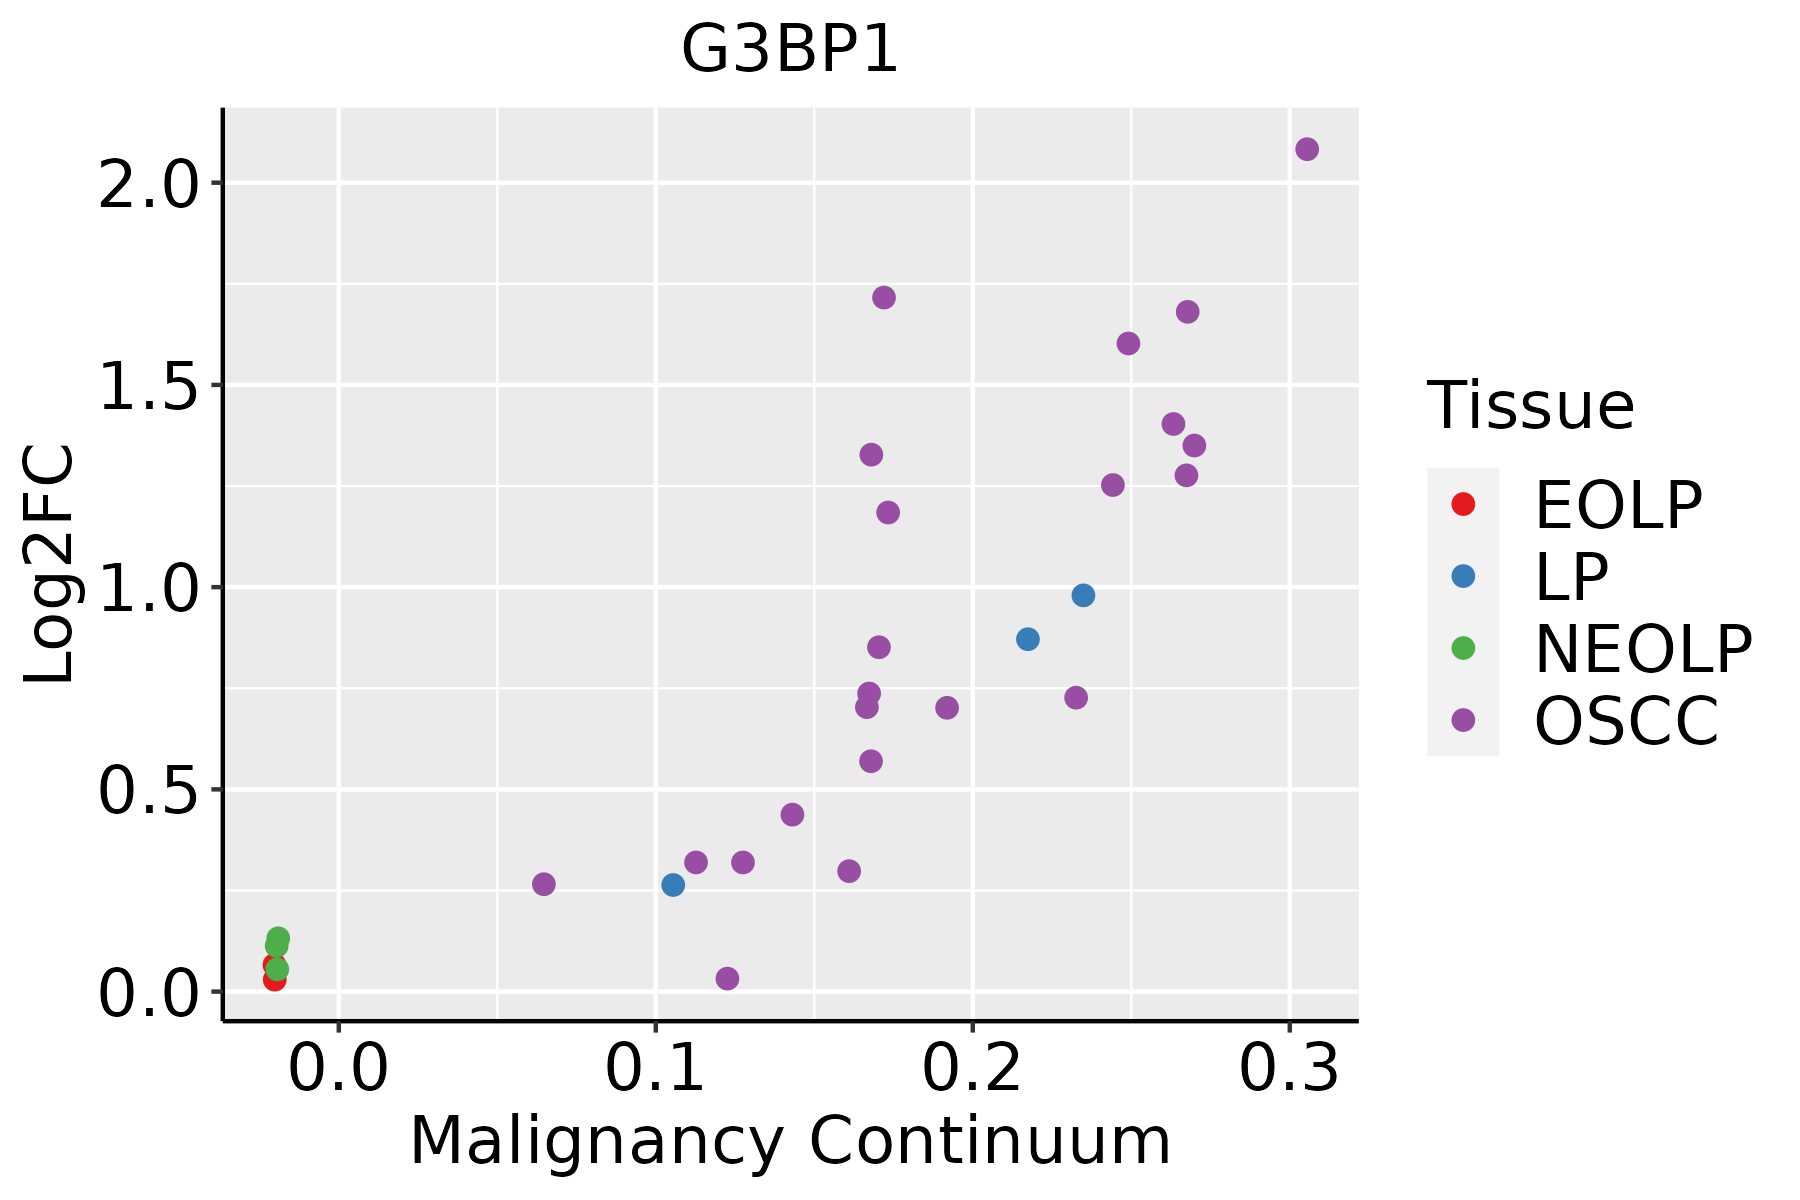 | EOLP: Erosive Oral lichen planus |
| LP: leukoplakia | ||
| NEOLP: Non-erosive oral lichen planus | ||
| OSCC: Oral squamous cell carcinoma | ||
| Prostate | 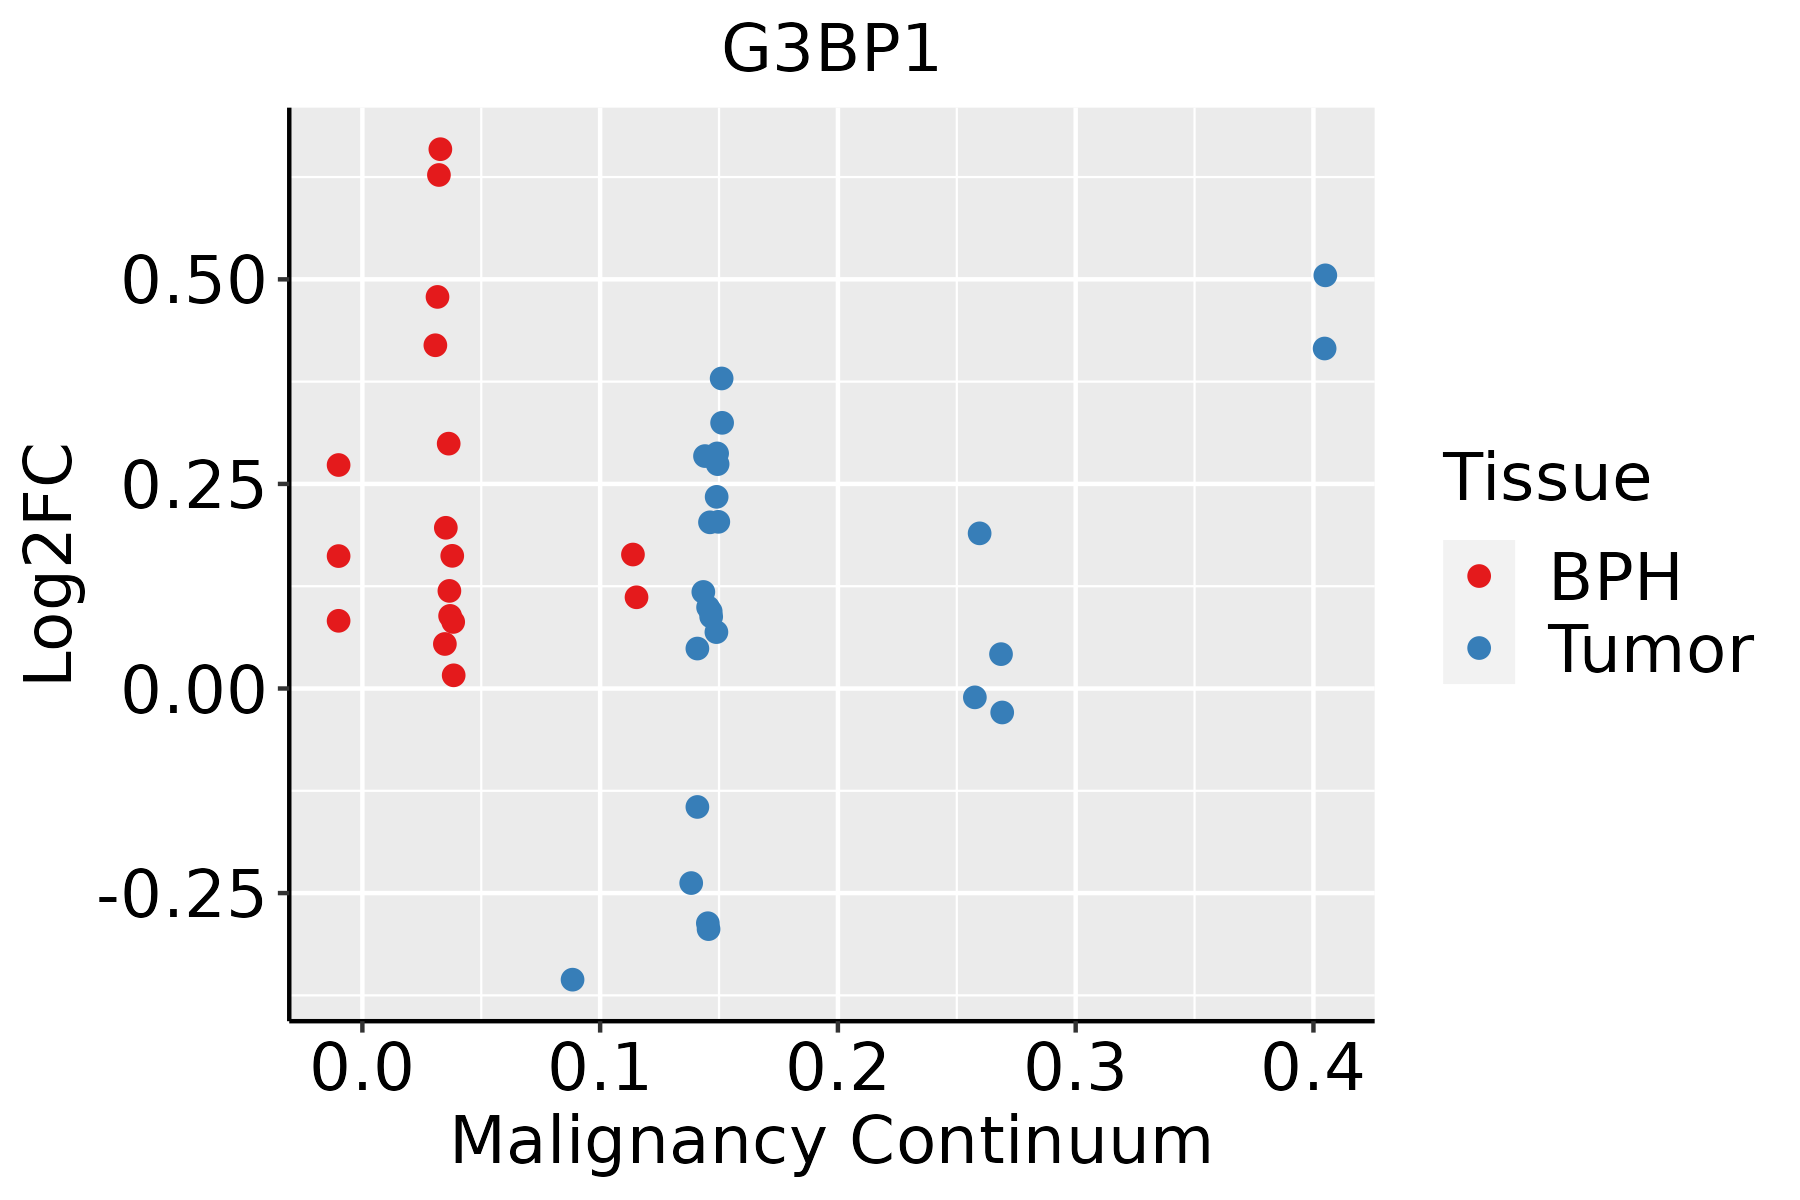 | BPH: Benign Prostatic Hyperplasia |
| Skin | 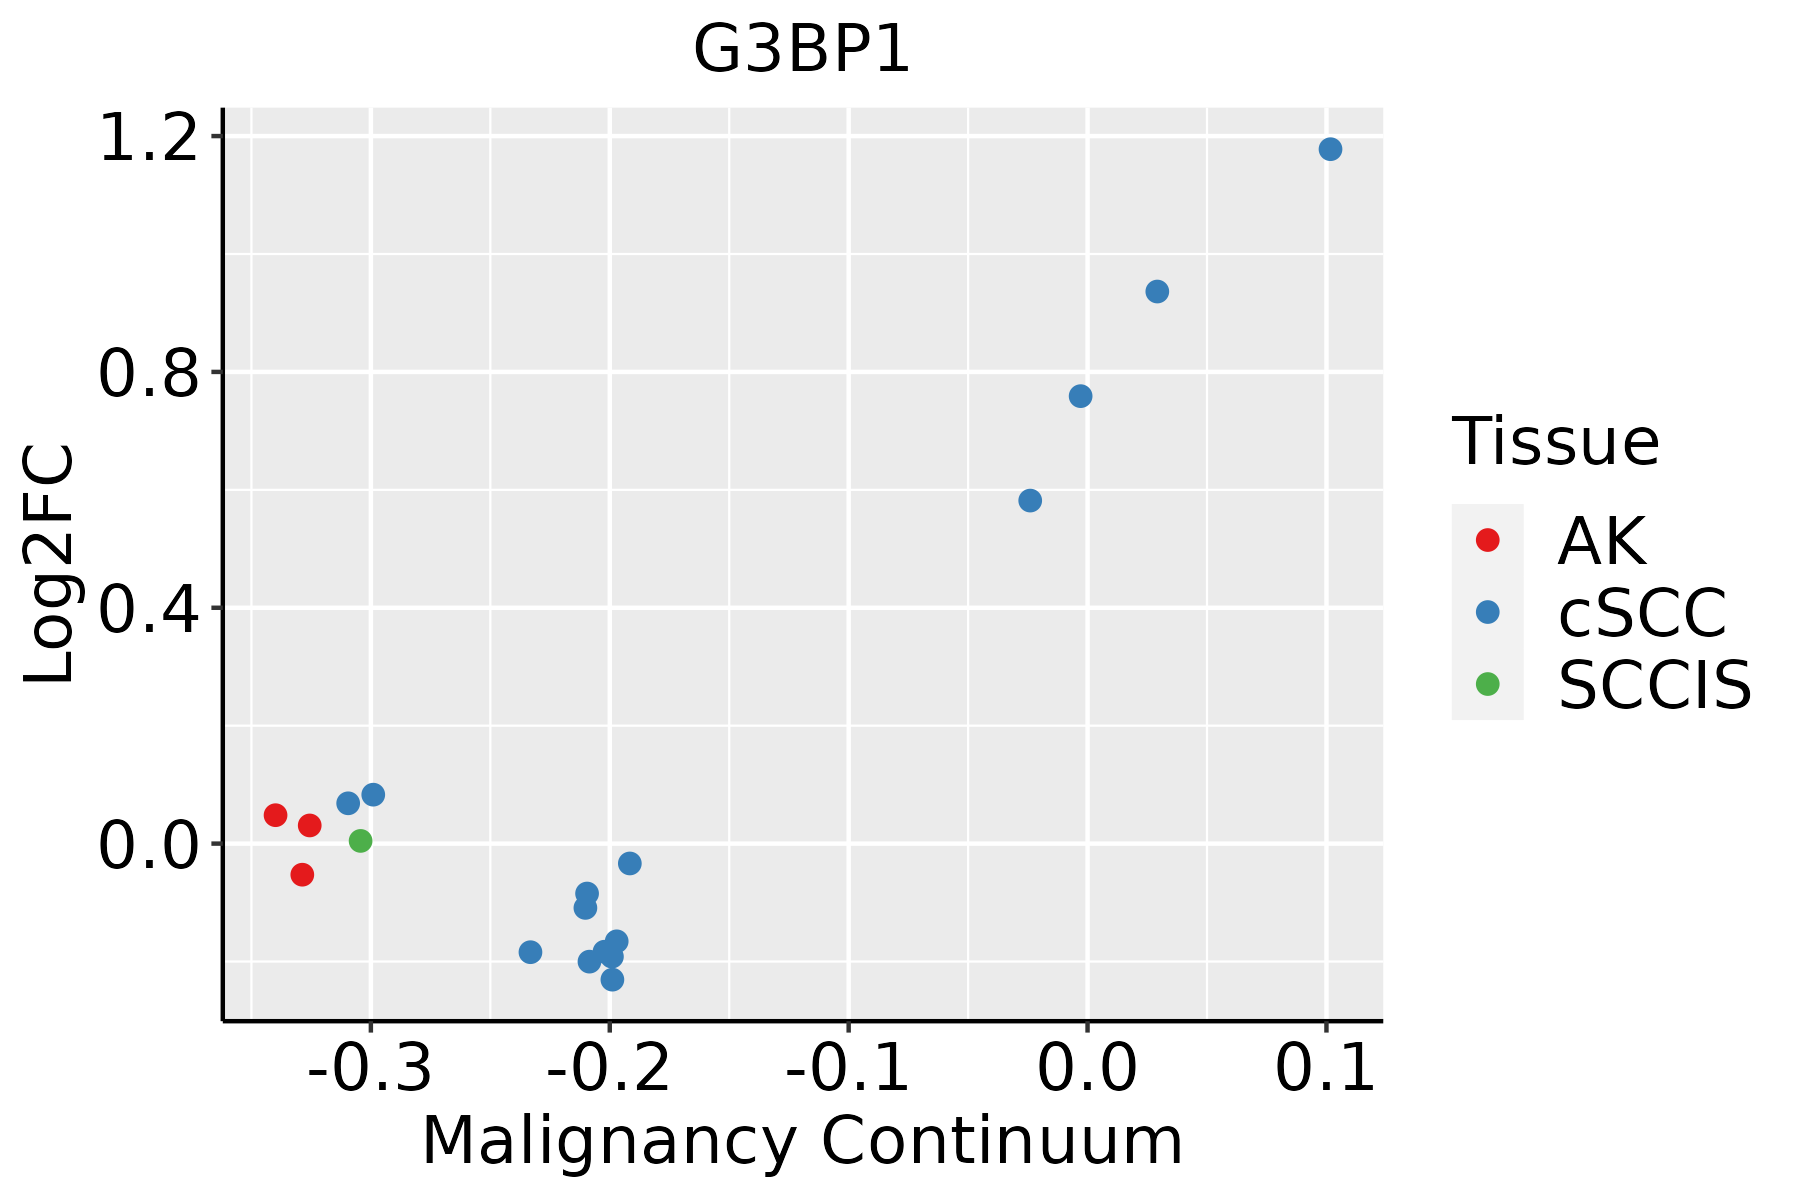 | AK: Actinic keratosis |
| cSCC: Cutaneous squamous cell carcinoma | ||
| SCCIS:squamous cell carcinoma in situ | ||
| Thyroid | 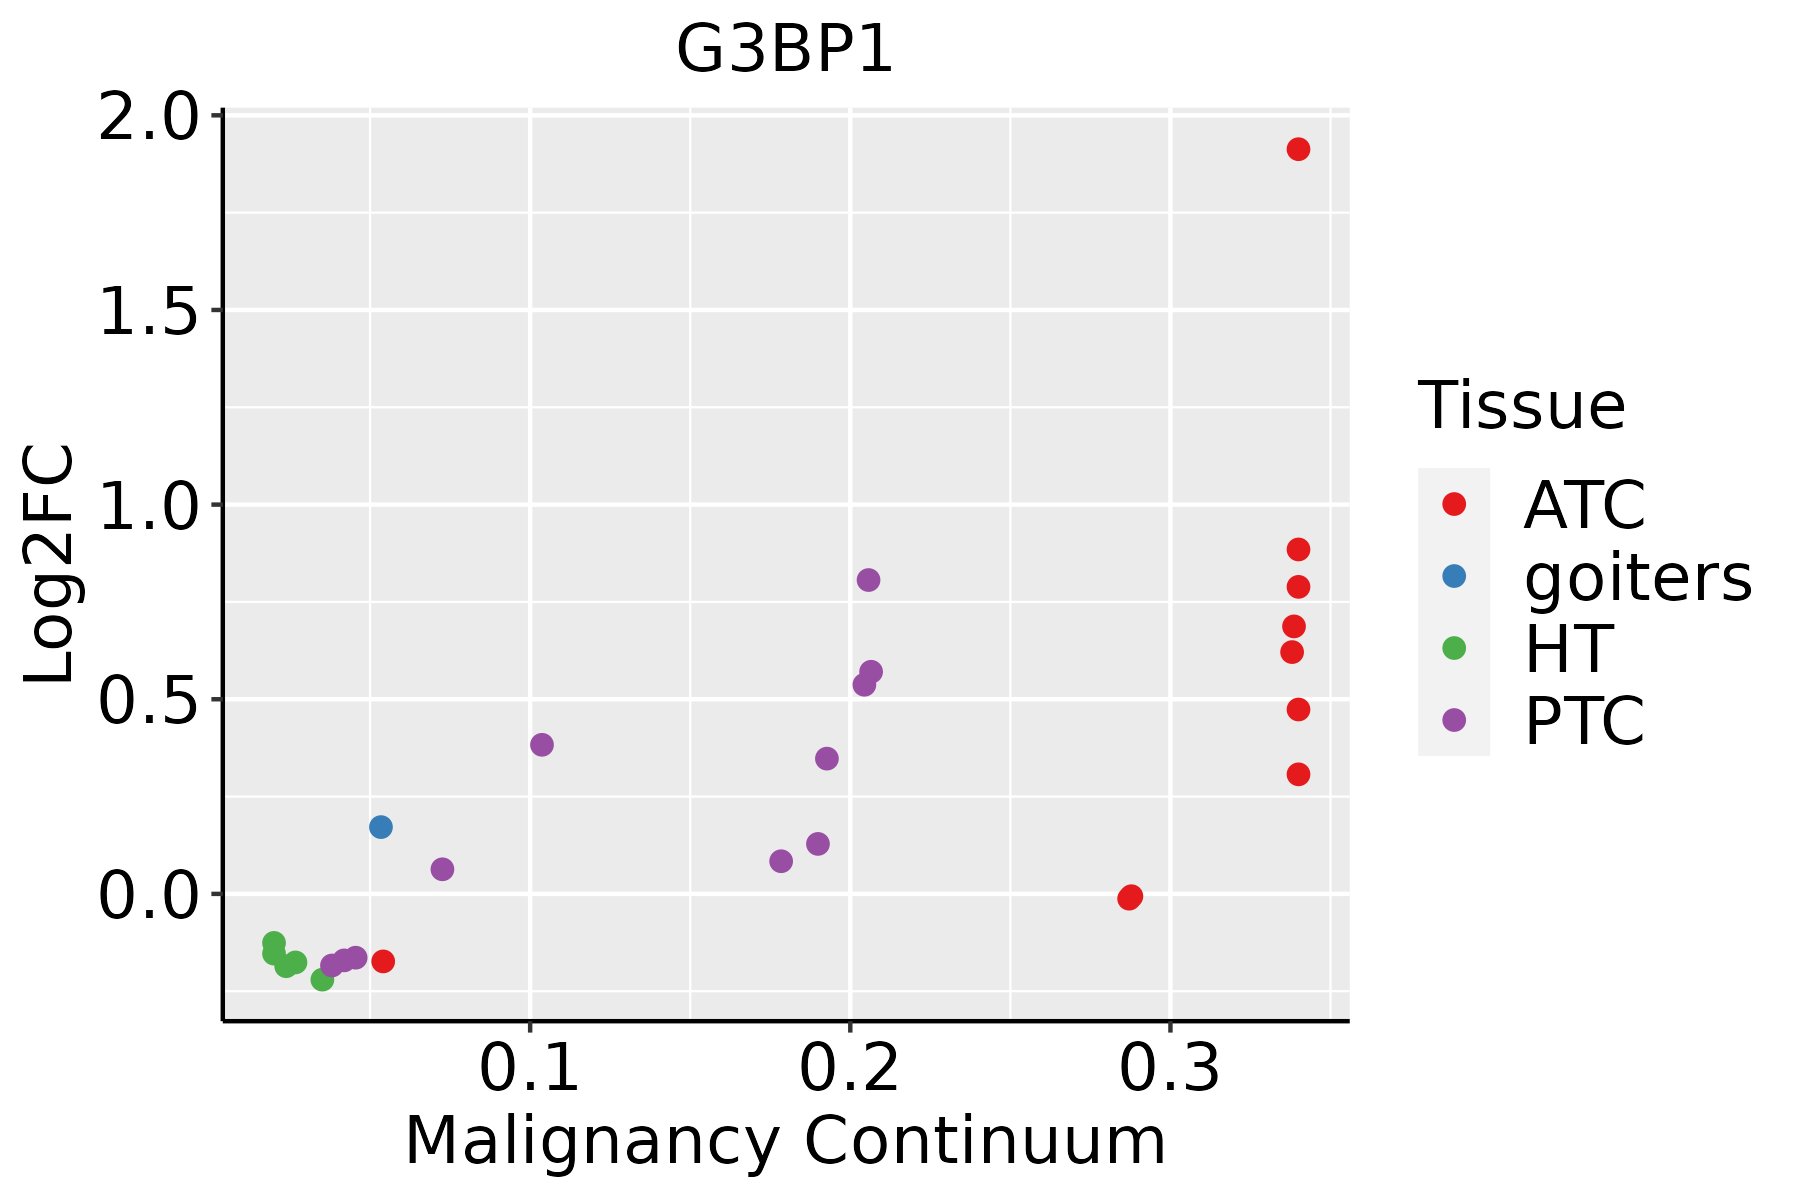 | ATC: Anaplastic thyroid cancer |
| HT: Hashimoto's thyroiditis | ||
| PTC: Papillary thyroid cancer |
| ∗log2FC in expression of this searched gene in stem-like cells from each diseased tissue sample relative to stem-like cells in normal samples in each tissue plotted against the malignancy continuum. Samples are colored based on if they are from different disease stage. |
Top |
Malignant transformation related pathway analysis |
| Find out the enriched GO biological processes and KEGG pathways involved in transition from healthy to precancer to cancer |
| Tissue | Disease Stage | Enriched GO biological Processes |
| Colorectum | AD |  |
| Colorectum | SER |  |
| Colorectum | MSS |  |
| Colorectum | MSI-H |  |
| Colorectum | FAP |  |
| ∗Top 15 enriched GO BP terms are showed in the bar plot of each disease state in each tissue. Each row represents a significant GO biological process which is colored according to the -log10(p.adjust). |
| Page: 1 2 3 4 5 6 7 8 9 |
| GO ID | Tissue | Disease Stage | Description | Gene Ratio | Bg Ratio | pvalue | p.adjust | Count |
| GO:0030111 | Colorectum | AD | regulation of Wnt signaling pathway | 102/3918 | 328/18723 | 8.51e-06 | 2.03e-04 | 102 |
| GO:0007265 | Colorectum | AD | Ras protein signal transduction | 104/3918 | 337/18723 | 1.01e-05 | 2.35e-04 | 104 |
| GO:0016055 | Colorectum | AD | Wnt signaling pathway | 130/3918 | 444/18723 | 1.60e-05 | 3.37e-04 | 130 |
| GO:0198738 | Colorectum | AD | cell-cell signaling by wnt | 130/3918 | 446/18723 | 2.02e-05 | 4.10e-04 | 130 |
| GO:0060070 | Colorectum | AD | canonical Wnt signaling pathway | 90/3918 | 303/18723 | 1.76e-04 | 2.38e-03 | 90 |
| GO:0060828 | Colorectum | AD | regulation of canonical Wnt signaling pathway | 77/3918 | 253/18723 | 2.19e-04 | 2.87e-03 | 77 |
| GO:0032481 | Colorectum | AD | positive regulation of type I interferon production | 23/3918 | 58/18723 | 8.82e-04 | 8.53e-03 | 23 |
| GO:0032392 | Colorectum | AD | DNA geometric change | 31/3918 | 90/18723 | 2.02e-03 | 1.63e-02 | 31 |
| GO:00301112 | Colorectum | MSS | regulation of Wnt signaling pathway | 98/3467 | 328/18723 | 3.37e-07 | 1.36e-05 | 98 |
| GO:00160552 | Colorectum | MSS | Wnt signaling pathway | 124/3467 | 444/18723 | 6.06e-07 | 2.26e-05 | 124 |
| GO:01987382 | Colorectum | MSS | cell-cell signaling by wnt | 124/3467 | 446/18723 | 7.83e-07 | 2.77e-05 | 124 |
| GO:00600702 | Colorectum | MSS | canonical Wnt signaling pathway | 86/3467 | 303/18723 | 1.58e-05 | 3.56e-04 | 86 |
| GO:00608282 | Colorectum | MSS | regulation of canonical Wnt signaling pathway | 74/3467 | 253/18723 | 1.99e-05 | 4.26e-04 | 74 |
| GO:00072651 | Colorectum | MSS | Ras protein signal transduction | 91/3467 | 337/18723 | 7.20e-05 | 1.21e-03 | 91 |
| GO:0030178 | Colorectum | MSS | negative regulation of Wnt signaling pathway | 48/3467 | 170/18723 | 1.23e-03 | 1.18e-02 | 48 |
| GO:00323921 | Colorectum | MSS | DNA geometric change | 29/3467 | 90/18723 | 1.26e-03 | 1.20e-02 | 29 |
| GO:00324811 | Colorectum | MSS | positive regulation of type I interferon production | 20/3467 | 58/18723 | 2.82e-03 | 2.20e-02 | 20 |
| GO:0032508 | Colorectum | MSS | DNA duplex unwinding | 25/3467 | 84/18723 | 8.27e-03 | 4.99e-02 | 25 |
| GO:00160553 | Colorectum | FAP | Wnt signaling pathway | 104/2622 | 444/18723 | 4.92e-08 | 3.92e-06 | 104 |
| GO:01987383 | Colorectum | FAP | cell-cell signaling by wnt | 104/2622 | 446/18723 | 6.26e-08 | 4.54e-06 | 104 |
| Page: 1 2 3 4 5 6 7 8 9 10 11 |
| Pathway ID | Tissue | Disease Stage | Description | Gene Ratio | Bg Ratio | pvalue | p.adjust | qvalue | Count |
| Page: 1 |
Top |
Cell-cell communication analysis |
| Identification of potential cell-cell interactions between two cell types and their ligand-receptor pairs for different disease states |
| Ligand | Receptor | LRpair | Pathway | Tissue | Disease Stage |
| Page: 1 |
Top |
Single-cell gene regulatory network inference analysis |
| Find out the significant the regulons (TFs) and the target genes of each regulon across cell types for different disease states |
| TF | Cell Type | Tissue | Disease Stage | Target Gene | RSS | Regulon Activity |
| ∗The dot plots of a searched regulon are shown for all cell subpopulations in each disease state of each tissue based on the regulon specific score inferred using pySCENIC and by calculating the average expression. |
| Page: 1 |
Top |
Somatic mutation of malignant transformation related genes |
| Annotation of somatic variants for genes involved in malignant transformation |
| Hugo Symbol | Variant Class | Variant Classification | dbSNP RS | HGVSc | HGVSp | HGVSp Short | SWISSPROT | BIOTYPE | SIFT | PolyPhen | Tumor Sample Barcode | Tissue | Histology | Sex | Age | Stage | Therapy Types | Drugs | Outcome |
| G3BP1 | SNV | Missense_Mutation | c.865N>A | p.Glu289Lys | p.E289K | Q13283 | protein_coding | tolerated(0.06) | benign(0.007) | TCGA-A2-A0YK-01 | Breast | breast invasive carcinoma | Female | <65 | I/II | Chemotherapy | cytoxan | SD | |
| G3BP1 | SNV | Missense_Mutation | c.1247N>A | p.Arg416Gln | p.R416Q | Q13283 | protein_coding | tolerated(0.06) | benign(0.058) | TCGA-BH-A0B3-01 | Breast | breast invasive carcinoma | Female | <65 | I/II | Chemotherapy | cyclophosphamide | SD | |
| G3BP1 | SNV | Missense_Mutation | novel | c.460N>C | p.Glu154Gln | p.E154Q | Q13283 | protein_coding | deleterious(0.02) | probably_damaging(0.96) | TCGA-BH-A0BA-01 | Breast | breast invasive carcinoma | Female | <65 | III/IV | Chemotherapy | cytoxan | SD |
| G3BP1 | SNV | Missense_Mutation | c.1391N>T | p.Pro464Leu | p.P464L | Q13283 | protein_coding | deleterious_low_confidence(0.01) | benign(0.051) | TCGA-BH-A0HF-01 | Breast | breast invasive carcinoma | Female | >=65 | I/II | Hormone Therapy | arimidex | SD | |
| G3BP1 | SNV | Missense_Mutation | c.775C>G | p.Leu259Val | p.L259V | Q13283 | protein_coding | tolerated(0.11) | possibly_damaging(0.883) | TCGA-E2-A159-01 | Breast | breast invasive carcinoma | Female | <65 | I/II | Chemotherapy | cyclophosphamide | SD | |
| G3BP1 | SNV | Missense_Mutation | c.901N>G | p.Gln301Glu | p.Q301E | Q13283 | protein_coding | tolerated(0.09) | benign(0.001) | TCGA-EW-A1PB-01 | Breast | breast invasive carcinoma | Female | >=65 | III/IV | Unknown | Unknown | SD | |
| G3BP1 | SNV | Missense_Mutation | novel | c.649C>G | p.Pro217Ala | p.P217A | Q13283 | protein_coding | tolerated(0.45) | benign(0) | TCGA-5M-AAT4-01 | Colorectum | colon adenocarcinoma | Male | >=65 | III/IV | Unknown | Unknown | PD |
| G3BP1 | SNV | Missense_Mutation | novel | c.488N>A | p.Pro163His | p.P163H | Q13283 | protein_coding | deleterious(0) | probably_damaging(0.98) | TCGA-A6-2672-01 | Colorectum | colon adenocarcinoma | Female | >=65 | III/IV | Unknown | Unknown | SD |
| G3BP1 | SNV | Missense_Mutation | c.344C>T | p.Ala115Val | p.A115V | Q13283 | protein_coding | tolerated(0.08) | benign(0.232) | TCGA-AA-3663-01 | Colorectum | colon adenocarcinoma | Male | <65 | I/II | Unknown | Unknown | SD | |
| G3BP1 | SNV | Missense_Mutation | c.1280G>A | p.Arg427His | p.R427H | Q13283 | protein_coding | tolerated(0.28) | benign(0.003) | TCGA-AA-3864-01 | Colorectum | colon adenocarcinoma | Male | >=65 | I/II | Unknown | Unknown | SD |
| Page: 1 2 3 4 5 6 7 8 |
Top |
Related drugs of malignant transformation related genes |
| Identification of chemicals and drugs interact with genes involved in malignant transfromation |
| (DGIdb 4.0) |
| Entrez ID | Symbol | Category | Interaction Types | Drug Claim Name | Drug Name | PMIDs |
| Page: 1 |

Copyright 2023-Present -The University of Texas Health Science Center at Houston |