
|
|||||
|
 | |
| |
| |
| |
| |
| |
|
Gene: G0S2 |
Gene summary for G0S2 |
| Gene information | Species | Human | Gene symbol | G0S2 | Gene ID | 50486 |
| Gene name | G0/G1 switch 2 | |
| Gene Alias | G0S2 | |
| Cytomap | 1q32.2 | |
| Gene Type | protein-coding | GO ID | GO:0001659 | UniProtAcc | P27469 |
Top |
Malignant transformation analysis |
| Identification of the aberrant gene expression in precancerous and cancerous lesions by comparing the gene expression of stem-like cells in diseased tissues with normal stem cells |
| Entrez ID | Symbol | Replicates | Species | Organ | Tissue | Adj P-value | Log2FC | Malignancy |
| 50486 | G0S2 | LZE24T | Human | Esophagus | ESCC | 1.45e-04 | -3.06e-01 | 0.0596 |
| 50486 | G0S2 | P2T-E | Human | Esophagus | ESCC | 4.37e-05 | -2.81e-01 | 0.1177 |
| 50486 | G0S2 | P9T-E | Human | Esophagus | ESCC | 4.52e-03 | -2.78e-01 | 0.1131 |
| 50486 | G0S2 | P15T-E | Human | Esophagus | ESCC | 2.90e-02 | -2.25e-01 | 0.1149 |
| 50486 | G0S2 | P16T-E | Human | Esophagus | ESCC | 4.74e-06 | -3.13e-01 | 0.1153 |
| 50486 | G0S2 | P22T-E | Human | Esophagus | ESCC | 7.64e-05 | -3.21e-01 | 0.1236 |
| 50486 | G0S2 | P26T-E | Human | Esophagus | ESCC | 7.90e-05 | -3.03e-01 | 0.1276 |
| 50486 | G0S2 | P28T-E | Human | Esophagus | ESCC | 3.87e-03 | -2.83e-01 | 0.1149 |
| 50486 | G0S2 | P37T-E | Human | Esophagus | ESCC | 3.36e-11 | 1.62e+00 | 0.1371 |
| 50486 | G0S2 | P39T-E | Human | Esophagus | ESCC | 1.20e-02 | -3.09e-01 | 0.0894 |
| 50486 | G0S2 | P42T-E | Human | Esophagus | ESCC | 1.81e-03 | -3.11e-01 | 0.1175 |
| 50486 | G0S2 | P61T-E | Human | Esophagus | ESCC | 4.75e-05 | -3.05e-01 | 0.099 |
| 50486 | G0S2 | P75T-E | Human | Esophagus | ESCC | 4.49e-02 | 1.45e+00 | 0.1125 |
| 50486 | G0S2 | P76T-E | Human | Esophagus | ESCC | 3.51e-02 | 6.47e-01 | 0.1207 |
| 50486 | G0S2 | P80T-E | Human | Esophagus | ESCC | 3.53e-02 | -2.93e-01 | 0.155 |
| 50486 | G0S2 | P89T-E | Human | Esophagus | ESCC | 8.74e-03 | 4.35e+00 | 0.1752 |
| 50486 | G0S2 | P107T-E | Human | Esophagus | ESCC | 1.05e-05 | -3.10e-01 | 0.171 |
| 50486 | G0S2 | P127T-E | Human | Esophagus | ESCC | 3.60e-08 | -3.06e-01 | 0.0826 |
| 50486 | G0S2 | P130T-E | Human | Esophagus | ESCC | 3.73e-05 | 1.85e+00 | 0.1676 |
| 50486 | G0S2 | HCC1_Meng | Human | Liver | HCC | 5.60e-09 | -3.13e-01 | 0.0246 |
| Page: 1 2 3 4 |
| Tissue | Expression Dynamics | Abbreviation |
| Esophagus | 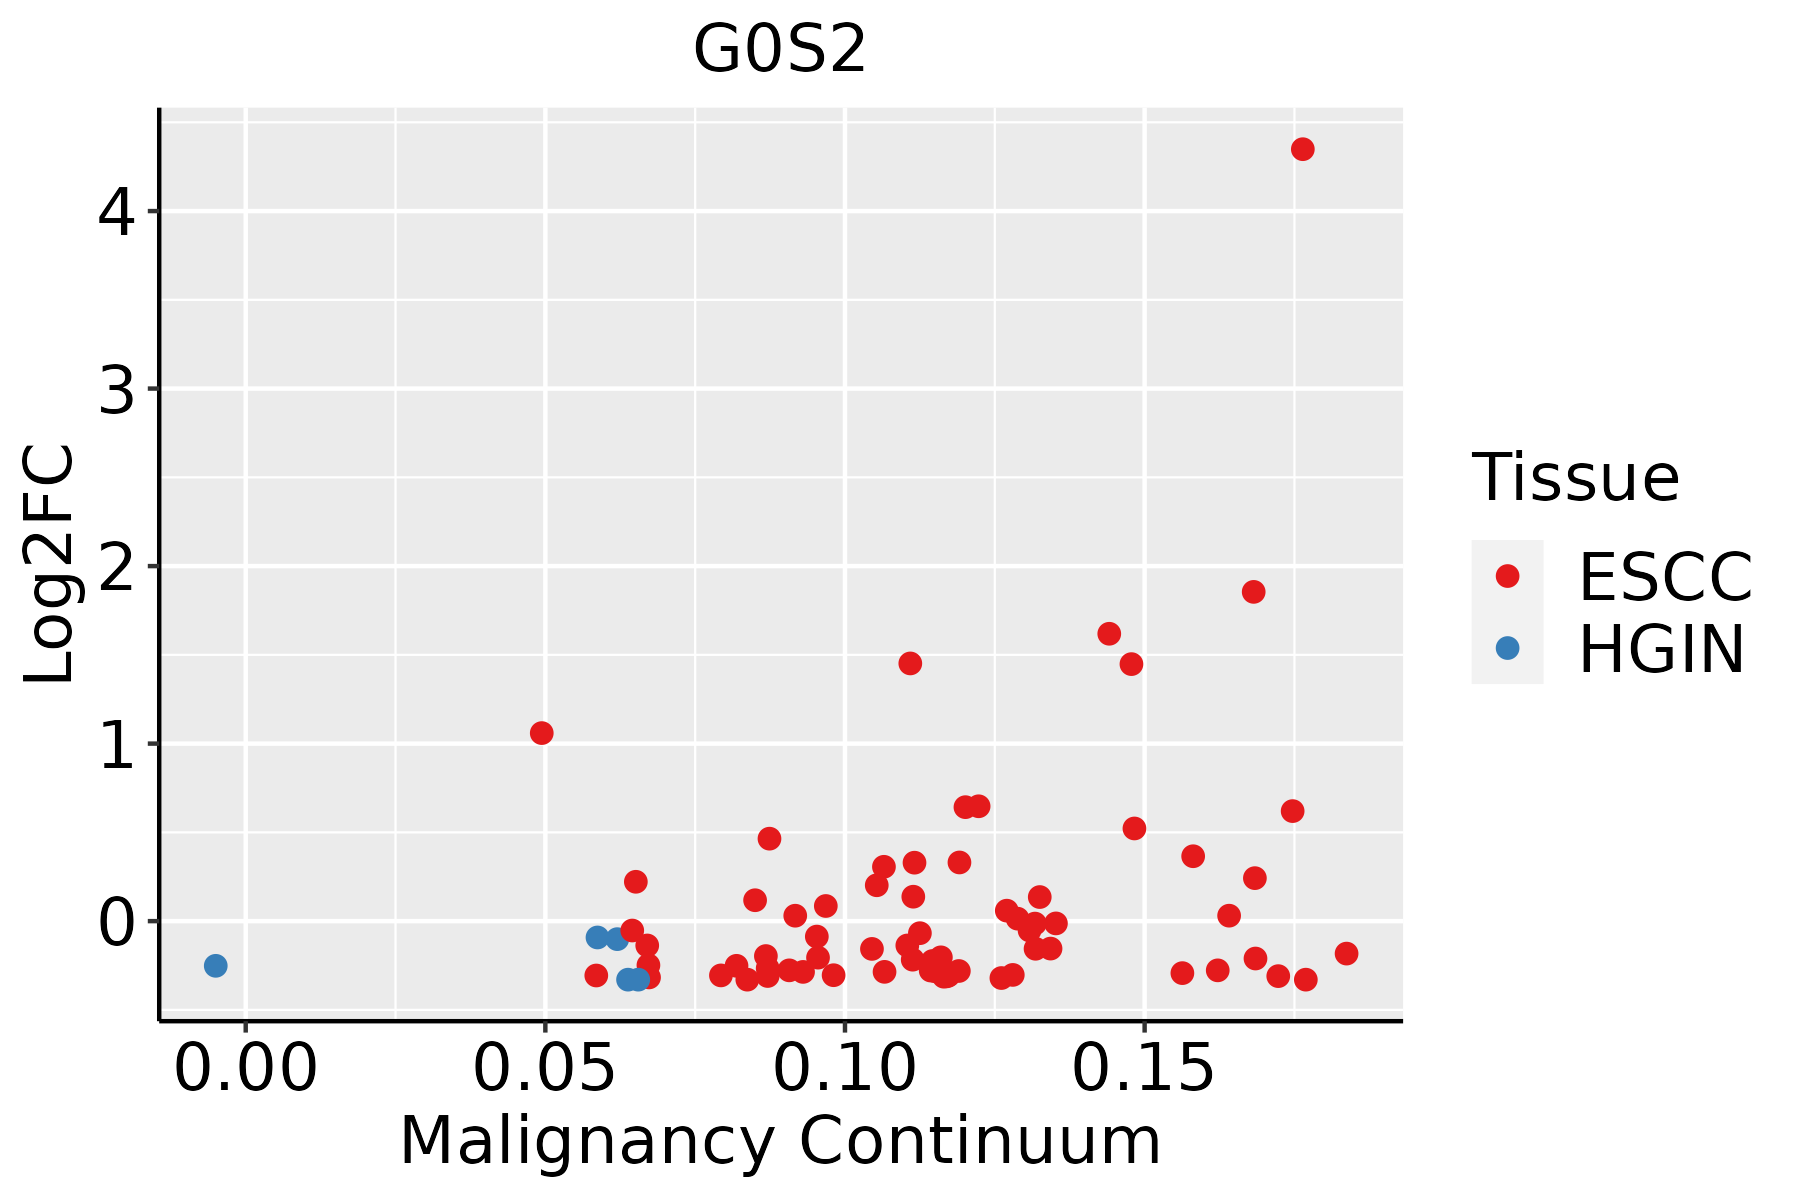 | ESCC: Esophageal squamous cell carcinoma |
| HGIN: High-grade intraepithelial neoplasias | ||
| LGIN: Low-grade intraepithelial neoplasias | ||
| Liver |  | HCC: Hepatocellular carcinoma |
| NAFLD: Non-alcoholic fatty liver disease | ||
| Oral Cavity | 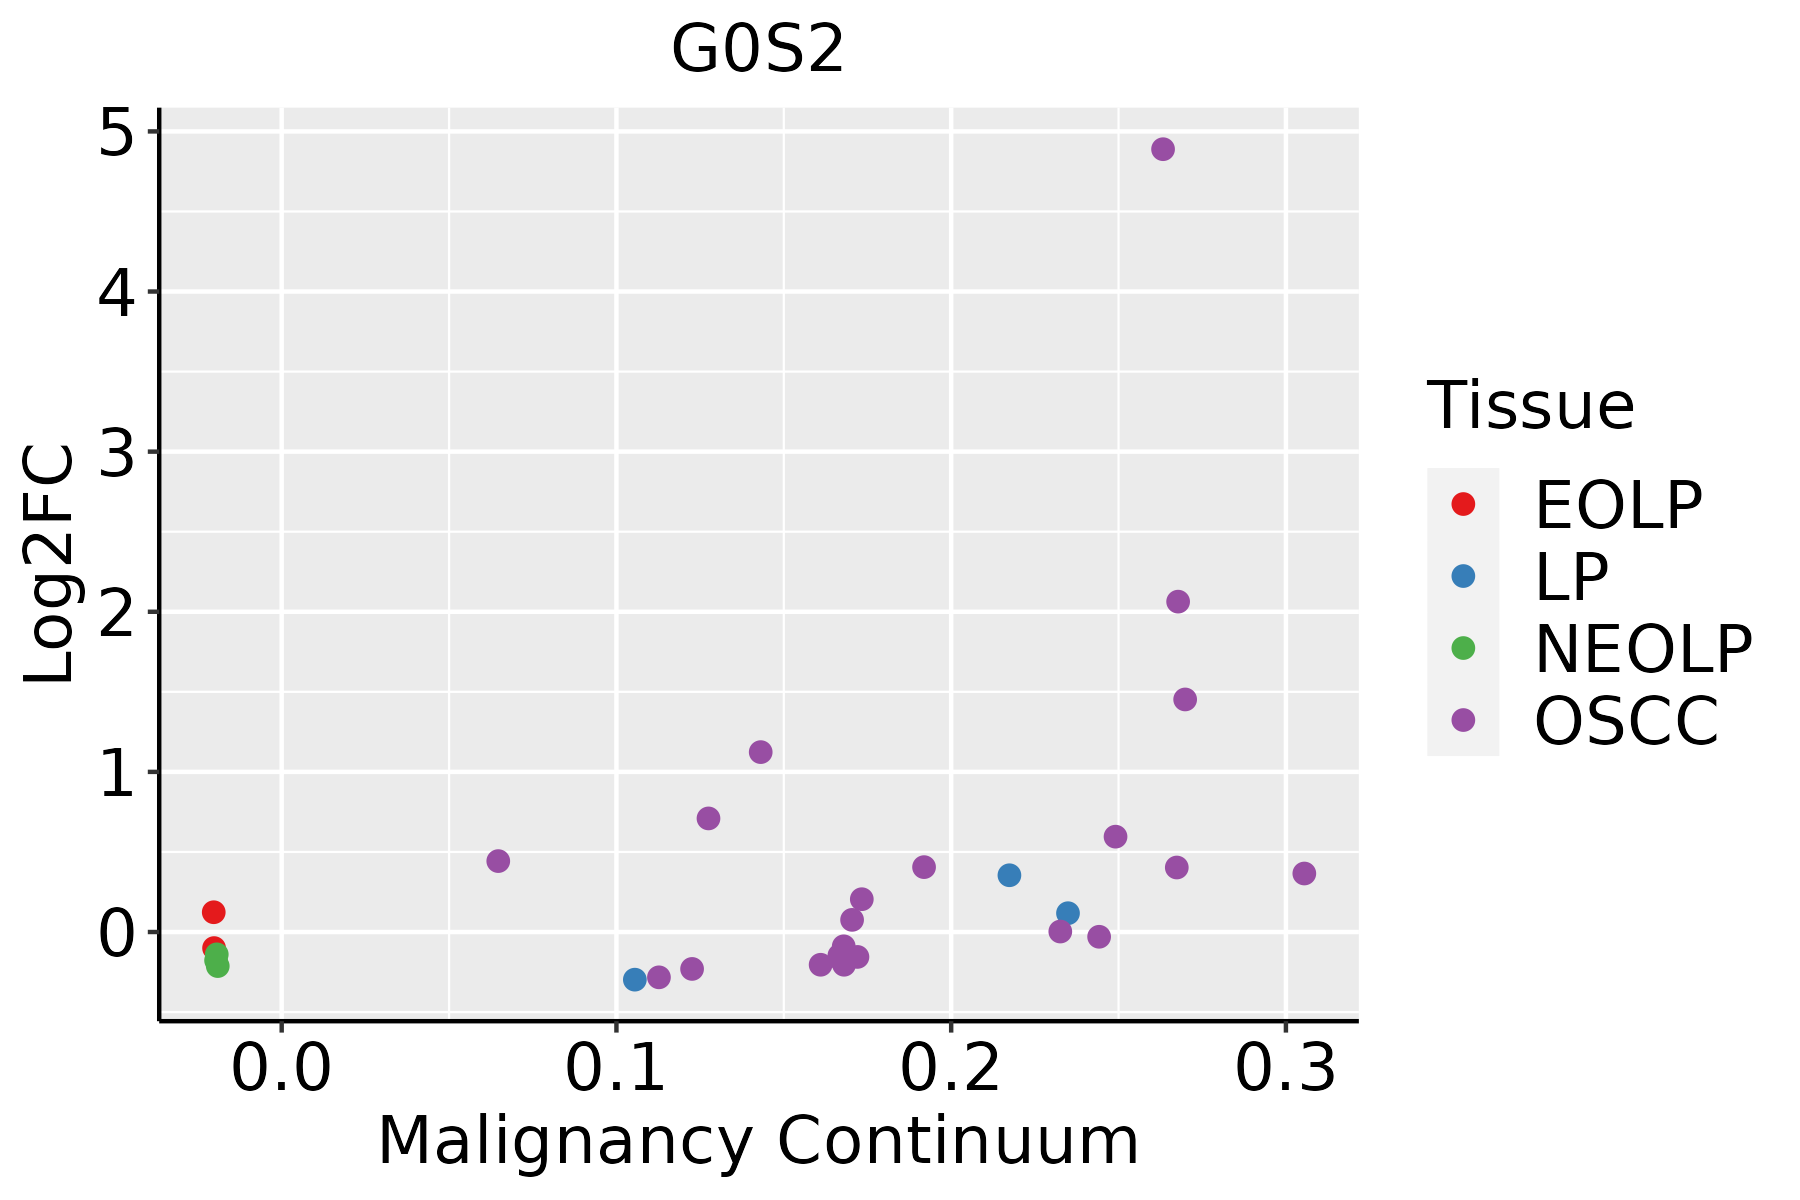 | EOLP: Erosive Oral lichen planus |
| LP: leukoplakia | ||
| NEOLP: Non-erosive oral lichen planus | ||
| OSCC: Oral squamous cell carcinoma | ||
| Skin | 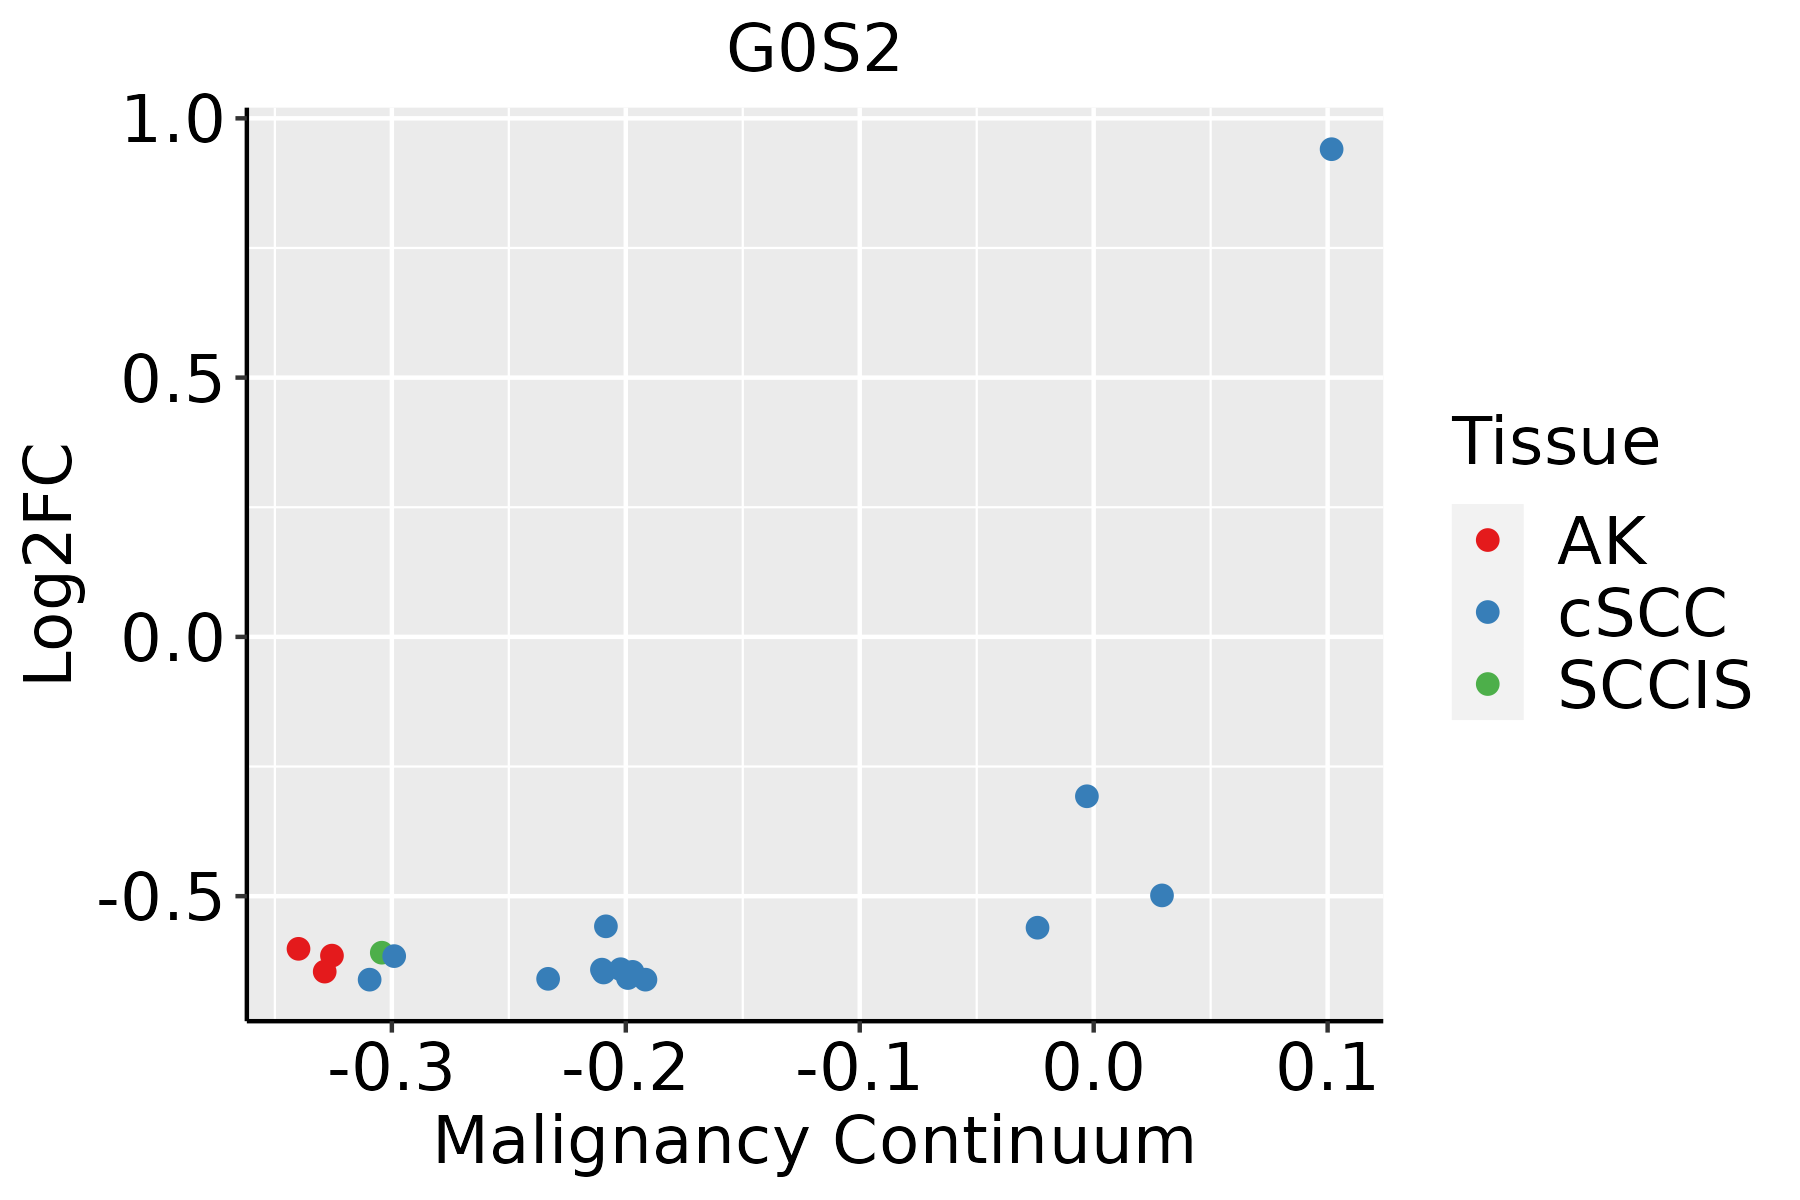 | AK: Actinic keratosis |
| cSCC: Cutaneous squamous cell carcinoma | ||
| SCCIS:squamous cell carcinoma in situ | ||
| Thyroid | 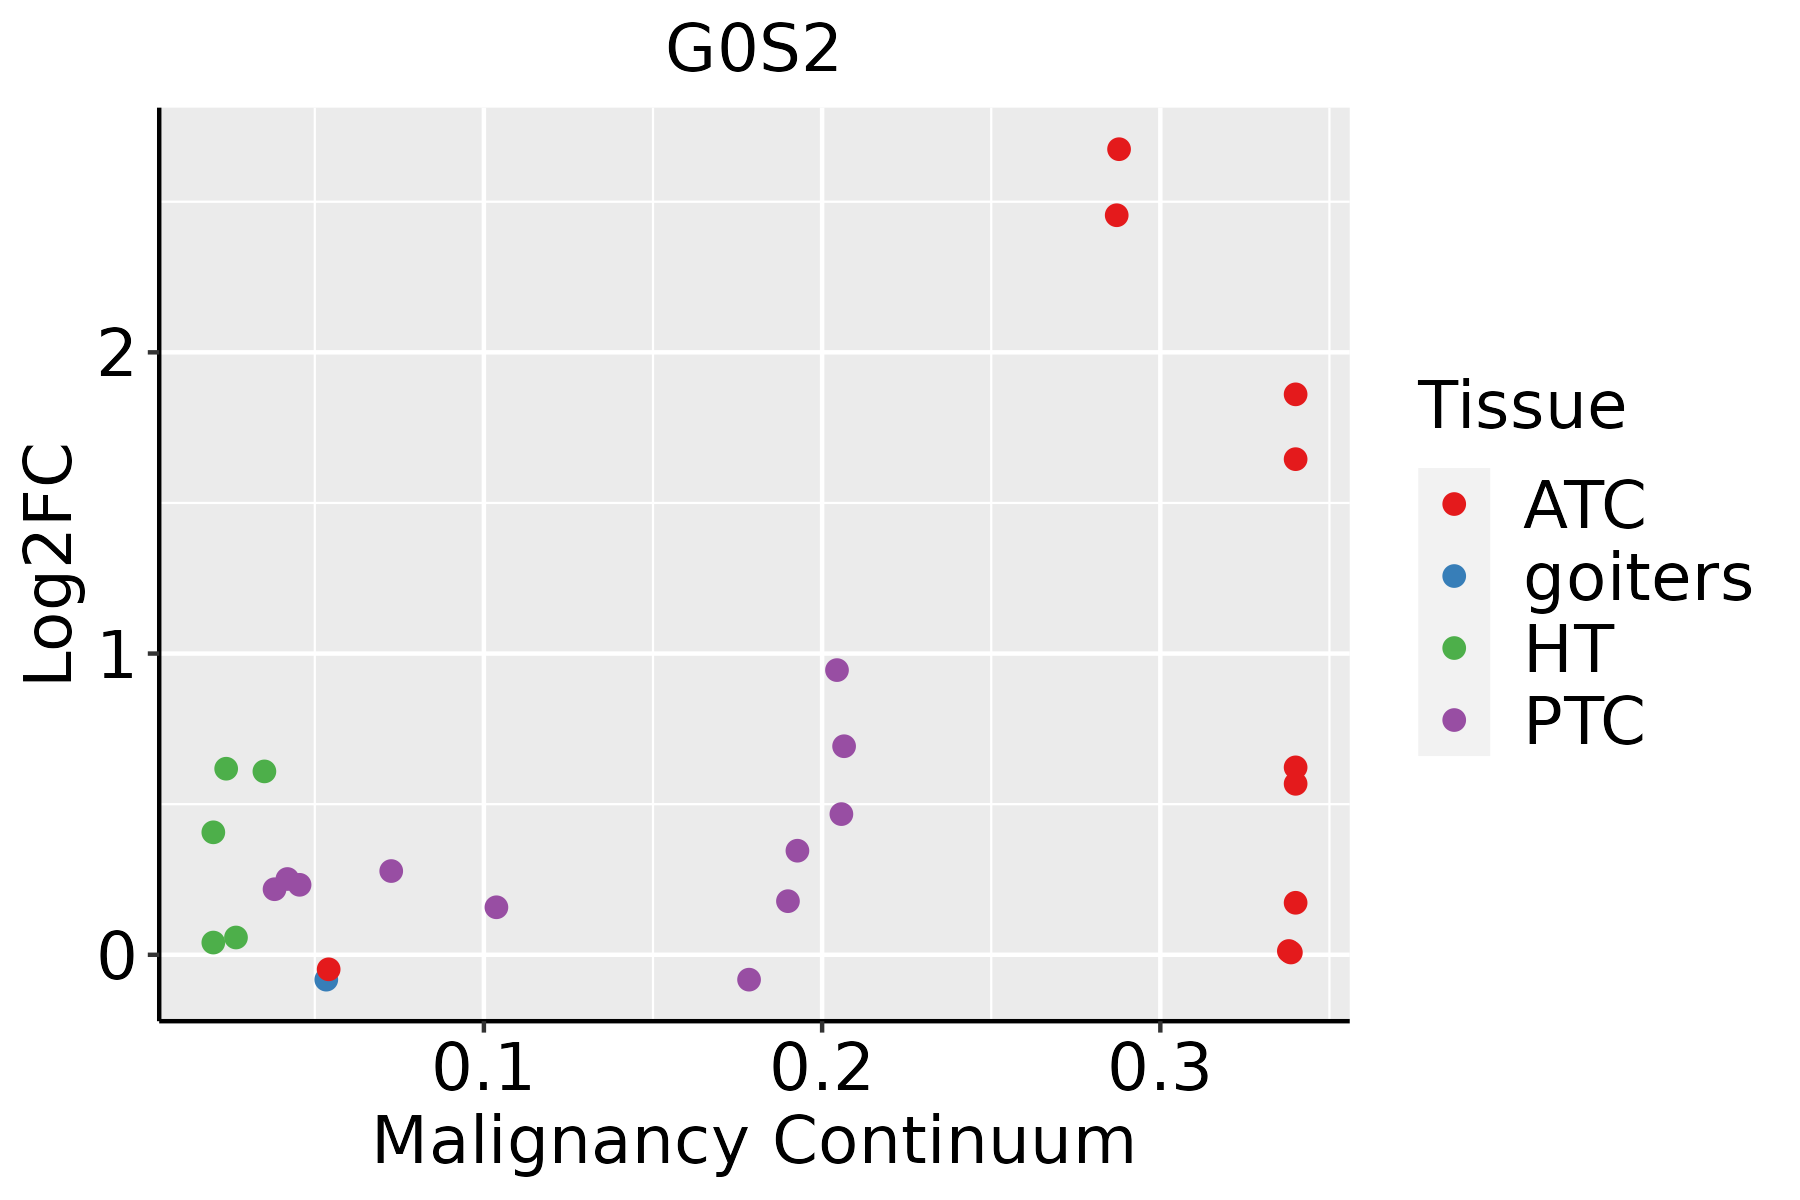 | ATC: Anaplastic thyroid cancer |
| HT: Hashimoto's thyroiditis | ||
| PTC: Papillary thyroid cancer |
| ∗log2FC in expression of this searched gene in stem-like cells from each diseased tissue sample relative to stem-like cells in normal samples in each tissue plotted against the malignancy continuum. Samples are colored based on if they are from different disease stage. |
Top |
Malignant transformation related pathway analysis |
| Find out the enriched GO biological processes and KEGG pathways involved in transition from healthy to precancer to cancer |
| Tissue | Disease Stage | Enriched GO biological Processes |
| Colorectum | AD |  |
| Colorectum | SER |  |
| Colorectum | MSS |  |
| Colorectum | MSI-H |  |
| Colorectum | FAP |  |
| ∗Top 15 enriched GO BP terms are showed in the bar plot of each disease state in each tissue. Each row represents a significant GO biological process which is colored according to the -log10(p.adjust). |
| Page: 1 2 3 4 5 6 7 8 9 |
| GO ID | Tissue | Disease Stage | Description | Gene Ratio | Bg Ratio | pvalue | p.adjust | Count |
| GO:2001233111 | Esophagus | ESCC | regulation of apoptotic signaling pathway | 256/8552 | 356/18723 | 4.11e-24 | 1.04e-21 | 256 |
| GO:0097191111 | Esophagus | ESCC | extrinsic apoptotic signaling pathway | 159/8552 | 219/18723 | 4.12e-16 | 2.94e-14 | 159 |
| GO:2001236111 | Esophagus | ESCC | regulation of extrinsic apoptotic signaling pathway | 111/8552 | 151/18723 | 2.97e-12 | 1.18e-10 | 111 |
| GO:2001235110 | Esophagus | ESCC | positive regulation of apoptotic signaling pathway | 92/8552 | 126/18723 | 3.91e-10 | 1.05e-08 | 92 |
| GO:200123817 | Esophagus | ESCC | positive regulation of extrinsic apoptotic signaling pathway | 40/8552 | 48/18723 | 8.03e-08 | 1.39e-06 | 40 |
| GO:01201624 | Esophagus | ESCC | positive regulation of cold-induced thermogenesis | 57/8552 | 97/18723 | 6.43e-03 | 2.35e-02 | 57 |
| GO:01061066 | Esophagus | ESCC | cold-induced thermogenesis | 80/8552 | 144/18723 | 1.07e-02 | 3.65e-02 | 80 |
| GO:01201616 | Esophagus | ESCC | regulation of cold-induced thermogenesis | 80/8552 | 144/18723 | 1.07e-02 | 3.65e-02 | 80 |
| GO:200123312 | Liver | Cirrhotic | regulation of apoptotic signaling pathway | 163/4634 | 356/18723 | 2.62e-18 | 4.43e-16 | 163 |
| GO:009719112 | Liver | Cirrhotic | extrinsic apoptotic signaling pathway | 97/4634 | 219/18723 | 1.82e-10 | 9.11e-09 | 97 |
| GO:200123612 | Liver | Cirrhotic | regulation of extrinsic apoptotic signaling pathway | 72/4634 | 151/18723 | 7.80e-10 | 3.62e-08 | 72 |
| GO:200123512 | Liver | Cirrhotic | positive regulation of apoptotic signaling pathway | 60/4634 | 126/18723 | 2.08e-08 | 7.47e-07 | 60 |
| GO:20012383 | Liver | Cirrhotic | positive regulation of extrinsic apoptotic signaling pathway | 27/4634 | 48/18723 | 3.07e-06 | 5.41e-05 | 27 |
| GO:200123322 | Liver | HCC | regulation of apoptotic signaling pathway | 226/7958 | 356/18723 | 7.26e-16 | 5.68e-14 | 226 |
| GO:009719122 | Liver | HCC | extrinsic apoptotic signaling pathway | 143/7958 | 219/18723 | 6.99e-12 | 2.97e-10 | 143 |
| GO:200123621 | Liver | HCC | regulation of extrinsic apoptotic signaling pathway | 98/7958 | 151/18723 | 2.17e-08 | 5.08e-07 | 98 |
| GO:200123522 | Liver | HCC | positive regulation of apoptotic signaling pathway | 79/7958 | 126/18723 | 3.70e-06 | 4.82e-05 | 79 |
| GO:200123811 | Liver | HCC | positive regulation of extrinsic apoptotic signaling pathway | 33/7958 | 48/18723 | 2.12e-04 | 1.63e-03 | 33 |
| GO:010610611 | Liver | HCC | cold-induced thermogenesis | 76/7958 | 144/18723 | 8.07e-03 | 3.18e-02 | 76 |
| GO:012016111 | Liver | HCC | regulation of cold-induced thermogenesis | 76/7958 | 144/18723 | 8.07e-03 | 3.18e-02 | 76 |
| Page: 1 2 3 4 |
| Pathway ID | Tissue | Disease Stage | Description | Gene Ratio | Bg Ratio | pvalue | p.adjust | qvalue | Count |
| Page: 1 |
Top |
Cell-cell communication analysis |
| Identification of potential cell-cell interactions between two cell types and their ligand-receptor pairs for different disease states |
| Ligand | Receptor | LRpair | Pathway | Tissue | Disease Stage |
| Page: 1 |
Top |
Single-cell gene regulatory network inference analysis |
| Find out the significant the regulons (TFs) and the target genes of each regulon across cell types for different disease states |
| TF | Cell Type | Tissue | Disease Stage | Target Gene | RSS | Regulon Activity |
| ∗The dot plots of a searched regulon are shown for all cell subpopulations in each disease state of each tissue based on the regulon specific score inferred using pySCENIC and by calculating the average expression. |
| Page: 1 |
Top |
Somatic mutation of malignant transformation related genes |
| Annotation of somatic variants for genes involved in malignant transformation |
| Hugo Symbol | Variant Class | Variant Classification | dbSNP RS | HGVSc | HGVSp | HGVSp Short | SWISSPROT | BIOTYPE | SIFT | PolyPhen | Tumor Sample Barcode | Tissue | Histology | Sex | Age | Stage | Therapy Types | Drugs | Outcome |
| G0S2 | SNV | Missense_Mutation | novel | c.4G>C | p.Glu2Gln | p.E2Q | P27469 | protein_coding | deleterious(0) | probably_damaging(0.974) | TCGA-EW-A6SA-01 | Breast | breast invasive carcinoma | Male | <65 | I/II | Unknown | Unknown | SD |
| G0S2 | SNV | Missense_Mutation | rs780530900 | c.89G>A | p.Gly30Asp | p.G30D | P27469 | protein_coding | deleterious(0) | probably_damaging(1) | TCGA-A5-A1OF-01 | Endometrium | uterine corpus endometrioid carcinoma | Female | <65 | I/II | Unknown | Unknown | SD |
| G0S2 | SNV | Missense_Mutation | novel | c.194N>G | p.Glu65Gly | p.E65G | P27469 | protein_coding | tolerated(0.13) | benign(0.037) | TCGA-AX-A2HJ-01 | Endometrium | uterine corpus endometrioid carcinoma | Female | <65 | I/II | Unknown | Unknown | SD |
| G0S2 | SNV | Missense_Mutation | novel | c.304G>A | p.Ala102Thr | p.A102T | P27469 | protein_coding | deleterious(0) | probably_damaging(0.981) | TCGA-85-8288-01 | Lung | lung squamous cell carcinoma | Male | >=65 | I/II | Unknown | Unknown | SD |
| G0S2 | SNV | Missense_Mutation | rs753202670 | c.295C>T | p.Arg99Trp | p.R99W | P27469 | protein_coding | deleterious(0) | probably_damaging(0.999) | TCGA-CR-5248-01 | Oral cavity | head & neck squamous cell carcinoma | Male | <65 | I/II | Chemotherapy | oxaliplatin | PD |
| G0S2 | SNV | Missense_Mutation | rs775447110 | c.241C>A | p.Gln81Lys | p.Q81K | P27469 | protein_coding | tolerated(0.57) | benign(0.015) | TCGA-BR-6458-01 | Stomach | stomach adenocarcinoma | Female | <65 | I/II | Chemotherapy | 5-fluorouracil | PD |
| G0S2 | SNV | Missense_Mutation | novel | c.304N>A | p.Ala102Thr | p.A102T | P27469 | protein_coding | deleterious(0) | probably_damaging(0.981) | TCGA-HF-A5NB-01 | Stomach | stomach adenocarcinoma | Female | >=65 | III/IV | Chemotherapy | fluorouracil | SD |
| Page: 1 |
Top |
Related drugs of malignant transformation related genes |
| Identification of chemicals and drugs interact with genes involved in malignant transfromation |
| (DGIdb 4.0) |
| Entrez ID | Symbol | Category | Interaction Types | Drug Claim Name | Drug Name | PMIDs |
| Page: 1 |

Copyright 2023-Present -The University of Texas Health Science Center at Houston |