
|
|||||
|
 | |
| |
| |
| |
| |
| |
|
Gene: FZD7 |
Gene summary for FZD7 |
| Gene information | Species | Human | Gene symbol | FZD7 | Gene ID | 8324 |
| Gene name | frizzled class receptor 7 | |
| Gene Alias | FzE3 | |
| Cytomap | 2q33.1 | |
| Gene Type | protein-coding | GO ID | GO:0000165 | UniProtAcc | O75084 |
Top |
Malignant transformation analysis |
| Identification of the aberrant gene expression in precancerous and cancerous lesions by comparing the gene expression of stem-like cells in diseased tissues with normal stem cells |
| Entrez ID | Symbol | Replicates | Species | Organ | Tissue | Adj P-value | Log2FC | Malignancy |
| 8324 | FZD7 | LZE2T | Human | Esophagus | ESCC | 3.47e-03 | 7.11e-01 | 0.082 |
| 8324 | FZD7 | LZE4T | Human | Esophagus | ESCC | 1.96e-02 | 2.13e-01 | 0.0811 |
| 8324 | FZD7 | LZE7T | Human | Esophagus | ESCC | 5.39e-03 | 1.46e-01 | 0.0667 |
| 8324 | FZD7 | P2T-E | Human | Esophagus | ESCC | 2.75e-27 | 4.45e-01 | 0.1177 |
| 8324 | FZD7 | P4T-E | Human | Esophagus | ESCC | 6.20e-16 | 5.23e-01 | 0.1323 |
| 8324 | FZD7 | P8T-E | Human | Esophagus | ESCC | 3.91e-05 | 6.61e-02 | 0.0889 |
| 8324 | FZD7 | P9T-E | Human | Esophagus | ESCC | 2.52e-24 | 6.07e-01 | 0.1131 |
| 8324 | FZD7 | P10T-E | Human | Esophagus | ESCC | 1.64e-71 | 1.23e+00 | 0.116 |
| 8324 | FZD7 | P12T-E | Human | Esophagus | ESCC | 1.39e-36 | 7.11e-01 | 0.1122 |
| 8324 | FZD7 | P15T-E | Human | Esophagus | ESCC | 7.31e-42 | 1.06e+00 | 0.1149 |
| 8324 | FZD7 | P16T-E | Human | Esophagus | ESCC | 1.47e-45 | 7.89e-01 | 0.1153 |
| 8324 | FZD7 | P20T-E | Human | Esophagus | ESCC | 1.23e-02 | 8.09e-03 | 0.1124 |
| 8324 | FZD7 | P22T-E | Human | Esophagus | ESCC | 1.23e-12 | 3.23e-01 | 0.1236 |
| 8324 | FZD7 | P24T-E | Human | Esophagus | ESCC | 1.91e-02 | 3.89e-02 | 0.1287 |
| 8324 | FZD7 | P26T-E | Human | Esophagus | ESCC | 7.73e-18 | 3.69e-01 | 0.1276 |
| 8324 | FZD7 | P27T-E | Human | Esophagus | ESCC | 8.83e-12 | 2.38e-01 | 0.1055 |
| 8324 | FZD7 | P28T-E | Human | Esophagus | ESCC | 5.32e-30 | 6.31e-01 | 0.1149 |
| 8324 | FZD7 | P30T-E | Human | Esophagus | ESCC | 7.06e-32 | 1.25e+00 | 0.137 |
| 8324 | FZD7 | P31T-E | Human | Esophagus | ESCC | 3.53e-36 | 7.22e-01 | 0.1251 |
| 8324 | FZD7 | P32T-E | Human | Esophagus | ESCC | 5.09e-06 | 4.42e-02 | 0.1666 |
| Page: 1 2 3 |
| Tissue | Expression Dynamics | Abbreviation |
| Esophagus | 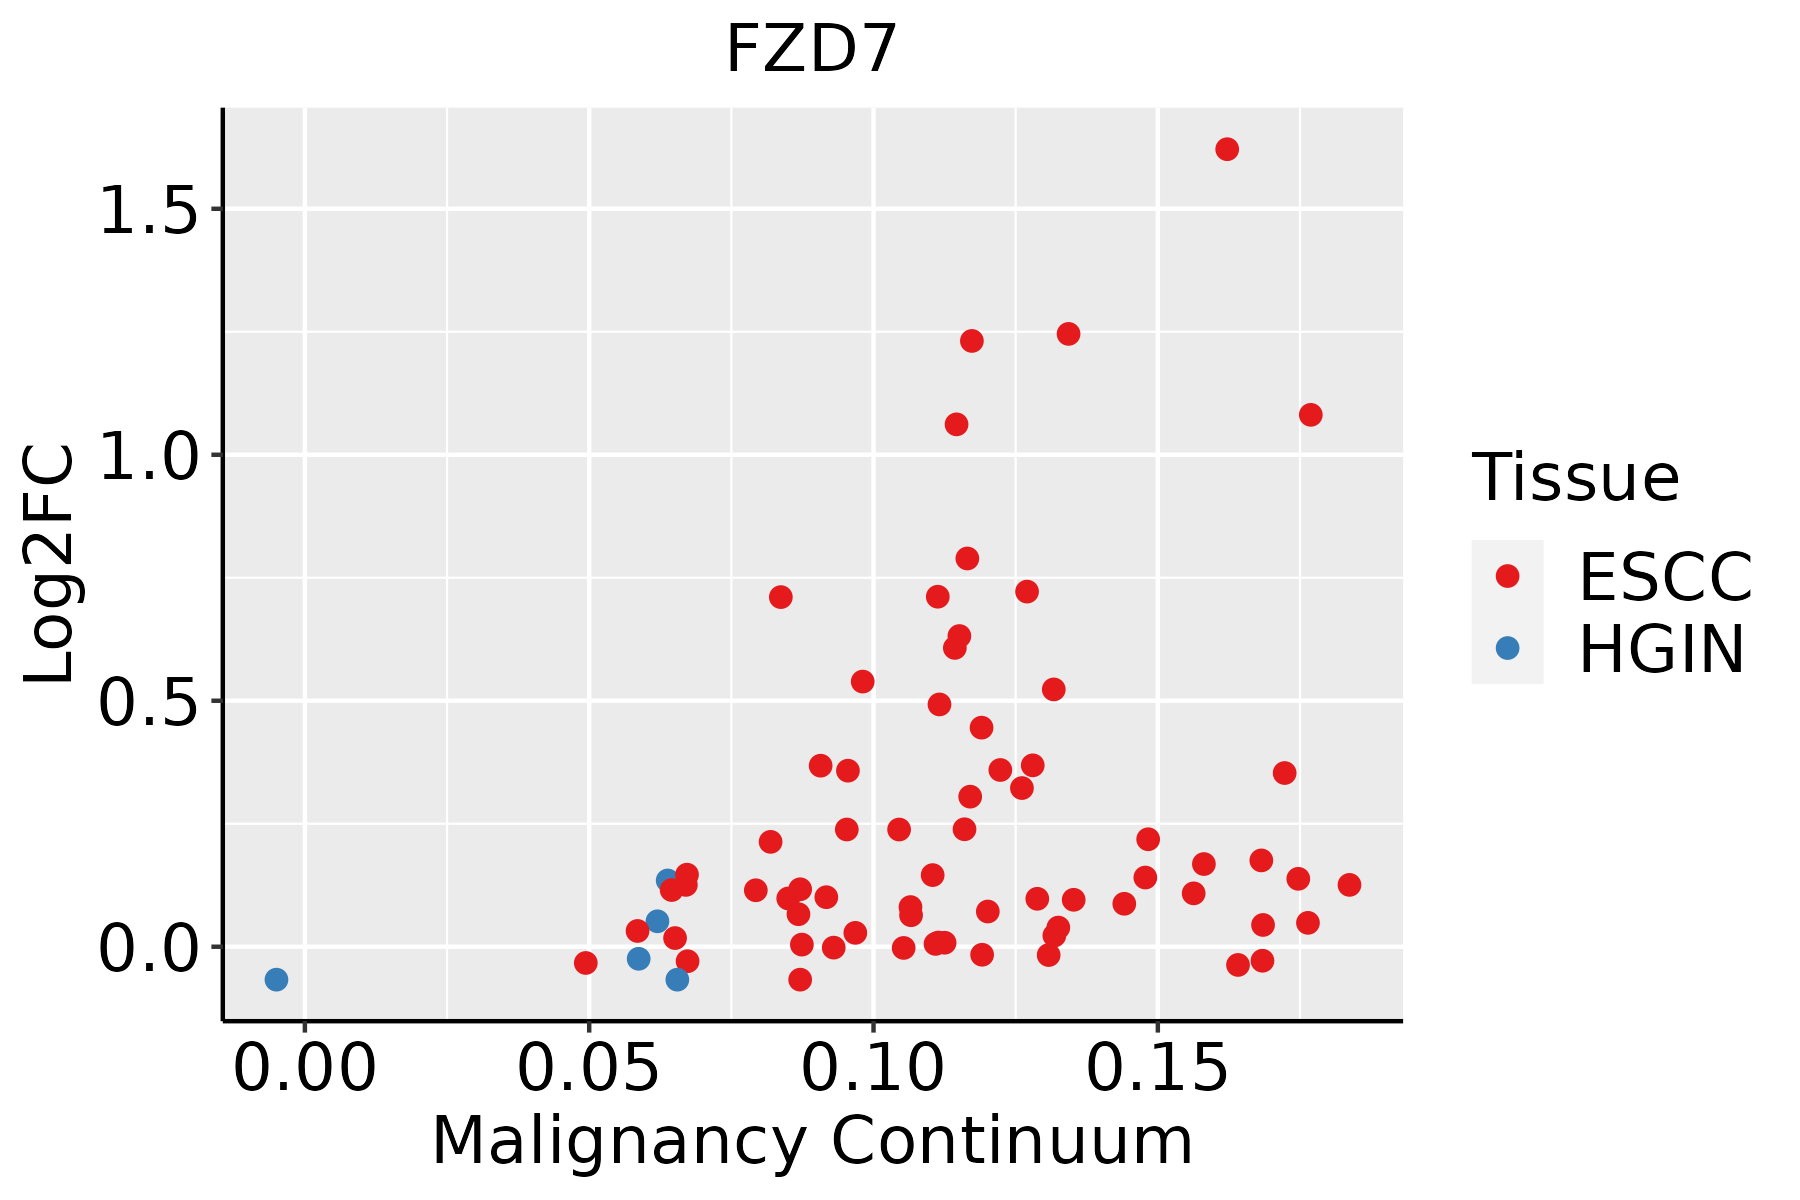 | ESCC: Esophageal squamous cell carcinoma |
| HGIN: High-grade intraepithelial neoplasias | ||
| LGIN: Low-grade intraepithelial neoplasias | ||
| Oral Cavity |  | EOLP: Erosive Oral lichen planus |
| LP: leukoplakia | ||
| NEOLP: Non-erosive oral lichen planus | ||
| OSCC: Oral squamous cell carcinoma |
| ∗log2FC in expression of this searched gene in stem-like cells from each diseased tissue sample relative to stem-like cells in normal samples in each tissue plotted against the malignancy continuum. Samples are colored based on if they are from different disease stage. |
Top |
Malignant transformation related pathway analysis |
| Find out the enriched GO biological processes and KEGG pathways involved in transition from healthy to precancer to cancer |
| Tissue | Disease Stage | Enriched GO biological Processes |
| Colorectum | AD |  |
| Colorectum | SER |  |
| Colorectum | MSS |  |
| Colorectum | MSI-H |  |
| Colorectum | FAP |  |
| ∗Top 15 enriched GO BP terms are showed in the bar plot of each disease state in each tissue. Each row represents a significant GO biological process which is colored according to the -log10(p.adjust). |
| Page: 1 2 3 4 5 6 7 8 9 |
| GO ID | Tissue | Disease Stage | Description | Gene Ratio | Bg Ratio | pvalue | p.adjust | Count |
| GO:001605517 | Esophagus | ESCC | Wnt signaling pathway | 268/8552 | 444/18723 | 2.32e-10 | 6.58e-09 | 268 |
| GO:019873817 | Esophagus | ESCC | cell-cell signaling by wnt | 269/8552 | 446/18723 | 2.41e-10 | 6.79e-09 | 269 |
| GO:003158919 | Esophagus | ESCC | cell-substrate adhesion | 221/8552 | 363/18723 | 3.06e-09 | 6.62e-08 | 221 |
| GO:001081020 | Esophagus | ESCC | regulation of cell-substrate adhesion | 144/8552 | 221/18723 | 3.55e-09 | 7.45e-08 | 144 |
| GO:003109818 | Esophagus | ESCC | stress-activated protein kinase signaling cascade | 154/8552 | 247/18723 | 8.53e-08 | 1.44e-06 | 154 |
| GO:009872714 | Esophagus | ESCC | maintenance of cell number | 90/8552 | 134/18723 | 3.94e-07 | 5.43e-06 | 90 |
| GO:004206027 | Esophagus | ESCC | wound healing | 243/8552 | 422/18723 | 4.62e-07 | 6.25e-06 | 243 |
| GO:001982714 | Esophagus | ESCC | stem cell population maintenance | 88/8552 | 131/18723 | 5.23e-07 | 6.97e-06 | 88 |
| GO:003011117 | Esophagus | ESCC | regulation of Wnt signaling pathway | 194/8552 | 328/18723 | 5.39e-07 | 7.14e-06 | 194 |
| GO:005140318 | Esophagus | ESCC | stress-activated MAPK cascade | 147/8552 | 239/18723 | 5.43e-07 | 7.18e-06 | 147 |
| GO:006007016 | Esophagus | ESCC | canonical Wnt signaling pathway | 180/8552 | 303/18723 | 9.15e-07 | 1.17e-05 | 180 |
| GO:006082817 | Esophagus | ESCC | regulation of canonical Wnt signaling pathway | 153/8552 | 253/18723 | 1.38e-06 | 1.67e-05 | 153 |
| GO:003109910 | Esophagus | ESCC | regeneration | 122/8552 | 198/18723 | 4.26e-06 | 4.57e-05 | 122 |
| GO:00073698 | Esophagus | ESCC | gastrulation | 115/8552 | 185/18723 | 4.35e-06 | 4.64e-05 | 115 |
| GO:007030217 | Esophagus | ESCC | regulation of stress-activated protein kinase signaling cascade | 119/8552 | 195/18723 | 1.07e-05 | 1.01e-04 | 119 |
| GO:00017387 | Esophagus | ESCC | morphogenesis of a polarized epithelium | 63/8552 | 94/18723 | 2.34e-05 | 2.00e-04 | 63 |
| GO:003287217 | Esophagus | ESCC | regulation of stress-activated MAPK cascade | 116/8552 | 192/18723 | 2.63e-05 | 2.21e-04 | 116 |
| GO:00072549 | Esophagus | ESCC | JNK cascade | 102/8552 | 167/18723 | 4.22e-05 | 3.39e-04 | 102 |
| GO:005067318 | Esophagus | ESCC | epithelial cell proliferation | 238/8552 | 437/18723 | 1.19e-04 | 8.20e-04 | 238 |
| GO:00017044 | Esophagus | ESCC | formation of primary germ layer | 75/8552 | 121/18723 | 2.17e-04 | 1.36e-03 | 75 |
| Page: 1 2 3 4 |
| Pathway ID | Tissue | Disease Stage | Description | Gene Ratio | Bg Ratio | pvalue | p.adjust | qvalue | Count |
| hsa05022210 | Esophagus | ESCC | Pathways of neurodegeneration - multiple diseases | 318/4205 | 476/8465 | 6.10e-15 | 2.04e-13 | 1.05e-13 | 318 |
| hsa05010210 | Esophagus | ESCC | Alzheimer disease | 263/4205 | 384/8465 | 1.80e-14 | 5.47e-13 | 2.80e-13 | 263 |
| hsa0516510 | Esophagus | ESCC | Human papillomavirus infection | 215/4205 | 331/8465 | 7.86e-09 | 7.12e-08 | 3.65e-08 | 215 |
| hsa0520529 | Esophagus | ESCC | Proteoglycans in cancer | 138/4205 | 205/8465 | 1.79e-07 | 1.40e-06 | 7.15e-07 | 138 |
| hsa0522518 | Esophagus | ESCC | Hepatocellular carcinoma | 109/4205 | 168/8465 | 4.27e-05 | 1.88e-04 | 9.64e-05 | 109 |
| hsa041505 | Esophagus | ESCC | mTOR signaling pathway | 98/4205 | 156/8465 | 5.81e-04 | 1.95e-03 | 9.97e-04 | 98 |
| hsa0439018 | Esophagus | ESCC | Hippo signaling pathway | 92/4205 | 157/8465 | 1.46e-02 | 3.31e-02 | 1.69e-02 | 92 |
| hsa0502238 | Esophagus | ESCC | Pathways of neurodegeneration - multiple diseases | 318/4205 | 476/8465 | 6.10e-15 | 2.04e-13 | 1.05e-13 | 318 |
| hsa0501038 | Esophagus | ESCC | Alzheimer disease | 263/4205 | 384/8465 | 1.80e-14 | 5.47e-13 | 2.80e-13 | 263 |
| hsa0516515 | Esophagus | ESCC | Human papillomavirus infection | 215/4205 | 331/8465 | 7.86e-09 | 7.12e-08 | 3.65e-08 | 215 |
| hsa0520537 | Esophagus | ESCC | Proteoglycans in cancer | 138/4205 | 205/8465 | 1.79e-07 | 1.40e-06 | 7.15e-07 | 138 |
| hsa0522519 | Esophagus | ESCC | Hepatocellular carcinoma | 109/4205 | 168/8465 | 4.27e-05 | 1.88e-04 | 9.64e-05 | 109 |
| hsa0415013 | Esophagus | ESCC | mTOR signaling pathway | 98/4205 | 156/8465 | 5.81e-04 | 1.95e-03 | 9.97e-04 | 98 |
| hsa0439019 | Esophagus | ESCC | Hippo signaling pathway | 92/4205 | 157/8465 | 1.46e-02 | 3.31e-02 | 1.69e-02 | 92 |
| hsa0501028 | Oral cavity | OSCC | Alzheimer disease | 244/3704 | 384/8465 | 1.18e-15 | 3.60e-14 | 1.83e-14 | 244 |
| hsa0502228 | Oral cavity | OSCC | Pathways of neurodegeneration - multiple diseases | 292/3704 | 476/8465 | 1.60e-15 | 4.47e-14 | 2.28e-14 | 292 |
| hsa051659 | Oral cavity | OSCC | Human papillomavirus infection | 200/3704 | 331/8465 | 3.83e-10 | 4.93e-09 | 2.51e-09 | 200 |
| hsa0520526 | Oral cavity | OSCC | Proteoglycans in cancer | 128/3704 | 205/8465 | 4.00e-08 | 3.12e-07 | 1.59e-07 | 128 |
| hsa0522516 | Oral cavity | OSCC | Hepatocellular carcinoma | 97/3704 | 168/8465 | 1.63e-04 | 5.52e-04 | 2.81e-04 | 97 |
| hsa041504 | Oral cavity | OSCC | mTOR signaling pathway | 90/3704 | 156/8465 | 2.87e-04 | 9.15e-04 | 4.66e-04 | 90 |
| Page: 1 2 |
Top |
Cell-cell communication analysis |
| Identification of potential cell-cell interactions between two cell types and their ligand-receptor pairs for different disease states |
| Ligand | Receptor | LRpair | Pathway | Tissue | Disease Stage |
| WNT5A | FZD7 | WNT5A_FZD7 | ncWNT | Cervix | ADJ |
| WNT5A | FZD7 | WNT5A_FZD7 | ncWNT | Endometrium | AEH |
| WNT5B | FZD7 | WNT5B_FZD7 | ncWNT | Endometrium | AEH |
| WNT5A | FZD7 | WNT5A_FZD7 | ncWNT | HNSCC | OSCC |
| Page: 1 |
Top |
Single-cell gene regulatory network inference analysis |
| Find out the significant the regulons (TFs) and the target genes of each regulon across cell types for different disease states |
| TF | Cell Type | Tissue | Disease Stage | Target Gene | RSS | Regulon Activity |
| ∗The dot plots of a searched regulon are shown for all cell subpopulations in each disease state of each tissue based on the regulon specific score inferred using pySCENIC and by calculating the average expression. |
| Page: 1 |
Top |
Somatic mutation of malignant transformation related genes |
| Annotation of somatic variants for genes involved in malignant transformation |
| Hugo Symbol | Variant Class | Variant Classification | dbSNP RS | HGVSc | HGVSp | HGVSp Short | SWISSPROT | BIOTYPE | SIFT | PolyPhen | Tumor Sample Barcode | Tissue | Histology | Sex | Age | Stage | Therapy Types | Drugs | Outcome |
| FZD7 | SNV | Missense_Mutation | c.268G>C | p.Val90Leu | p.V90L | O75084 | protein_coding | deleterious(0) | possibly_damaging(0.774) | TCGA-AN-A0AT-01 | Breast | breast invasive carcinoma | Female | <65 | I/II | Unknown | Unknown | SD | |
| FZD7 | SNV | Missense_Mutation | novel | c.394N>A | p.Glu132Lys | p.E132K | O75084 | protein_coding | tolerated(0.06) | possibly_damaging(0.88) | TCGA-BH-A0B6-01 | Breast | breast invasive carcinoma | Female | <65 | I/II | Unknown | Unknown | SD |
| FZD7 | SNV | Missense_Mutation | c.400N>G | p.Leu134Val | p.L134V | O75084 | protein_coding | deleterious(0.03) | benign(0.428) | TCGA-E9-A1NA-01 | Breast | breast invasive carcinoma | Female | <65 | I/II | Chemotherapy | cyclophosphamide | SD | |
| FZD7 | insertion | Nonsense_Mutation | novel | c.1077_1078insCTACCGCTTCCTGGGTGAGCGCGATTGTGGCGCCCCGTGCGA | p.Leu359_Thr360insLeuProLeuProGlyTerAlaArgLeuTrpArgProValArg | p.L359_T360insLPLPG*ARLWRPVR | O75084 | protein_coding | TCGA-A7-A0CD-01 | Breast | breast invasive carcinoma | Female | >=65 | I/II | Hormone Therapy | arimidex | SD | ||
| FZD7 | SNV | Missense_Mutation | c.365N>G | p.Ser122Cys | p.S122C | O75084 | protein_coding | deleterious(0) | probably_damaging(0.978) | TCGA-DS-A1OC-01 | Cervix | cervical & endocervical cancer | Female | <65 | I/II | Chemotherapy | gemcitabine | SD | |
| FZD7 | SNV | Missense_Mutation | c.1680N>G | p.Phe560Leu | p.F560L | O75084 | protein_coding | tolerated(0.21) | probably_damaging(0.968) | TCGA-IR-A3LH-01 | Cervix | cervical & endocervical cancer | Female | <65 | I/II | Chemotherapy | cisplatin | CR | |
| FZD7 | SNV | Missense_Mutation | c.1672C>T | p.Arg558Cys | p.R558C | O75084 | protein_coding | deleterious(0) | probably_damaging(0.953) | TCGA-AA-3663-01 | Colorectum | colon adenocarcinoma | Male | <65 | I/II | Unknown | Unknown | SD | |
| FZD7 | SNV | Missense_Mutation | c.1259N>T | p.Ala420Val | p.A420V | O75084 | protein_coding | tolerated(0.28) | possibly_damaging(0.871) | TCGA-AA-A010-01 | Colorectum | colon adenocarcinoma | Female | <65 | I/II | Chemotherapy | folinic | CR | |
| FZD7 | SNV | Missense_Mutation | c.1403T>C | p.Met468Thr | p.M468T | O75084 | protein_coding | deleterious(0) | possibly_damaging(0.838) | TCGA-AD-A5EJ-01 | Colorectum | colon adenocarcinoma | Female | >=65 | I/II | Unknown | Unknown | SD | |
| FZD7 | SNV | Missense_Mutation | rs185267840 | c.497N>T | p.Ser166Leu | p.S166L | O75084 | protein_coding | deleterious(0.01) | benign(0.217) | TCGA-AZ-6598-01 | Colorectum | colon adenocarcinoma | Female | >=65 | I/II | Unknown | Unknown | SD |
| Page: 1 2 3 4 5 6 7 |
Top |
Related drugs of malignant transformation related genes |
| Identification of chemicals and drugs interact with genes involved in malignant transfromation |
| (DGIdb 4.0) |
| Entrez ID | Symbol | Category | Interaction Types | Drug Claim Name | Drug Name | PMIDs |
| 8324 | FZD7 | G PROTEIN COUPLED RECEPTOR, KINASE | antagonist | 381745004 | ||
| 8324 | FZD7 | G PROTEIN COUPLED RECEPTOR, KINASE | OMP-18R5 | VANTICTUMAB | ||
| 8324 | FZD7 | G PROTEIN COUPLED RECEPTOR, KINASE | antagonist | 381745005 | ||
| 8324 | FZD7 | G PROTEIN COUPLED RECEPTOR, KINASE | antagonist | CHEMBL2364652 | VANTICTUMAB | |
| 8324 | FZD7 | G PROTEIN COUPLED RECEPTOR, KINASE | antibody | 381118907 | VANTICTUMAB |
| Page: 1 |

Copyright 2023-Present -The University of Texas Health Science Center at Houston |