
|
|||||
|
 | |
| |
| |
| |
| |
| |
|
Gene: FZD6 |
Gene summary for FZD6 |
| Gene information | Species | Human | Gene symbol | FZD6 | Gene ID | 8323 |
| Gene name | frizzled class receptor 6 | |
| Gene Alias | FZ-6 | |
| Cytomap | 8q22.3 | |
| Gene Type | protein-coding | GO ID | GO:0001736 | UniProtAcc | A0A024R9E9 |
Top |
Malignant transformation analysis |
| Identification of the aberrant gene expression in precancerous and cancerous lesions by comparing the gene expression of stem-like cells in diseased tissues with normal stem cells |
| Entrez ID | Symbol | Replicates | Species | Organ | Tissue | Adj P-value | Log2FC | Malignancy |
| 8323 | FZD6 | CA_HPV_1 | Human | Cervix | CC | 2.54e-02 | -1.49e-01 | 0.0264 |
| 8323 | FZD6 | CCI_2 | Human | Cervix | CC | 1.09e-04 | 8.08e-01 | 0.5249 |
| 8323 | FZD6 | Tumor | Human | Cervix | CC | 7.08e-28 | 6.57e-01 | 0.1241 |
| 8323 | FZD6 | sample3 | Human | Cervix | CC | 2.55e-27 | 5.94e-01 | 0.1387 |
| 8323 | FZD6 | T3 | Human | Cervix | CC | 4.15e-25 | 5.80e-01 | 0.1389 |
| 8323 | FZD6 | LZE2T | Human | Esophagus | ESCC | 1.30e-05 | 8.66e-01 | 0.082 |
| 8323 | FZD6 | LZE4T | Human | Esophagus | ESCC | 4.54e-29 | 9.92e-01 | 0.0811 |
| 8323 | FZD6 | LZE7T | Human | Esophagus | ESCC | 2.15e-07 | 4.01e-01 | 0.0667 |
| 8323 | FZD6 | LZE8T | Human | Esophagus | ESCC | 1.43e-05 | 2.23e-01 | 0.067 |
| 8323 | FZD6 | LZE20T | Human | Esophagus | ESCC | 5.23e-11 | 3.83e-01 | 0.0662 |
| 8323 | FZD6 | LZE24T | Human | Esophagus | ESCC | 2.72e-21 | 7.38e-01 | 0.0596 |
| 8323 | FZD6 | LZE21T | Human | Esophagus | ESCC | 2.49e-04 | 3.15e-01 | 0.0655 |
| 8323 | FZD6 | LZE6T | Human | Esophagus | ESCC | 1.35e-03 | 3.76e-02 | 0.0845 |
| 8323 | FZD6 | P1T-E | Human | Esophagus | ESCC | 2.07e-03 | 2.97e-01 | 0.0875 |
| 8323 | FZD6 | P2T-E | Human | Esophagus | ESCC | 2.05e-39 | 7.79e-01 | 0.1177 |
| 8323 | FZD6 | P4T-E | Human | Esophagus | ESCC | 1.27e-22 | 6.34e-01 | 0.1323 |
| 8323 | FZD6 | P5T-E | Human | Esophagus | ESCC | 2.78e-21 | 4.13e-01 | 0.1327 |
| 8323 | FZD6 | P8T-E | Human | Esophagus | ESCC | 2.68e-22 | 5.78e-01 | 0.0889 |
| 8323 | FZD6 | P9T-E | Human | Esophagus | ESCC | 1.01e-18 | 6.00e-01 | 0.1131 |
| 8323 | FZD6 | P10T-E | Human | Esophagus | ESCC | 2.36e-60 | 1.11e+00 | 0.116 |
| Page: 1 2 3 4 5 6 |
| Tissue | Expression Dynamics | Abbreviation |
| Cervix | 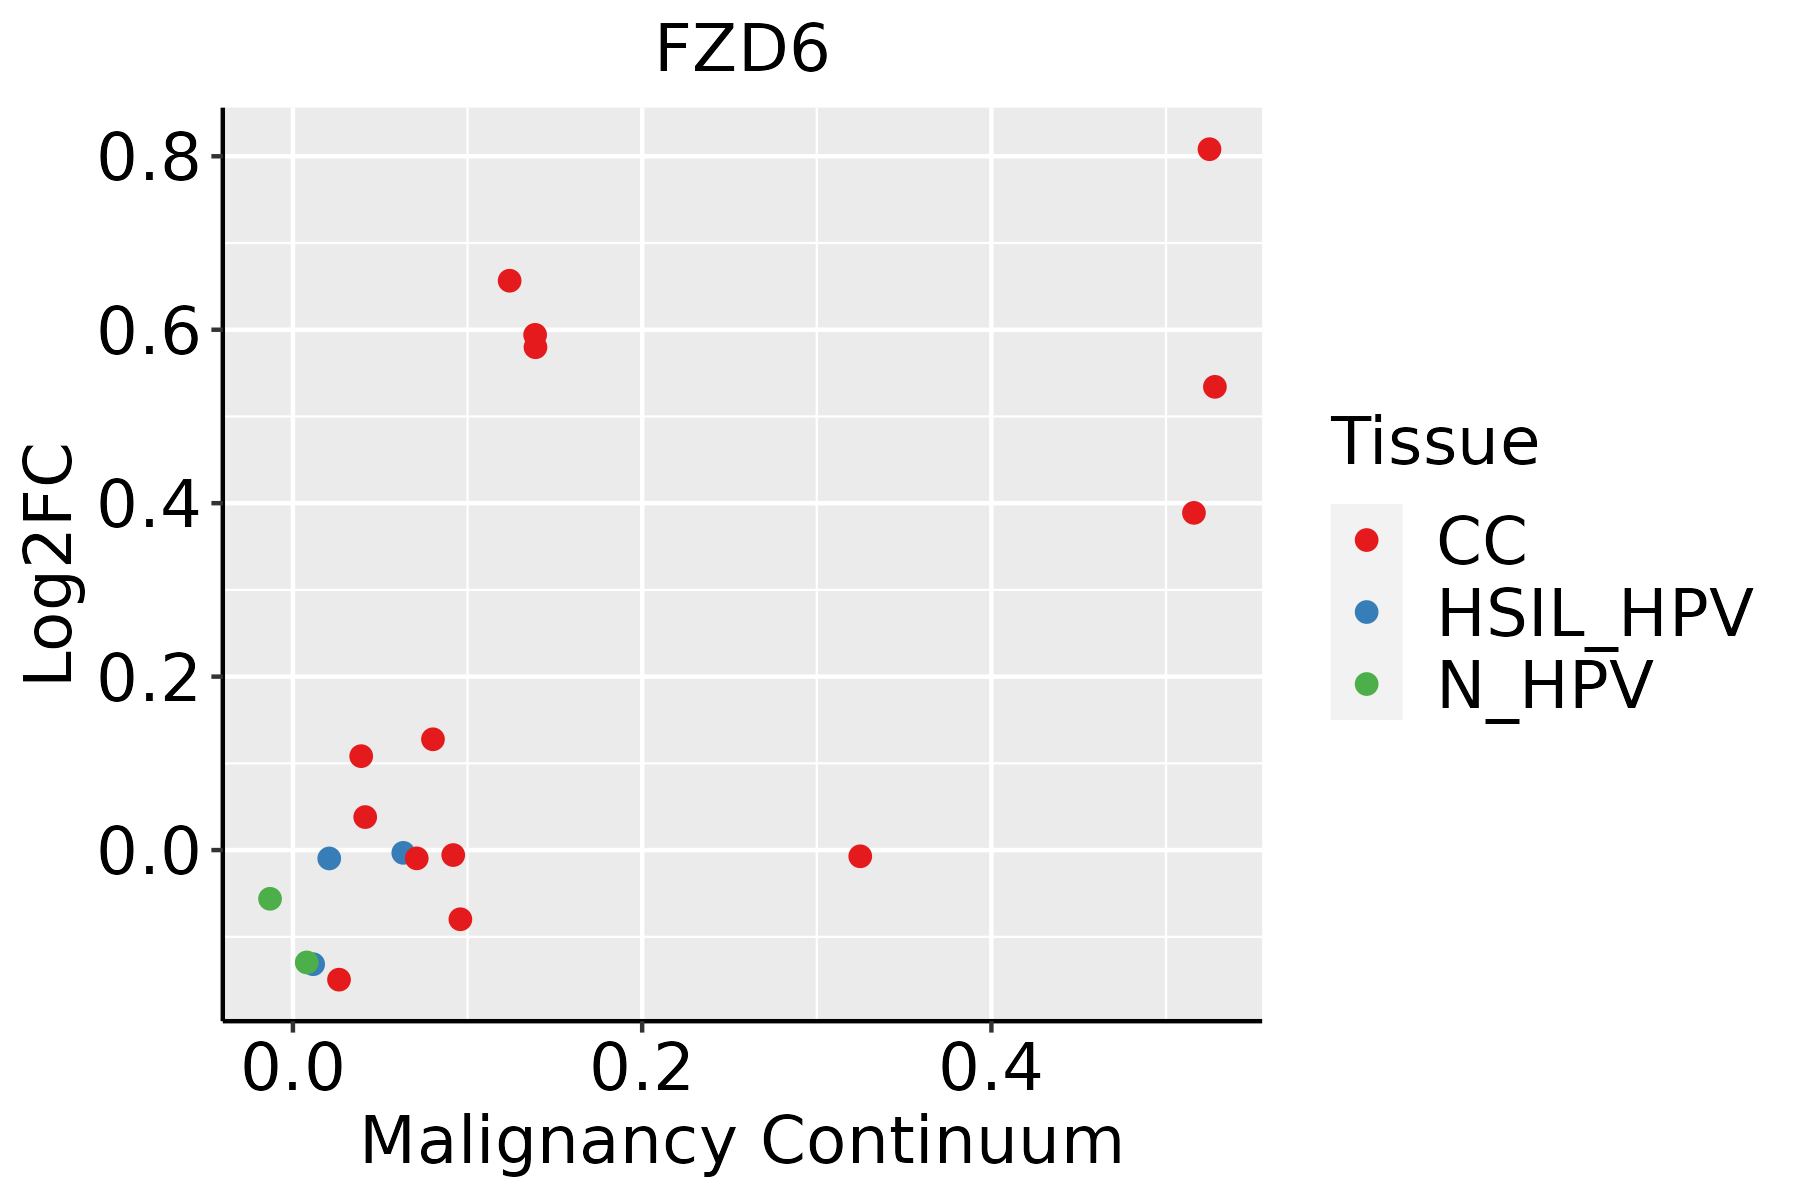 | CC: Cervix cancer |
| HSIL_HPV: HPV-infected high-grade squamous intraepithelial lesions | ||
| N_HPV: HPV-infected normal cervix | ||
| Esophagus | 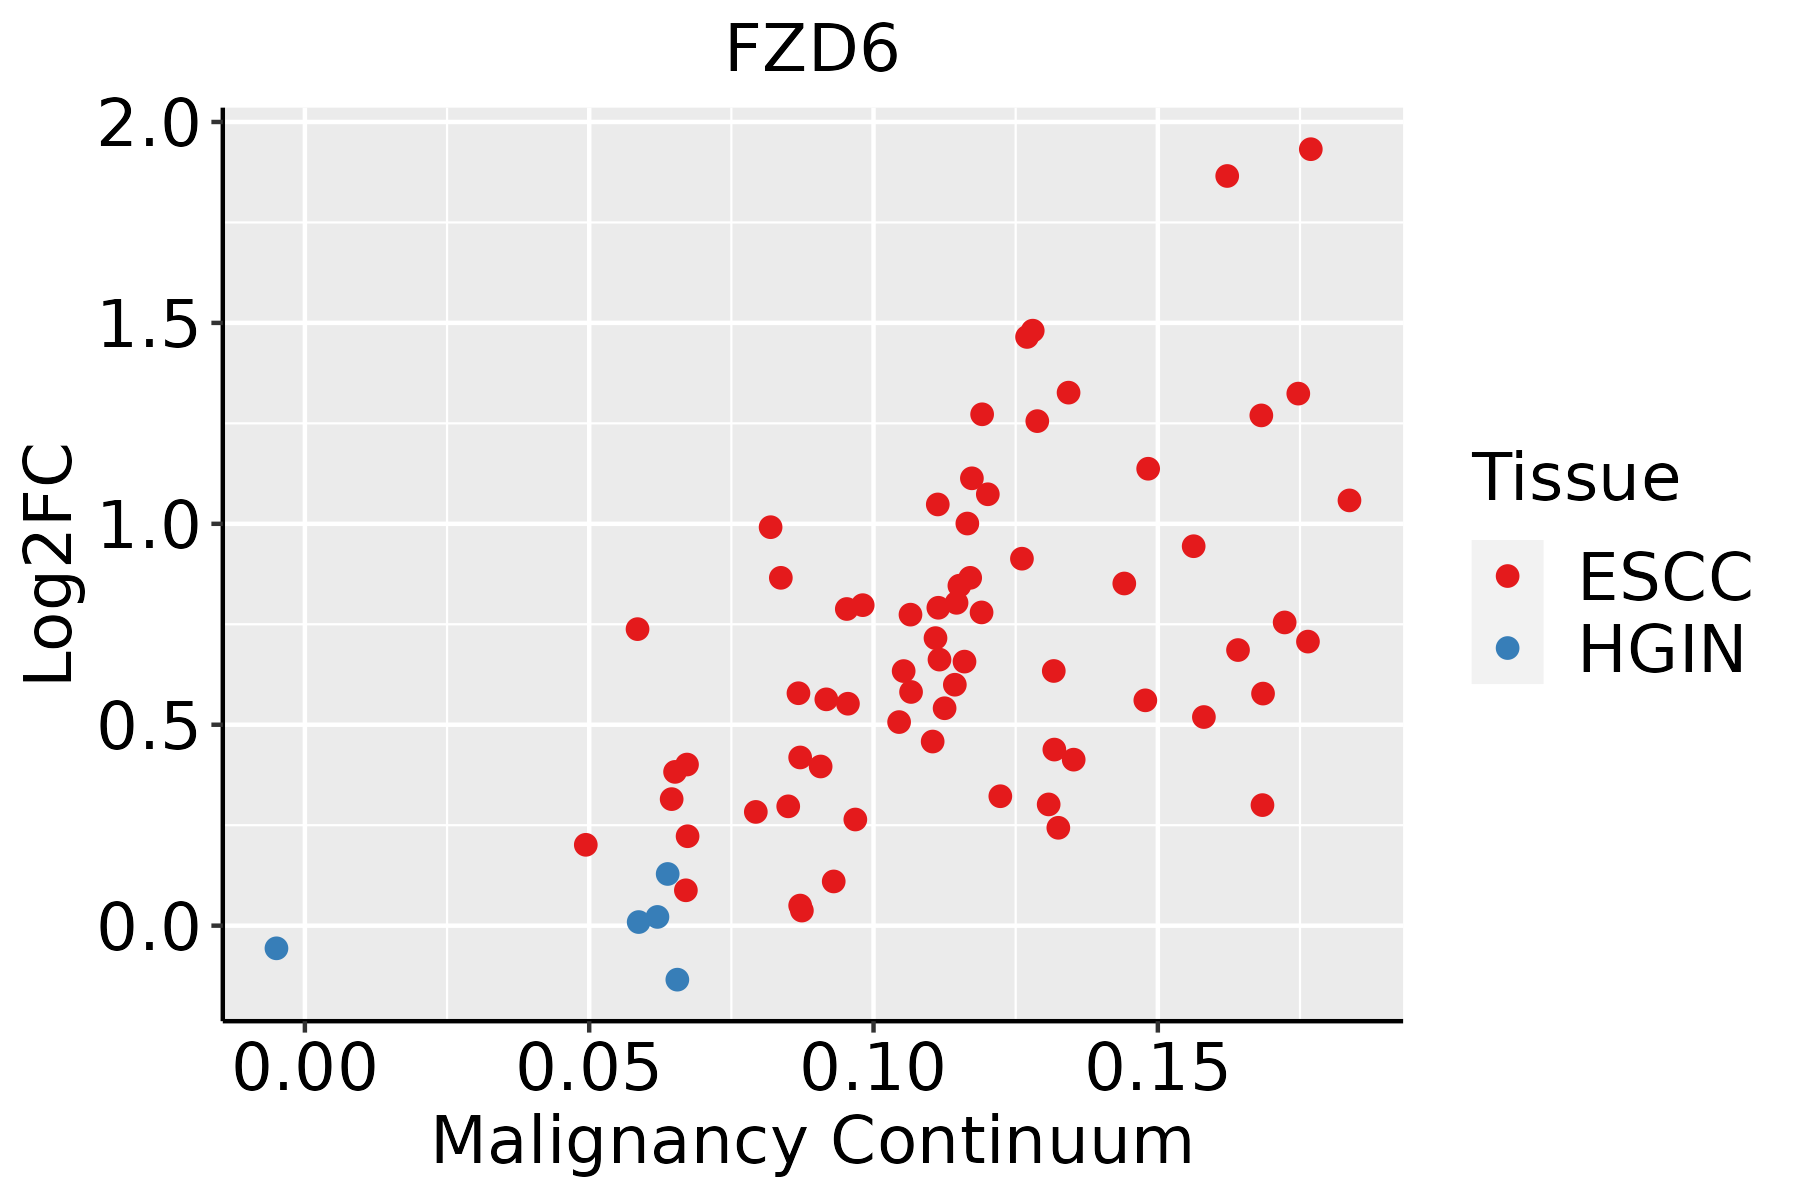 | ESCC: Esophageal squamous cell carcinoma |
| HGIN: High-grade intraepithelial neoplasias | ||
| LGIN: Low-grade intraepithelial neoplasias | ||
| Oral Cavity |  | EOLP: Erosive Oral lichen planus |
| LP: leukoplakia | ||
| NEOLP: Non-erosive oral lichen planus | ||
| OSCC: Oral squamous cell carcinoma | ||
| Skin | 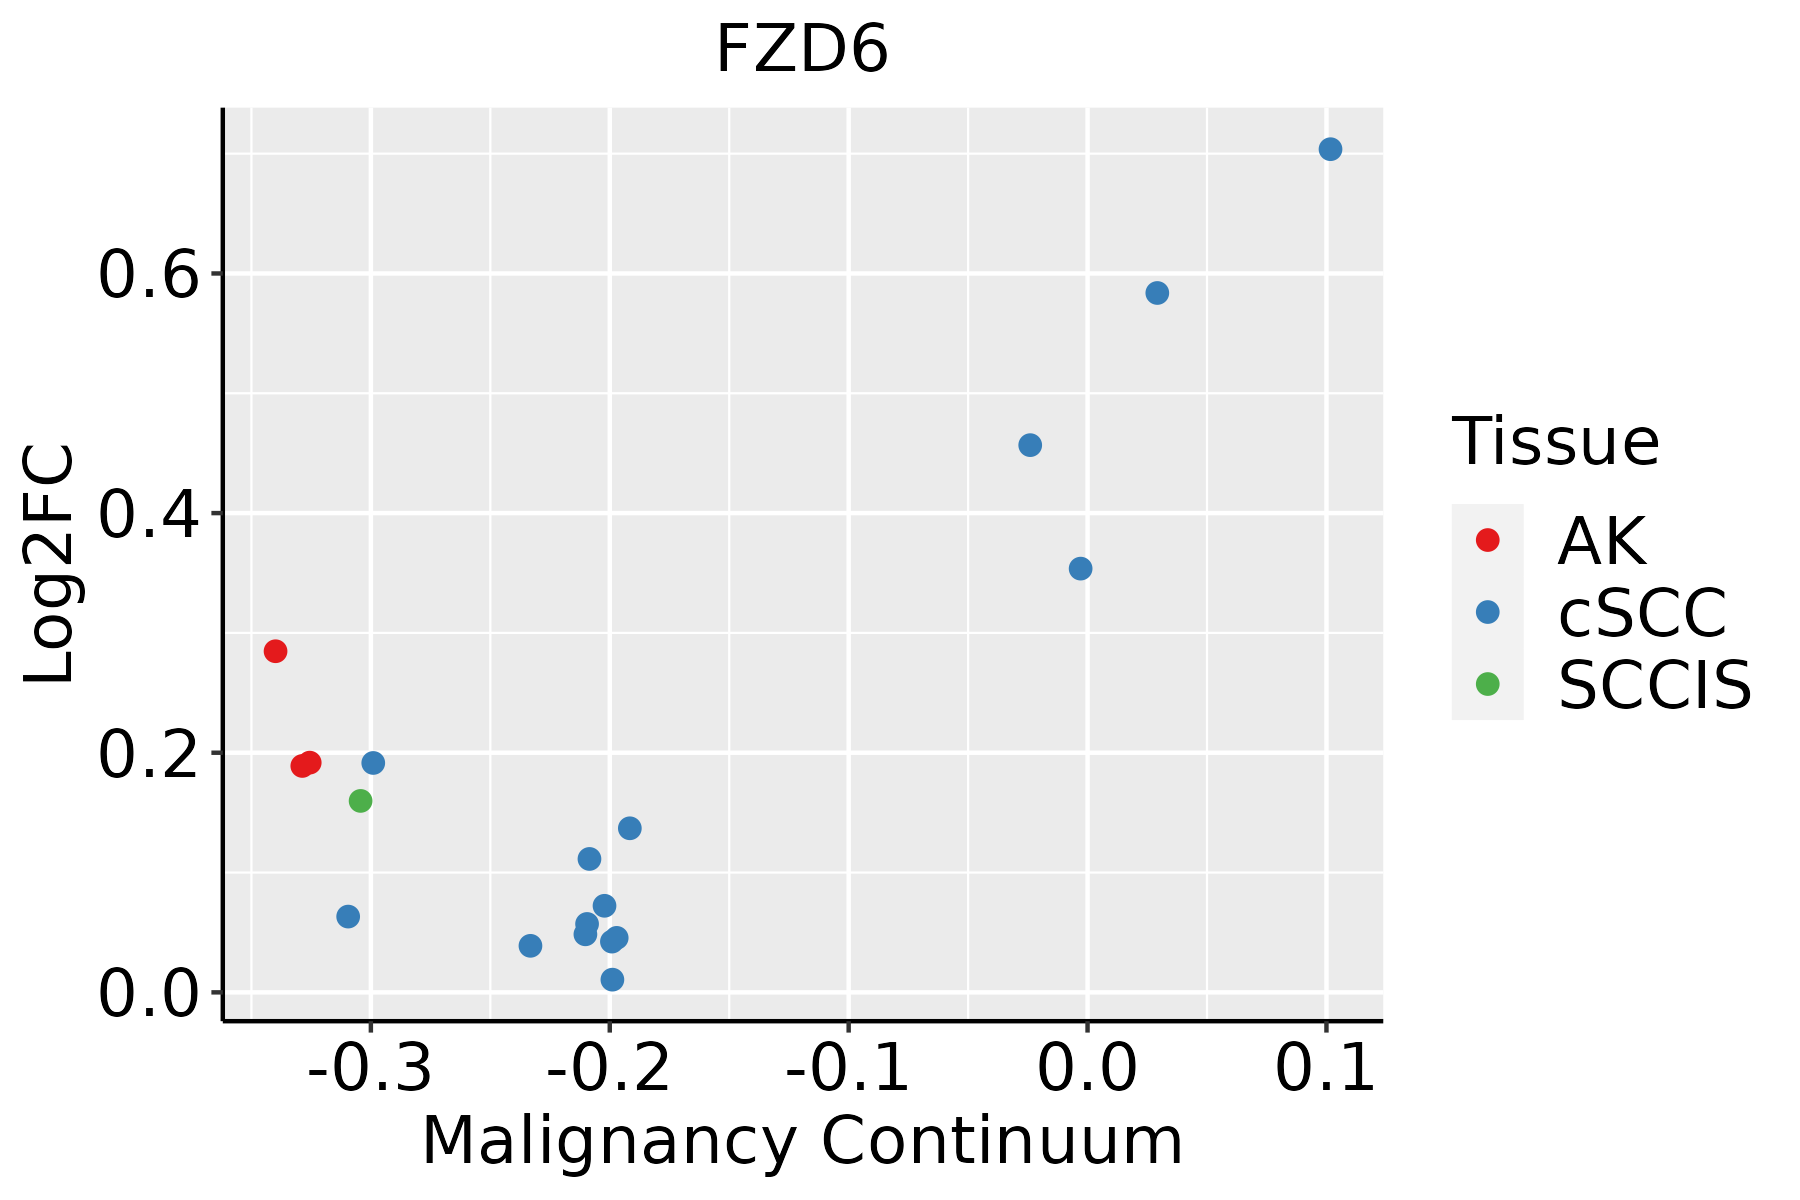 | AK: Actinic keratosis |
| cSCC: Cutaneous squamous cell carcinoma | ||
| SCCIS:squamous cell carcinoma in situ | ||
| Thyroid | 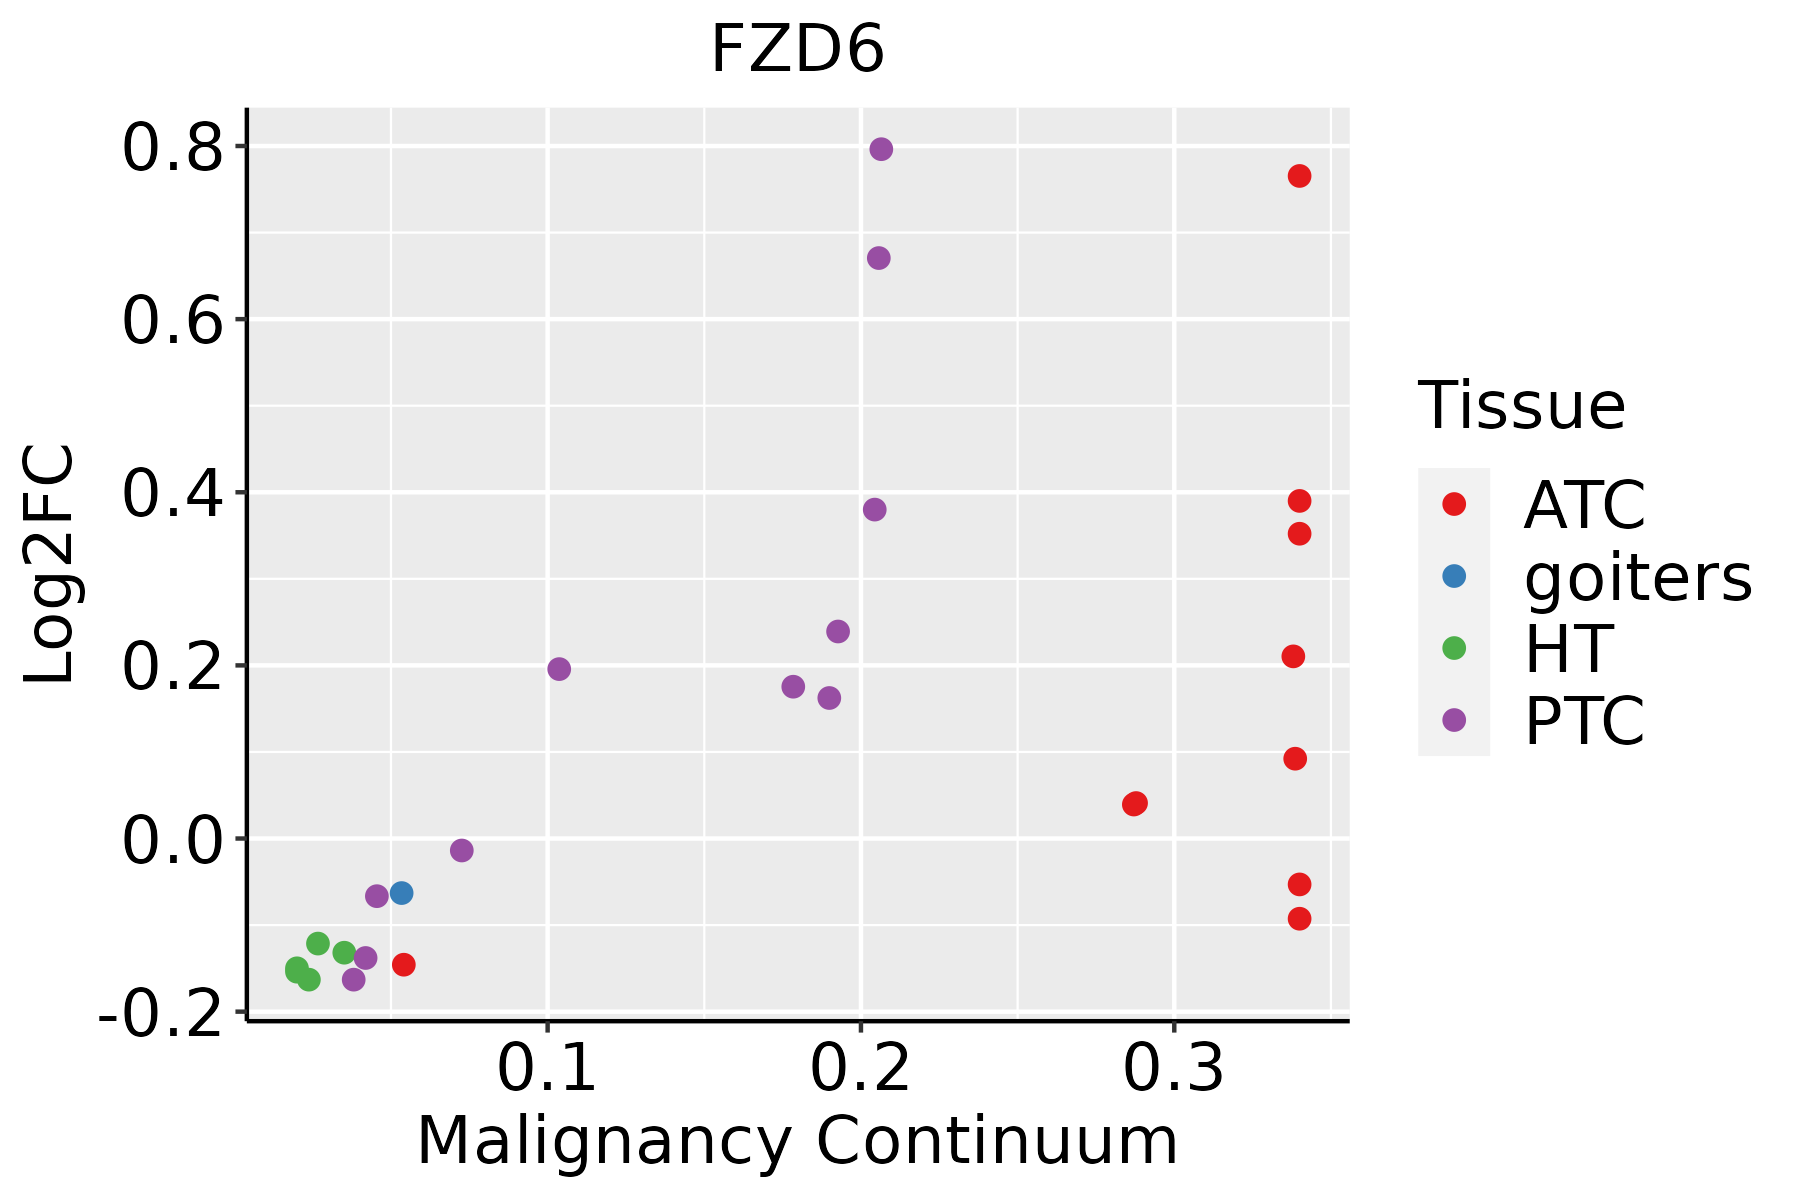 | ATC: Anaplastic thyroid cancer |
| HT: Hashimoto's thyroiditis | ||
| PTC: Papillary thyroid cancer |
| ∗log2FC in expression of this searched gene in stem-like cells from each diseased tissue sample relative to stem-like cells in normal samples in each tissue plotted against the malignancy continuum. Samples are colored based on if they are from different disease stage. |
Top |
Malignant transformation related pathway analysis |
| Find out the enriched GO biological processes and KEGG pathways involved in transition from healthy to precancer to cancer |
| Tissue | Disease Stage | Enriched GO biological Processes |
| Colorectum | AD |  |
| Colorectum | SER |  |
| Colorectum | MSS |  |
| Colorectum | MSI-H |  |
| Colorectum | FAP |  |
| ∗Top 15 enriched GO BP terms are showed in the bar plot of each disease state in each tissue. Each row represents a significant GO biological process which is colored according to the -log10(p.adjust). |
| Page: 1 2 3 4 5 6 7 8 9 |
| GO ID | Tissue | Disease Stage | Description | Gene Ratio | Bg Ratio | pvalue | p.adjust | Count |
| GO:004206010 | Cervix | CC | wound healing | 109/2311 | 422/18723 | 1.84e-14 | 1.57e-11 | 109 |
| GO:00085446 | Cervix | CC | epidermis development | 83/2311 | 324/18723 | 3.91e-11 | 8.54e-09 | 83 |
| GO:00435884 | Cervix | CC | skin development | 71/2311 | 263/18723 | 8.04e-11 | 1.46e-08 | 71 |
| GO:00160557 | Cervix | CC | Wnt signaling pathway | 98/2311 | 444/18723 | 4.82e-09 | 4.65e-07 | 98 |
| GO:01987387 | Cervix | CC | cell-cell signaling by wnt | 98/2311 | 446/18723 | 6.16e-09 | 5.58e-07 | 98 |
| GO:00301117 | Cervix | CC | regulation of Wnt signaling pathway | 76/2311 | 328/18723 | 3.05e-08 | 2.08e-06 | 76 |
| GO:00608287 | Cervix | CC | regulation of canonical Wnt signaling pathway | 58/2311 | 253/18723 | 1.83e-06 | 5.89e-05 | 58 |
| GO:00600707 | Cervix | CC | canonical Wnt signaling pathway | 66/2311 | 303/18723 | 2.47e-06 | 7.35e-05 | 66 |
| GO:005087810 | Cervix | CC | regulation of body fluid levels | 78/2311 | 379/18723 | 3.20e-06 | 8.77e-05 | 78 |
| GO:00510904 | Cervix | CC | regulation of DNA-binding transcription factor activity | 87/2311 | 440/18723 | 4.85e-06 | 1.22e-04 | 87 |
| GO:00309019 | Cervix | CC | midbrain development | 26/2311 | 90/18723 | 2.12e-05 | 3.82e-04 | 26 |
| GO:00508176 | Cervix | CC | coagulation | 45/2311 | 222/18723 | 5.08e-04 | 4.94e-03 | 45 |
| GO:00075966 | Cervix | CC | blood coagulation | 44/2311 | 217/18723 | 5.78e-04 | 5.52e-03 | 44 |
| GO:00301682 | Cervix | CC | platelet activation | 28/2311 | 123/18723 | 8.92e-04 | 7.71e-03 | 28 |
| GO:00075996 | Cervix | CC | hemostasis | 44/2311 | 222/18723 | 9.47e-04 | 7.95e-03 | 44 |
| GO:00301784 | Cervix | CC | negative regulation of Wnt signaling pathway | 35/2311 | 170/18723 | 1.52e-03 | 1.17e-02 | 35 |
| GO:00487365 | Cervix | CC | appendage development | 35/2311 | 172/18723 | 1.88e-03 | 1.39e-02 | 35 |
| GO:00601735 | Cervix | CC | limb development | 35/2311 | 172/18723 | 1.88e-03 | 1.39e-02 | 35 |
| GO:00351487 | Cervix | CC | tube formation | 31/2311 | 148/18723 | 2.07e-03 | 1.51e-02 | 31 |
| GO:00017384 | Cervix | CC | morphogenesis of a polarized epithelium | 22/2311 | 94/18723 | 2.09e-03 | 1.52e-02 | 22 |
| Page: 1 2 3 4 5 6 7 8 9 10 11 12 |
| Pathway ID | Tissue | Disease Stage | Description | Gene Ratio | Bg Ratio | pvalue | p.adjust | qvalue | Count |
| hsa0501018 | Cervix | CC | Alzheimer disease | 113/1267 | 384/8465 | 9.67e-14 | 3.92e-12 | 2.32e-12 | 113 |
| hsa0502218 | Cervix | CC | Pathways of neurodegeneration - multiple diseases | 128/1267 | 476/8465 | 2.87e-12 | 9.29e-11 | 5.50e-11 | 128 |
| hsa0520516 | Cervix | CC | Proteoglycans in cancer | 60/1267 | 205/8465 | 9.13e-08 | 1.18e-06 | 7.00e-07 | 60 |
| hsa051657 | Cervix | CC | Human papillomavirus infection | 74/1267 | 331/8465 | 1.70e-04 | 1.02e-03 | 6.03e-04 | 74 |
| hsa043109 | Cervix | CC | Wnt signaling pathway | 43/1267 | 171/8465 | 3.03e-04 | 1.64e-03 | 9.68e-04 | 43 |
| hsa043908 | Cervix | CC | Hippo signaling pathway | 40/1267 | 157/8465 | 3.64e-04 | 1.82e-03 | 1.07e-03 | 40 |
| hsa0522510 | Cervix | CC | Hepatocellular carcinoma | 40/1267 | 168/8465 | 1.52e-03 | 6.39e-03 | 3.78e-03 | 40 |
| hsa05224 | Cervix | CC | Breast cancer | 32/1267 | 147/8465 | 1.66e-02 | 4.88e-02 | 2.88e-02 | 32 |
| hsa0501019 | Cervix | CC | Alzheimer disease | 113/1267 | 384/8465 | 9.67e-14 | 3.92e-12 | 2.32e-12 | 113 |
| hsa0502219 | Cervix | CC | Pathways of neurodegeneration - multiple diseases | 128/1267 | 476/8465 | 2.87e-12 | 9.29e-11 | 5.50e-11 | 128 |
| hsa0520517 | Cervix | CC | Proteoglycans in cancer | 60/1267 | 205/8465 | 9.13e-08 | 1.18e-06 | 7.00e-07 | 60 |
| hsa0516512 | Cervix | CC | Human papillomavirus infection | 74/1267 | 331/8465 | 1.70e-04 | 1.02e-03 | 6.03e-04 | 74 |
| hsa0431012 | Cervix | CC | Wnt signaling pathway | 43/1267 | 171/8465 | 3.03e-04 | 1.64e-03 | 9.68e-04 | 43 |
| hsa0439013 | Cervix | CC | Hippo signaling pathway | 40/1267 | 157/8465 | 3.64e-04 | 1.82e-03 | 1.07e-03 | 40 |
| hsa0522513 | Cervix | CC | Hepatocellular carcinoma | 40/1267 | 168/8465 | 1.52e-03 | 6.39e-03 | 3.78e-03 | 40 |
| hsa052241 | Cervix | CC | Breast cancer | 32/1267 | 147/8465 | 1.66e-02 | 4.88e-02 | 2.88e-02 | 32 |
| hsa05022210 | Esophagus | ESCC | Pathways of neurodegeneration - multiple diseases | 318/4205 | 476/8465 | 6.10e-15 | 2.04e-13 | 1.05e-13 | 318 |
| hsa05010210 | Esophagus | ESCC | Alzheimer disease | 263/4205 | 384/8465 | 1.80e-14 | 5.47e-13 | 2.80e-13 | 263 |
| hsa0516510 | Esophagus | ESCC | Human papillomavirus infection | 215/4205 | 331/8465 | 7.86e-09 | 7.12e-08 | 3.65e-08 | 215 |
| hsa0520529 | Esophagus | ESCC | Proteoglycans in cancer | 138/4205 | 205/8465 | 1.79e-07 | 1.40e-06 | 7.15e-07 | 138 |
| Page: 1 2 3 |
Top |
Cell-cell communication analysis |
| Identification of potential cell-cell interactions between two cell types and their ligand-receptor pairs for different disease states |
| Ligand | Receptor | LRpair | Pathway | Tissue | Disease Stage |
| WNT5A | FZD6 | WNT5A_FZD6 | ncWNT | Cervix | ADJ |
| WNT7B | FZD6_LRP5 | WNT7B_FZD6_LRP5 | WNT | Cervix | ADJ |
| WNT5A | FZD6 | WNT5A_FZD6 | ncWNT | Cervix | CC |
| WNT5B | FZD6 | WNT5B_FZD6 | ncWNT | Cervix | CC |
| WNT2B | FZD6_LRP5 | WNT2B_FZD6_LRP5 | WNT | Cervix | CC |
| WNT9A | FZD6_LRP5 | WNT9A_FZD6_LRP5 | WNT | Cervix | CC |
| WNT2B | FZD6_LRP6 | WNT2B_FZD6_LRP6 | WNT | Cervix | CC |
| WNT9A | FZD6_LRP6 | WNT9A_FZD6_LRP6 | WNT | Cervix | CC |
| WNT5B | FZD6 | WNT5B_FZD6 | ncWNT | CRC | MSI-H |
| WNT5A | FZD6 | WNT5A_FZD6 | ncWNT | Endometrium | ADJ |
| WNT2 | FZD6_LRP5 | WNT2_FZD6_LRP5 | WNT | Endometrium | ADJ |
| WNT4 | FZD6_LRP5 | WNT4_FZD6_LRP5 | WNT | Endometrium | ADJ |
| WNT2 | FZD6_LRP6 | WNT2_FZD6_LRP6 | WNT | Endometrium | ADJ |
| WNT4 | FZD6_LRP6 | WNT4_FZD6_LRP6 | WNT | Endometrium | ADJ |
| WNT2 | FZD6_LRP6 | WNT2_FZD6_LRP6 | WNT | Endometrium | EEC |
| WNT2B | FZD6_LRP6 | WNT2B_FZD6_LRP6 | WNT | Endometrium | EEC |
| WNT5A | FZD6 | WNT5A_FZD6 | ncWNT | Esophagus | ESCC |
| WNT5B | FZD6 | WNT5B_FZD6 | ncWNT | Esophagus | ESCC |
| WNT10A | FZD6_LRP6 | WNT10A_FZD6_LRP6 | WNT | Esophagus | ESCC |
| WNT10B | FZD6_LRP6 | WNT10B_FZD6_LRP6 | WNT | Esophagus | ESCC |
| Page: 1 |
Top |
Single-cell gene regulatory network inference analysis |
| Find out the significant the regulons (TFs) and the target genes of each regulon across cell types for different disease states |
| TF | Cell Type | Tissue | Disease Stage | Target Gene | RSS | Regulon Activity |
| ∗The dot plots of a searched regulon are shown for all cell subpopulations in each disease state of each tissue based on the regulon specific score inferred using pySCENIC and by calculating the average expression. |
| Page: 1 |
Top |
Somatic mutation of malignant transformation related genes |
| Annotation of somatic variants for genes involved in malignant transformation |
| Hugo Symbol | Variant Class | Variant Classification | dbSNP RS | HGVSc | HGVSp | HGVSp Short | SWISSPROT | BIOTYPE | SIFT | PolyPhen | Tumor Sample Barcode | Tissue | Histology | Sex | Age | Stage | Therapy Types | Drugs | Outcome |
| FZD6 | SNV | Missense_Mutation | c.795N>C | p.Glu265Asp | p.E265D | O60353 | protein_coding | tolerated(0.47) | benign(0.02) | TCGA-A8-A08F-01 | Breast | breast invasive carcinoma | Female | <65 | III/IV | Chemotherapy | 5-fluorouracil | CR | |
| FZD6 | SNV | Missense_Mutation | novel | c.1516N>G | p.Phe506Val | p.F506V | O60353 | protein_coding | deleterious(0.01) | probably_damaging(0.996) | TCGA-A8-A08R-01 | Breast | breast invasive carcinoma | Female | <65 | I/II | Unknown | Unknown | SD |
| FZD6 | SNV | Missense_Mutation | rs201432167 | c.1939N>T | p.Arg647Trp | p.R647W | O60353 | protein_coding | deleterious_low_confidence(0) | benign(0.394) | TCGA-BH-A204-01 | Breast | breast invasive carcinoma | Female | >=65 | I/II | Unknown | Unknown | SD |
| FZD6 | SNV | Missense_Mutation | c.1045N>A | p.Glu349Lys | p.E349K | O60353 | protein_coding | deleterious(0) | probably_damaging(1) | TCGA-D8-A1JA-01 | Breast | breast invasive carcinoma | Female | <65 | III/IV | Chemotherapy | adriamycin | PD | |
| FZD6 | SNV | Missense_Mutation | novel | c.226N>C | p.Phe76Leu | p.F76L | O60353 | protein_coding | deleterious(0) | probably_damaging(0.996) | TCGA-LL-A8F5-01 | Breast | breast invasive carcinoma | Female | <65 | I/II | Chemotherapy | cyclophosphamide | SD |
| FZD6 | SNV | Missense_Mutation | rs186016315 | c.1213C>T | p.Arg405Trp | p.R405W | O60353 | protein_coding | deleterious(0) | probably_damaging(0.993) | TCGA-EA-A410-01 | Cervix | cervical & endocervical cancer | Female | <65 | I/II | Unknown | Unknown | SD |
| FZD6 | SNV | Missense_Mutation | c.683N>C | p.Arg228Thr | p.R228T | O60353 | protein_coding | deleterious(0) | probably_damaging(0.998) | TCGA-EK-A2H0-01 | Cervix | cervical & endocervical cancer | Female | <65 | I/II | Chemotherapy | cisplatin | CR | |
| FZD6 | SNV | Missense_Mutation | rs763949530 | c.1247N>A | p.Arg416Gln | p.R416Q | O60353 | protein_coding | deleterious(0) | probably_damaging(0.998) | TCGA-FU-A3HZ-01 | Cervix | cervical & endocervical cancer | Female | <65 | I/II | Chemotherapy | cisplatin | CR |
| FZD6 | SNV | Missense_Mutation | c.683N>C | p.Arg228Thr | p.R228T | O60353 | protein_coding | deleterious(0) | probably_damaging(0.998) | TCGA-ZJ-A8QQ-01 | Cervix | cervical & endocervical cancer | Female | <65 | I/II | Chemotherapy | cisplatin | SD | |
| FZD6 | SNV | Missense_Mutation | novel | c.383N>G | p.Tyr128Cys | p.Y128C | O60353 | protein_coding | tolerated(0.17) | possibly_damaging(0.796) | TCGA-AA-3837-01 | Colorectum | colon adenocarcinoma | Male | >=65 | I/II | Unknown | Unknown | SD |
| Page: 1 2 3 4 5 6 7 8 9 10 |
Top |
Related drugs of malignant transformation related genes |
| Identification of chemicals and drugs interact with genes involved in malignant transfromation |
| (DGIdb 4.0) |
| Entrez ID | Symbol | Category | Interaction Types | Drug Claim Name | Drug Name | PMIDs |
| 8323 | FZD6 | CELL SURFACE, G PROTEIN COUPLED RECEPTOR, KINASE | agonist | 135651914 | ||
| 8323 | FZD6 | CELL SURFACE, G PROTEIN COUPLED RECEPTOR, KINASE | agonist | 135651915 | ||
| 8323 | FZD6 | CELL SURFACE, G PROTEIN COUPLED RECEPTOR, KINASE | agonist | 135651916 | ||
| 8323 | FZD6 | CELL SURFACE, G PROTEIN COUPLED RECEPTOR, KINASE | agonist | 381745008 |
| Page: 1 |

Copyright 2023-Present -The University of Texas Health Science Center at Houston |