
|
|||||
|
 | |
| |
| |
| |
| |
| |
|
Gene: FYCO1 |
Gene summary for FYCO1 |
| Gene information | Species | Human | Gene symbol | FYCO1 | Gene ID | 79443 |
| Gene name | FYVE and coiled-coil domain autophagy adaptor 1 | |
| Gene Alias | CATC2 | |
| Cytomap | 3p21.31 | |
| Gene Type | protein-coding | GO ID | GO:0006810 | UniProtAcc | Q9BQS8 |
Top |
Malignant transformation analysis |
| Identification of the aberrant gene expression in precancerous and cancerous lesions by comparing the gene expression of stem-like cells in diseased tissues with normal stem cells |
| Entrez ID | Symbol | Replicates | Species | Organ | Tissue | Adj P-value | Log2FC | Malignancy |
| 79443 | FYCO1 | HCC1_Meng | Human | Liver | HCC | 6.57e-17 | 3.50e-02 | 0.0246 |
| 79443 | FYCO1 | HCC2 | Human | Liver | HCC | 1.57e-03 | 3.31e+00 | 0.5341 |
| 79443 | FYCO1 | S014 | Human | Liver | HCC | 2.12e-02 | 2.85e-01 | 0.2254 |
| 79443 | FYCO1 | S016 | Human | Liver | HCC | 1.66e-03 | 2.49e-01 | 0.2243 |
| 79443 | FYCO1 | S027 | Human | Liver | HCC | 2.68e-04 | 4.79e-01 | 0.2446 |
| 79443 | FYCO1 | S028 | Human | Liver | HCC | 8.26e-14 | 5.79e-01 | 0.2503 |
| 79443 | FYCO1 | S029 | Human | Liver | HCC | 3.15e-09 | 4.91e-01 | 0.2581 |
| Page: 1 |
| Tissue | Expression Dynamics | Abbreviation |
| Liver | 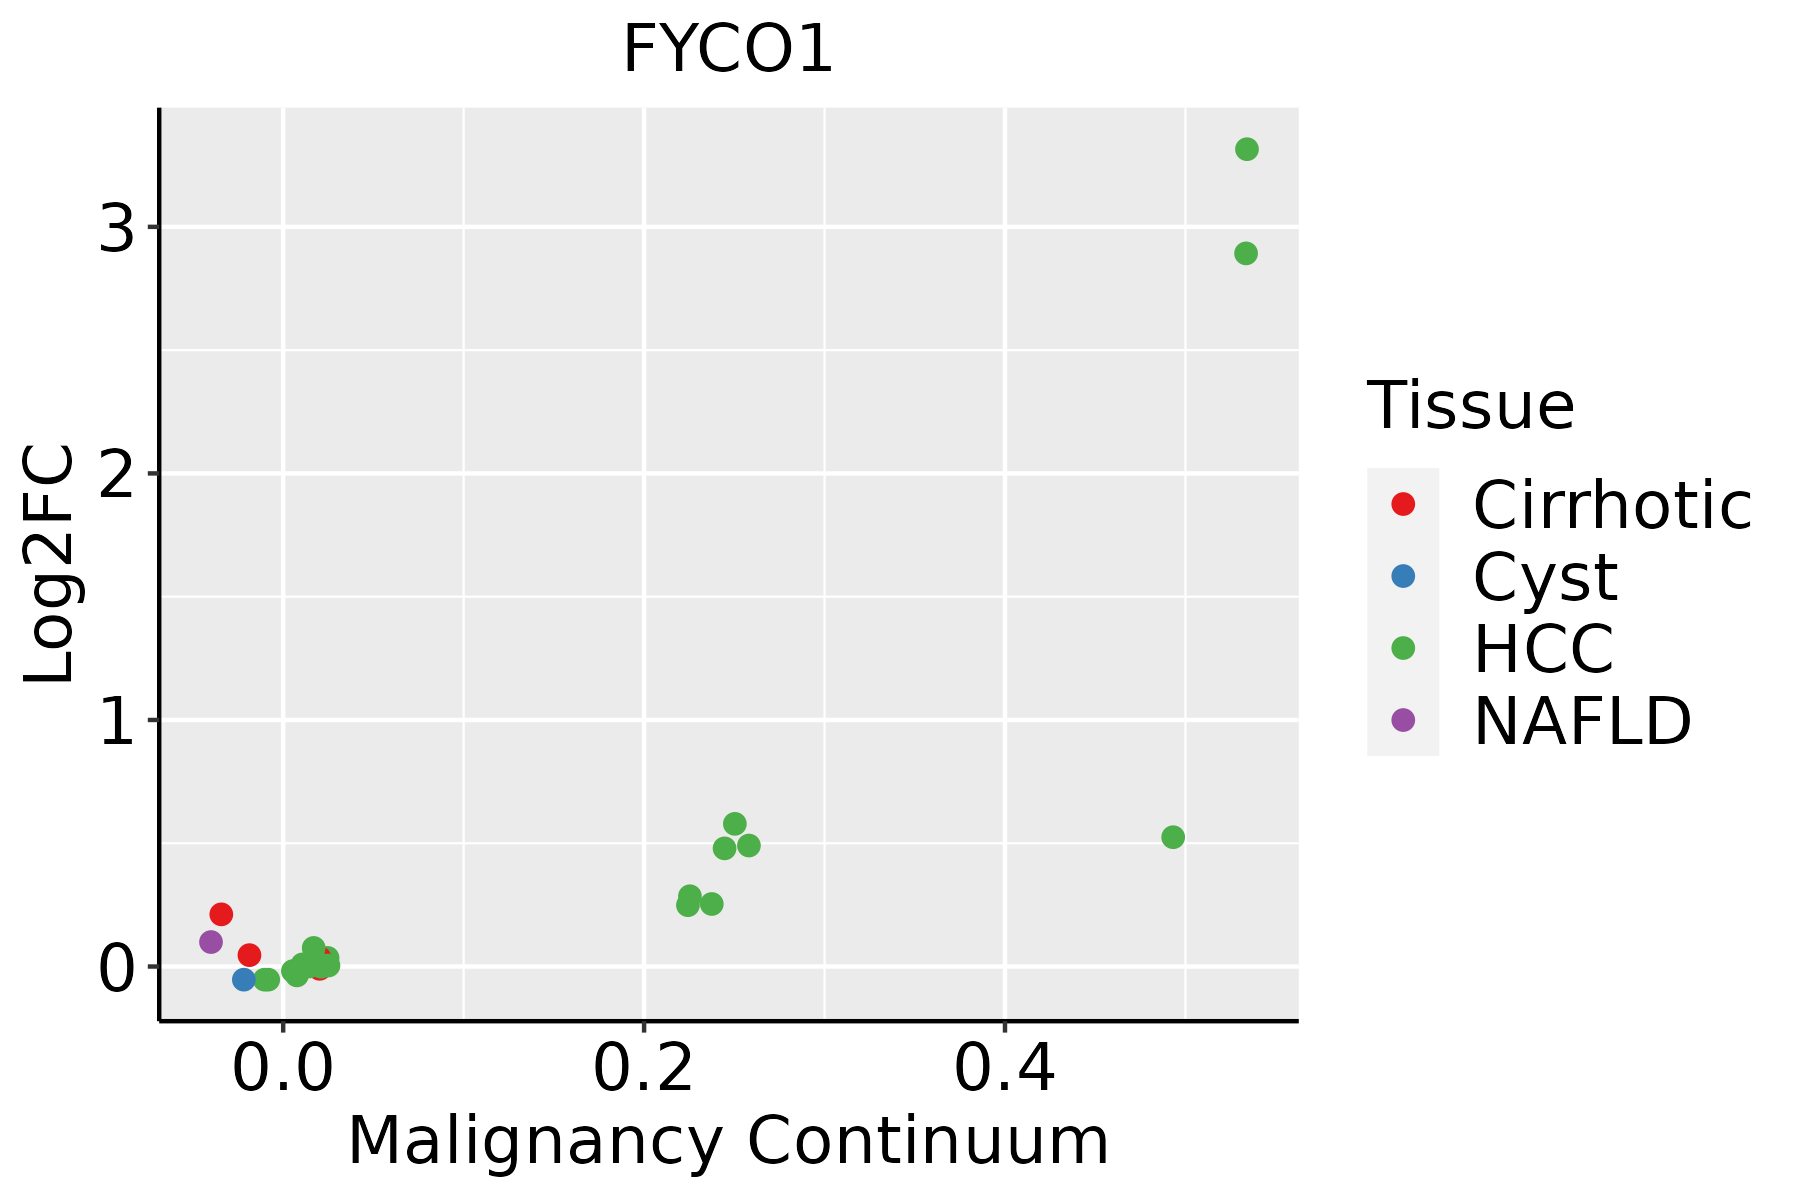 | HCC: Hepatocellular carcinoma |
| NAFLD: Non-alcoholic fatty liver disease |
| ∗log2FC in expression of this searched gene in stem-like cells from each diseased tissue sample relative to stem-like cells in normal samples in each tissue plotted against the malignancy continuum. Samples are colored based on if they are from different disease stage. |
Top |
Malignant transformation related pathway analysis |
| Find out the enriched GO biological processes and KEGG pathways involved in transition from healthy to precancer to cancer |
| Tissue | Disease Stage | Enriched GO biological Processes |
| Colorectum | AD |  |
| Colorectum | SER |  |
| Colorectum | MSS |  |
| Colorectum | MSI-H |  |
| Colorectum | FAP |  |
| ∗Top 15 enriched GO BP terms are showed in the bar plot of each disease state in each tissue. Each row represents a significant GO biological process which is colored according to the -log10(p.adjust). |
| Page: 1 2 3 4 5 6 7 8 9 |
| GO ID | Tissue | Disease Stage | Description | Gene Ratio | Bg Ratio | pvalue | p.adjust | Count |
| GO:000989622 | Liver | HCC | positive regulation of catabolic process | 335/7958 | 492/18723 | 3.83e-31 | 1.87e-28 | 335 |
| GO:003133122 | Liver | HCC | positive regulation of cellular catabolic process | 295/7958 | 427/18723 | 3.20e-29 | 1.45e-26 | 295 |
| GO:001623621 | Liver | HCC | macroautophagy | 204/7958 | 291/18723 | 8.66e-22 | 1.41e-19 | 204 |
| GO:002241112 | Liver | HCC | cellular component disassembly | 282/7958 | 443/18723 | 1.02e-19 | 1.38e-17 | 282 |
| GO:001050621 | Liver | HCC | regulation of autophagy | 210/7958 | 317/18723 | 7.59e-18 | 8.45e-16 | 210 |
| GO:005165621 | Liver | HCC | establishment of organelle localization | 226/7958 | 390/18723 | 4.15e-10 | 1.34e-08 | 226 |
| GO:001624111 | Liver | HCC | regulation of macroautophagy | 96/7958 | 141/18723 | 6.82e-10 | 2.14e-08 | 96 |
| GO:003298411 | Liver | HCC | protein-containing complex disassembly | 138/7958 | 224/18723 | 5.59e-09 | 1.46e-07 | 138 |
| GO:005165021 | Liver | HCC | establishment of vesicle localization | 103/7958 | 161/18723 | 2.94e-08 | 6.69e-07 | 103 |
| GO:00105082 | Liver | HCC | positive regulation of autophagy | 81/7958 | 124/18723 | 2.34e-07 | 4.17e-06 | 81 |
| GO:005164821 | Liver | HCC | vesicle localization | 107/7958 | 177/18723 | 1.05e-06 | 1.57e-05 | 107 |
| GO:00723843 | Liver | HCC | organelle transport along microtubule | 56/7958 | 85/18723 | 1.13e-05 | 1.29e-04 | 56 |
| GO:00973521 | Liver | HCC | autophagosome maturation | 30/7958 | 40/18723 | 3.04e-05 | 3.12e-04 | 30 |
| GO:003070521 | Liver | HCC | cytoskeleton-dependent intracellular transport | 111/7958 | 195/18723 | 3.25e-05 | 3.28e-04 | 111 |
| GO:0047496 | Liver | HCC | vesicle transport along microtubule | 34/7958 | 47/18723 | 3.27e-05 | 3.29e-04 | 34 |
| GO:00109702 | Liver | HCC | transport along microtubule | 90/7958 | 155/18723 | 6.49e-05 | 5.92e-04 | 90 |
| GO:0016239 | Liver | HCC | positive regulation of macroautophagy | 41/7958 | 63/18723 | 2.47e-04 | 1.84e-03 | 41 |
| GO:00995182 | Liver | HCC | vesicle cytoskeletal trafficking | 46/7958 | 73/18723 | 3.23e-04 | 2.28e-03 | 46 |
| GO:00432444 | Liver | HCC | regulation of protein-containing complex disassembly | 66/7958 | 121/18723 | 4.94e-03 | 2.07e-02 | 66 |
| Page: 1 |
| Pathway ID | Tissue | Disease Stage | Description | Gene Ratio | Bg Ratio | pvalue | p.adjust | qvalue | Count |
| hsa0513242 | Liver | HCC | Salmonella infection | 178/4020 | 249/8465 | 5.90e-15 | 1.98e-13 | 1.10e-13 | 178 |
| hsa0513252 | Liver | HCC | Salmonella infection | 178/4020 | 249/8465 | 5.90e-15 | 1.98e-13 | 1.10e-13 | 178 |
| Page: 1 |
Top |
Cell-cell communication analysis |
| Identification of potential cell-cell interactions between two cell types and their ligand-receptor pairs for different disease states |
| Ligand | Receptor | LRpair | Pathway | Tissue | Disease Stage |
| Page: 1 |
Top |
Single-cell gene regulatory network inference analysis |
| Find out the significant the regulons (TFs) and the target genes of each regulon across cell types for different disease states |
| TF | Cell Type | Tissue | Disease Stage | Target Gene | RSS | Regulon Activity |
| ∗The dot plots of a searched regulon are shown for all cell subpopulations in each disease state of each tissue based on the regulon specific score inferred using pySCENIC and by calculating the average expression. |
| Page: 1 |
Top |
Somatic mutation of malignant transformation related genes |
| Annotation of somatic variants for genes involved in malignant transformation |
| Hugo Symbol | Variant Class | Variant Classification | dbSNP RS | HGVSc | HGVSp | HGVSp Short | SWISSPROT | BIOTYPE | SIFT | PolyPhen | Tumor Sample Barcode | Tissue | Histology | Sex | Age | Stage | Therapy Types | Drugs | Outcome |
| FYCO1 | SNV | Missense_Mutation | novel | c.2753N>C | p.Glu918Ala | p.E918A | Q9BQS8 | protein_coding | deleterious(0) | probably_damaging(0.992) | TCGA-AN-A046-01 | Breast | breast invasive carcinoma | Female | >=65 | I/II | Unknown | Unknown | SD |
| FYCO1 | SNV | Missense_Mutation | c.4159N>G | p.Thr1387Ala | p.T1387A | Q9BQS8 | protein_coding | deleterious(0.04) | possibly_damaging(0.872) | TCGA-AN-A0AK-01 | Breast | breast invasive carcinoma | Female | >=65 | I/II | Unknown | Unknown | SD | |
| FYCO1 | SNV | Missense_Mutation | c.2548G>C | p.Glu850Gln | p.E850Q | Q9BQS8 | protein_coding | deleterious(0.03) | possibly_damaging(0.886) | TCGA-BH-A0BZ-01 | Breast | breast invasive carcinoma | Female | <65 | III/IV | Chemotherapy | doxorubicin | CR | |
| FYCO1 | SNV | Missense_Mutation | c.2950N>G | p.Gln984Glu | p.Q984E | Q9BQS8 | protein_coding | tolerated(0.54) | benign(0.018) | TCGA-BH-A18P-01 | Breast | breast invasive carcinoma | Female | <65 | I/II | Unknown | Unknown | PD | |
| FYCO1 | SNV | Missense_Mutation | c.655N>C | p.Asp219His | p.D219H | Q9BQS8 | protein_coding | deleterious(0) | probably_damaging(0.979) | TCGA-D8-A1JA-01 | Breast | breast invasive carcinoma | Female | <65 | III/IV | Chemotherapy | adriamycin | PD | |
| FYCO1 | SNV | Missense_Mutation | c.8N>G | p.Ser3Cys | p.S3C | Q9BQS8 | protein_coding | deleterious(0.01) | possibly_damaging(0.873) | TCGA-D8-A27G-01 | Breast | breast invasive carcinoma | Female | >=65 | I/II | Unknown | Unknown | SD | |
| FYCO1 | deletion | Frame_Shift_Del | novel | c.2606delN | p.Glu869GlyfsTer47 | p.E869Gfs*47 | Q9BQS8 | protein_coding | TCGA-D8-A27V-01 | Breast | breast invasive carcinoma | Female | <65 | I/II | Hormone Therapy | tamoxiphen | SD | ||
| FYCO1 | SNV | Missense_Mutation | rs201358723 | c.844C>T | p.Arg282Cys | p.R282C | Q9BQS8 | protein_coding | tolerated(0.2) | benign(0.001) | TCGA-2W-A8YY-01 | Cervix | cervical & endocervical cancer | Female | <65 | I/II | Chemotherapy | cisplatin | CR |
| FYCO1 | SNV | Missense_Mutation | rs774439678 | c.754C>T | p.Arg252Cys | p.R252C | Q9BQS8 | protein_coding | deleterious(0) | possibly_damaging(0.8) | TCGA-2W-A8YY-01 | Cervix | cervical & endocervical cancer | Female | <65 | I/II | Chemotherapy | cisplatin | CR |
| FYCO1 | SNV | Missense_Mutation | c.1858N>A | p.Glu620Lys | p.E620K | Q9BQS8 | protein_coding | tolerated(0.36) | benign(0.003) | TCGA-C5-A1M6-01 | Cervix | cervical & endocervical cancer | Female | <65 | I/II | Chemotherapy | cisplatin | PD |
| Page: 1 2 3 4 5 6 7 8 9 10 11 12 13 |
Top |
Related drugs of malignant transformation related genes |
| Identification of chemicals and drugs interact with genes involved in malignant transfromation |
| (DGIdb 4.0) |
| Entrez ID | Symbol | Category | Interaction Types | Drug Claim Name | Drug Name | PMIDs |
| Page: 1 |

Copyright 2023-Present -The University of Texas Health Science Center at Houston |