
|
|||||
|
 | |
| |
| |
| |
| |
| |
|
Gene: FYB |
Gene summary for FYB |
| Gene information | Species | Human | Gene symbol | FYB | Gene ID | 2533 |
| Gene name | FYN binding protein 1 | |
| Gene Alias | ADAP | |
| Cytomap | 5p13.1 | |
| Gene Type | protein-coding | GO ID | GO:0002253 | UniProtAcc | O15117 |
Top |
Malignant transformation analysis |
| Identification of the aberrant gene expression in precancerous and cancerous lesions by comparing the gene expression of stem-like cells in diseased tissues with normal stem cells |
| Entrez ID | Symbol | Replicates | Species | Organ | Tissue | Adj P-value | Log2FC | Malignancy |
| 2533 | FYB | P8T-E | Human | Esophagus | ESCC | 7.07e-03 | 1.29e-01 | 0.0889 |
| 2533 | FYB | P11T-E | Human | Esophagus | ESCC | 5.85e-07 | 5.91e-01 | 0.1426 |
| 2533 | FYB | P17T-E | Human | Esophagus | ESCC | 7.99e-07 | 5.69e-01 | 0.1278 |
| 2533 | FYB | P22T-E | Human | Esophagus | ESCC | 8.86e-04 | 1.33e-01 | 0.1236 |
| 2533 | FYB | P24T-E | Human | Esophagus | ESCC | 1.25e-18 | 6.76e-01 | 0.1287 |
| 2533 | FYB | P47T-E | Human | Esophagus | ESCC | 1.50e-19 | 7.33e-01 | 0.1067 |
| 2533 | FYB | P52T-E | Human | Esophagus | ESCC | 3.00e-11 | 3.31e-01 | 0.1555 |
| 2533 | FYB | P54T-E | Human | Esophagus | ESCC | 1.15e-16 | 7.56e-01 | 0.0975 |
| 2533 | FYB | P62T-E | Human | Esophagus | ESCC | 2.40e-04 | 5.33e-01 | 0.1302 |
| 2533 | FYB | P75T-E | Human | Esophagus | ESCC | 3.14e-23 | 7.24e-01 | 0.1125 |
| 2533 | FYB | P128T-E | Human | Esophagus | ESCC | 3.21e-17 | 7.27e-01 | 0.1241 |
| 2533 | FYB | HCC1_Meng | Human | Liver | HCC | 4.35e-06 | -1.57e-02 | 0.0246 |
| 2533 | FYB | HCC2 | Human | Liver | HCC | 2.06e-07 | 1.07e+00 | 0.5341 |
| 2533 | FYB | HCC5 | Human | Liver | HCC | 3.49e-30 | 2.73e+00 | 0.4932 |
| 2533 | FYB | Pt13.a | Human | Liver | HCC | 1.20e-07 | 2.83e-01 | 0.021 |
| 2533 | FYB | Pt13.b | Human | Liver | HCC | 4.50e-02 | 1.18e-02 | 0.0251 |
| 2533 | FYB | Pt13.c | Human | Liver | HCC | 4.43e-05 | 4.69e-01 | 0.0076 |
| 2533 | FYB | Pt14.d | Human | Liver | HCC | 9.44e-22 | 5.20e-01 | 0.0143 |
| 2533 | FYB | C04 | Human | Oral cavity | OSCC | 5.42e-13 | 5.94e-01 | 0.2633 |
| 2533 | FYB | C21 | Human | Oral cavity | OSCC | 1.96e-38 | 1.22e+00 | 0.2678 |
| Page: 1 2 |
| Tissue | Expression Dynamics | Abbreviation |
| Esophagus | 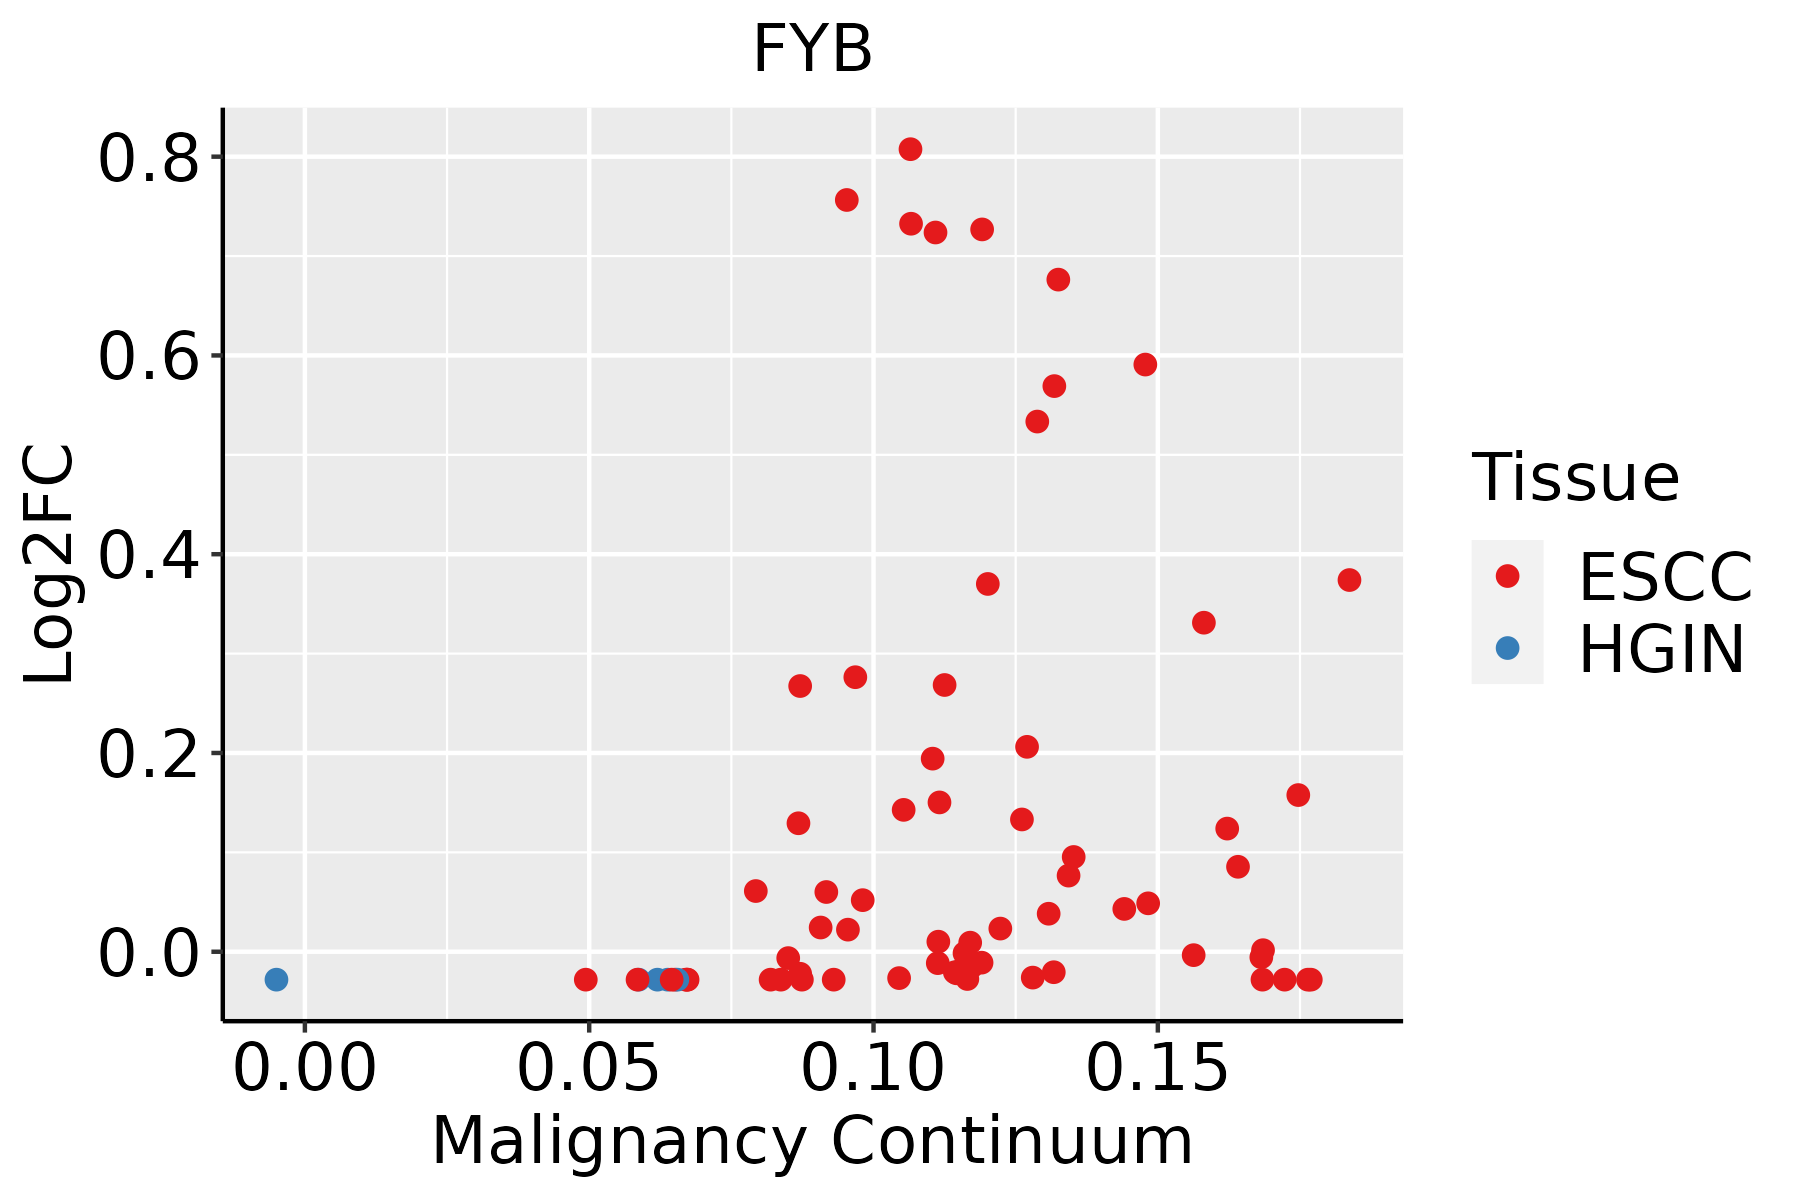 | ESCC: Esophageal squamous cell carcinoma |
| HGIN: High-grade intraepithelial neoplasias | ||
| LGIN: Low-grade intraepithelial neoplasias | ||
| Liver | 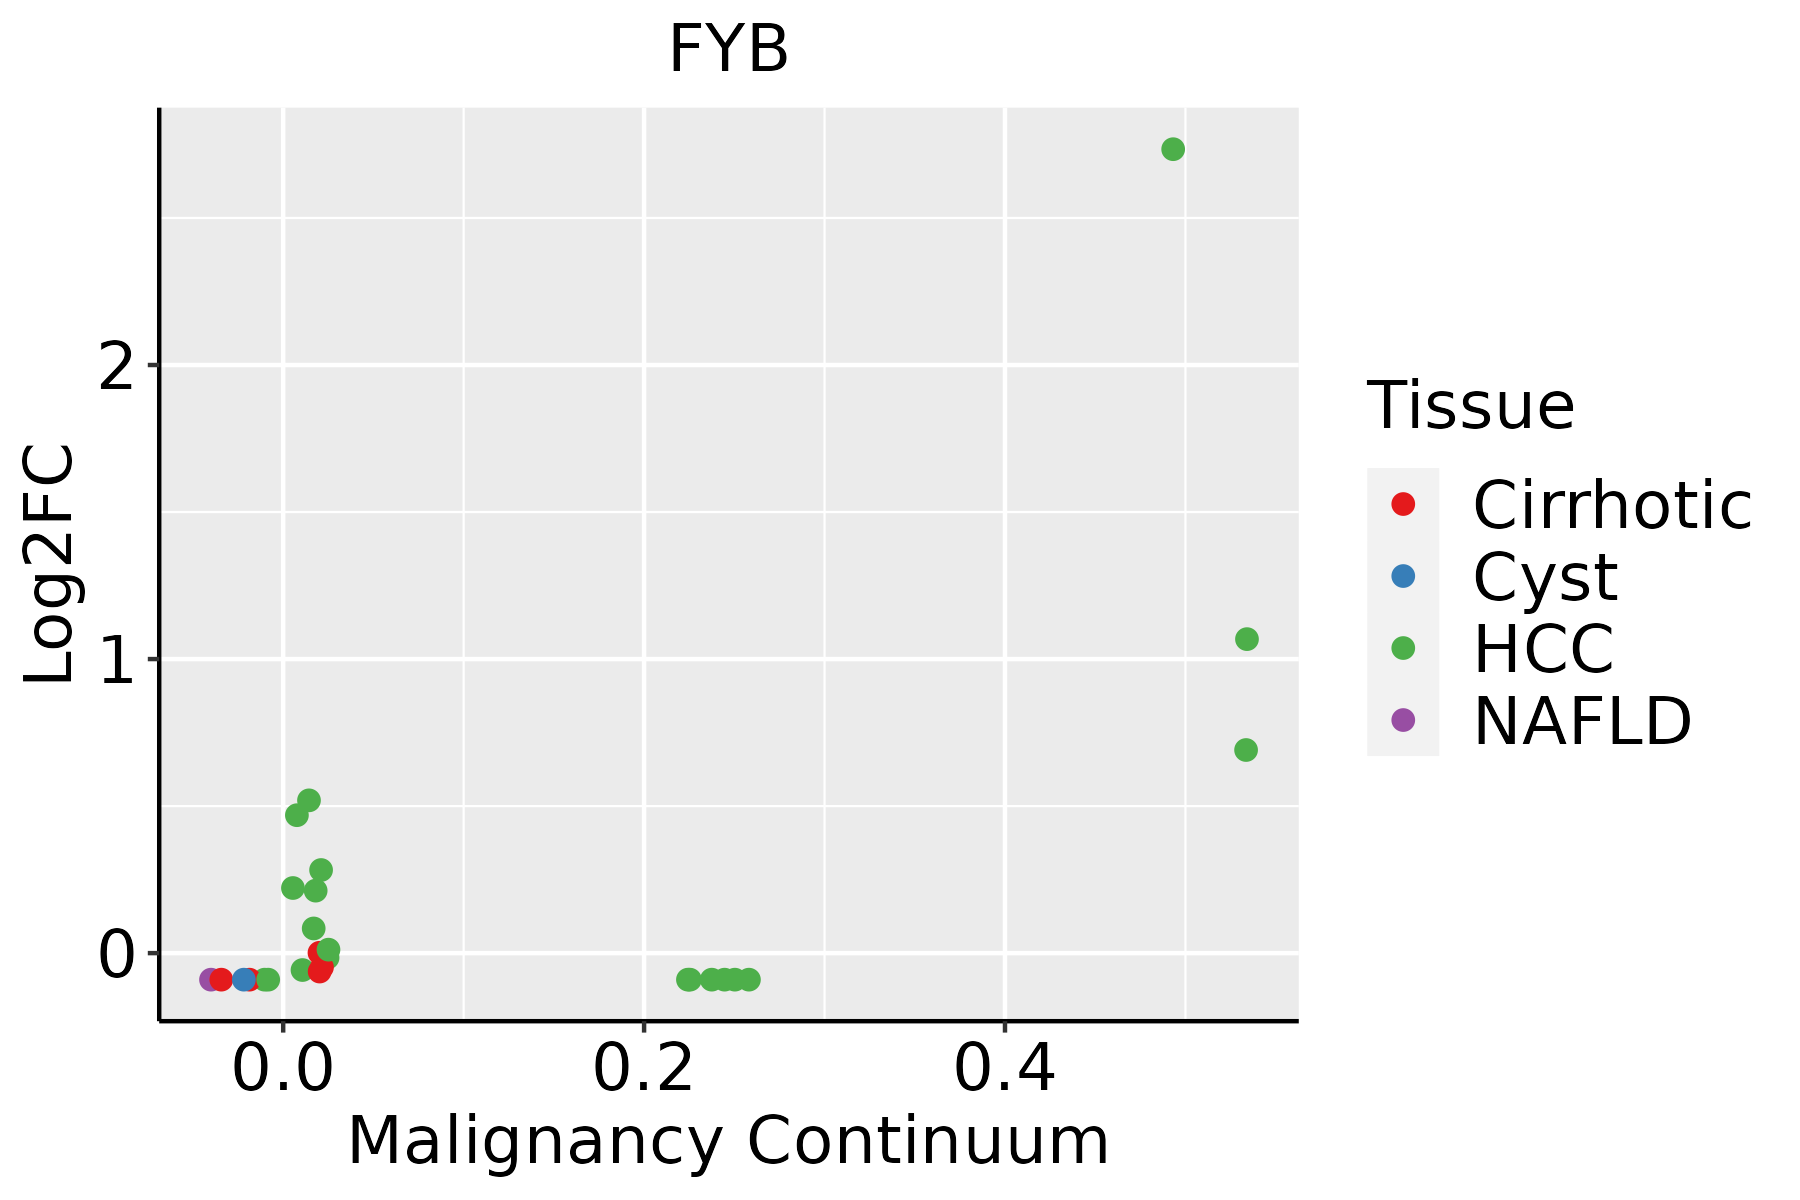 | HCC: Hepatocellular carcinoma |
| NAFLD: Non-alcoholic fatty liver disease | ||
| Oral Cavity | 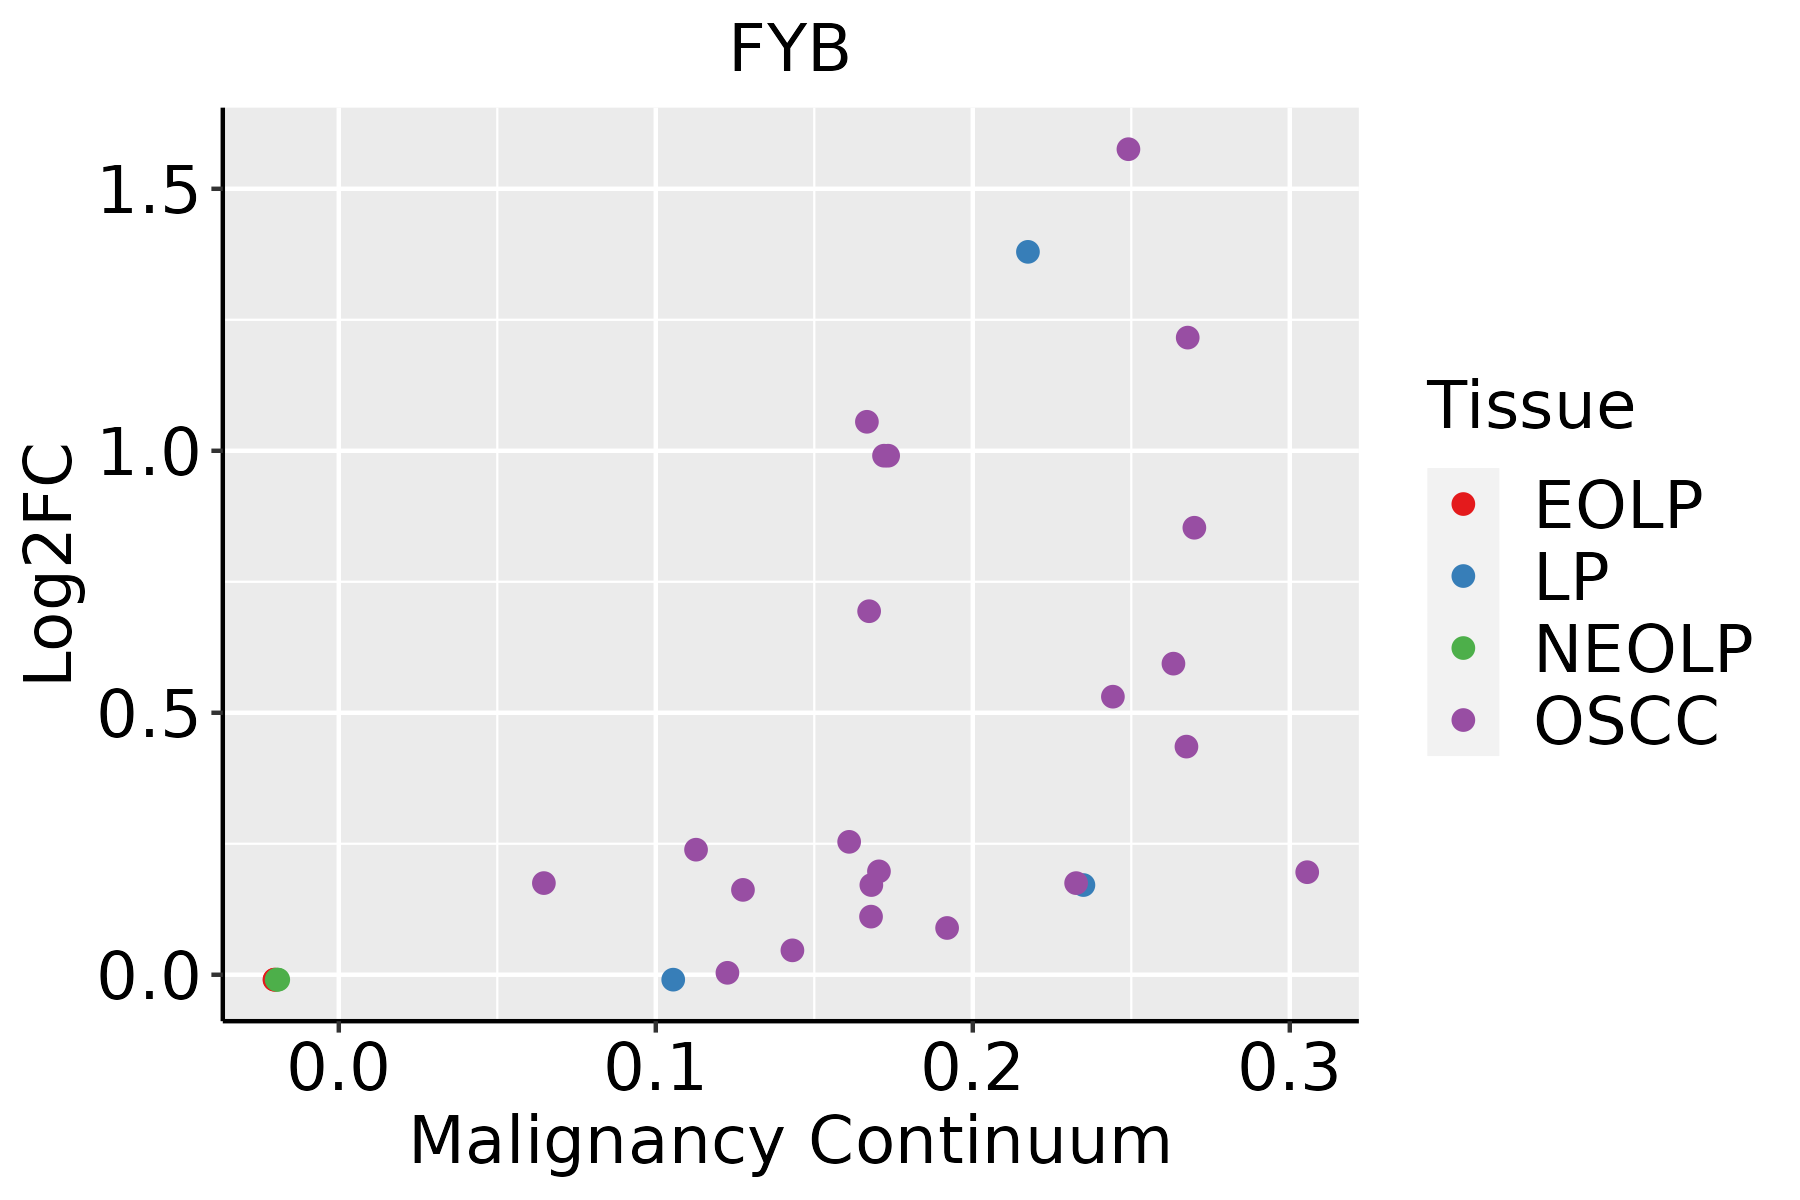 | EOLP: Erosive Oral lichen planus |
| LP: leukoplakia | ||
| NEOLP: Non-erosive oral lichen planus | ||
| OSCC: Oral squamous cell carcinoma |
| ∗log2FC in expression of this searched gene in stem-like cells from each diseased tissue sample relative to stem-like cells in normal samples in each tissue plotted against the malignancy continuum. Samples are colored based on if they are from different disease stage. |
Top |
Malignant transformation related pathway analysis |
| Find out the enriched GO biological processes and KEGG pathways involved in transition from healthy to precancer to cancer |
| Tissue | Disease Stage | Enriched GO biological Processes |
| Colorectum | AD |  |
| Colorectum | SER |  |
| Colorectum | MSS |  |
| Colorectum | MSI-H |  |
| Colorectum | FAP |  |
| ∗Top 15 enriched GO BP terms are showed in the bar plot of each disease state in each tissue. Each row represents a significant GO biological process which is colored according to the -log10(p.adjust). |
| Page: 1 2 3 4 5 6 7 8 9 |
| GO ID | Tissue | Disease Stage | Description | Gene Ratio | Bg Ratio | pvalue | p.adjust | Count |
| GO:007265910 | Cervix | CC | protein localization to plasma membrane | 73/2311 | 284/18723 | 4.95e-10 | 6.73e-08 | 73 |
| GO:19907788 | Cervix | CC | protein localization to cell periphery | 78/2311 | 333/18723 | 1.22e-08 | 9.73e-07 | 78 |
| GO:00072295 | Cervix | CC | integrin-mediated signaling pathway | 34/2311 | 107/18723 | 1.01e-07 | 5.25e-06 | 34 |
| GO:00027644 | Cervix | CC | immune response-regulating signaling pathway | 97/2311 | 468/18723 | 1.49e-07 | 7.07e-06 | 97 |
| GO:00022533 | Cervix | CC | activation of immune response | 72/2311 | 375/18723 | 8.26e-05 | 1.11e-03 | 72 |
| GO:0002768 | Cervix | CC | immune response-regulating cell surface receptor signaling pathway | 59/2311 | 315/18723 | 6.64e-04 | 6.11e-03 | 59 |
| GO:00508524 | Cervix | CC | T cell receptor signaling pathway | 27/2311 | 123/18723 | 1.93e-03 | 1.42e-02 | 27 |
| GO:000225312 | Cervix | HSIL_HPV | activation of immune response | 40/737 | 375/18723 | 1.12e-08 | 1.30e-06 | 40 |
| GO:000276411 | Cervix | HSIL_HPV | immune response-regulating signaling pathway | 46/737 | 468/18723 | 1.17e-08 | 1.30e-06 | 46 |
| GO:000722913 | Cervix | HSIL_HPV | integrin-mediated signaling pathway | 19/737 | 107/18723 | 3.37e-08 | 2.76e-06 | 19 |
| GO:00027681 | Cervix | HSIL_HPV | immune response-regulating cell surface receptor signaling pathway | 32/737 | 315/18723 | 9.80e-07 | 4.68e-05 | 32 |
| GO:0002429 | Cervix | HSIL_HPV | immune response-activating cell surface receptor signaling pathway | 28/737 | 291/18723 | 1.29e-05 | 4.09e-04 | 28 |
| GO:0002757 | Cervix | HSIL_HPV | immune response-activating signal transduction | 28/737 | 291/18723 | 1.29e-05 | 4.09e-04 | 28 |
| GO:00508513 | Cervix | HSIL_HPV | antigen receptor-mediated signaling pathway | 22/737 | 240/18723 | 2.15e-04 | 3.83e-03 | 22 |
| GO:005085211 | Cervix | HSIL_HPV | T cell receptor signaling pathway | 13/737 | 123/18723 | 1.12e-03 | 1.36e-02 | 13 |
| GO:007265913 | Cervix | HSIL_HPV | protein localization to plasma membrane | 21/737 | 284/18723 | 4.36e-03 | 3.68e-02 | 21 |
| GO:007265914 | Endometrium | AEH | protein localization to plasma membrane | 63/2100 | 284/18723 | 7.58e-08 | 3.92e-06 | 63 |
| GO:00072296 | Endometrium | AEH | integrin-mediated signaling pathway | 32/2100 | 107/18723 | 1.24e-07 | 5.80e-06 | 32 |
| GO:19907789 | Endometrium | AEH | protein localization to cell periphery | 68/2100 | 333/18723 | 6.38e-07 | 2.38e-05 | 68 |
| GO:00027645 | Endometrium | AEH | immune response-regulating signaling pathway | 76/2100 | 468/18723 | 5.76e-04 | 5.71e-03 | 76 |
| Page: 1 2 3 |
| Pathway ID | Tissue | Disease Stage | Description | Gene Ratio | Bg Ratio | pvalue | p.adjust | qvalue | Count |
| hsa0401512 | Cervix | CC | Rap1 signaling pathway | 56/1267 | 210/8465 | 6.23e-06 | 5.61e-05 | 3.32e-05 | 56 |
| hsa0513516 | Cervix | CC | Yersinia infection | 39/1267 | 137/8465 | 3.27e-05 | 2.41e-04 | 1.42e-04 | 39 |
| hsa0401513 | Cervix | CC | Rap1 signaling pathway | 56/1267 | 210/8465 | 6.23e-06 | 5.61e-05 | 3.32e-05 | 56 |
| hsa0513517 | Cervix | CC | Yersinia infection | 39/1267 | 137/8465 | 3.27e-05 | 2.41e-04 | 1.42e-04 | 39 |
| hsa0513526 | Esophagus | ESCC | Yersinia infection | 100/4205 | 137/8465 | 1.80e-08 | 1.59e-07 | 8.12e-08 | 100 |
| hsa05135111 | Esophagus | ESCC | Yersinia infection | 100/4205 | 137/8465 | 1.80e-08 | 1.59e-07 | 8.12e-08 | 100 |
| Page: 1 |
Top |
Cell-cell communication analysis |
| Identification of potential cell-cell interactions between two cell types and their ligand-receptor pairs for different disease states |
| Ligand | Receptor | LRpair | Pathway | Tissue | Disease Stage |
| Page: 1 |
Top |
Single-cell gene regulatory network inference analysis |
| Find out the significant the regulons (TFs) and the target genes of each regulon across cell types for different disease states |
| TF | Cell Type | Tissue | Disease Stage | Target Gene | RSS | Regulon Activity |
| ∗The dot plots of a searched regulon are shown for all cell subpopulations in each disease state of each tissue based on the regulon specific score inferred using pySCENIC and by calculating the average expression. |
| Page: 1 |
Top |
Somatic mutation of malignant transformation related genes |
| Annotation of somatic variants for genes involved in malignant transformation |
| Hugo Symbol | Variant Class | Variant Classification | dbSNP RS | HGVSc | HGVSp | HGVSp Short | SWISSPROT | BIOTYPE | SIFT | PolyPhen | Tumor Sample Barcode | Tissue | Histology | Sex | Age | Stage | Therapy Types | Drugs | Outcome |
| FYB | SNV | Missense_Mutation | rs770878983 | c.1598N>T | p.Lys533Ile | p.K533I | O15117 | protein_coding | deleterious(0) | probably_damaging(0.999) | TCGA-A7-A0CE-01 | Breast | breast invasive carcinoma | Female | <65 | I/II | Chemotherapy | adriamycin | SD |
| FYB | SNV | Missense_Mutation | novel | c.2108N>C | p.Gly703Ala | p.G703A | O15117 | protein_coding | deleterious(0.01) | benign(0.027) | TCGA-A7-A6VX-01 | Breast | breast invasive carcinoma | Female | >=65 | I/II | Chemotherapy | docetaxel | CR |
| FYB | SNV | Missense_Mutation | novel | c.590N>G | p.Leu197Arg | p.L197R | O15117 | protein_coding | tolerated(0.1) | benign(0.039) | TCGA-AC-A3W5-01 | Breast | breast invasive carcinoma | Female | >=65 | I/II | Chemotherapy | docetaxel | CR |
| FYB | SNV | Missense_Mutation | novel | c.38N>C | p.Lys13Thr | p.K13T | O15117 | protein_coding | deleterious(0) | probably_damaging(0.994) | TCGA-AO-A128-01 | Breast | breast invasive carcinoma | Female | <65 | I/II | Chemotherapy | doxorubicin | SD |
| FYB | SNV | Missense_Mutation | c.929N>G | p.Asn310Ser | p.N310S | O15117 | protein_coding | tolerated(0.64) | benign(0.003) | TCGA-BH-A0BL-01 | Breast | breast invasive carcinoma | Female | <65 | I/II | Chemotherapy | adriamycin | CR | |
| FYB | SNV | Missense_Mutation | rs769773240 | c.2135N>A | p.Thr712Asn | p.T712N | O15117 | protein_coding | deleterious(0.03) | benign(0.026) | TCGA-C8-A26X-01 | Breast | breast invasive carcinoma | Female | <65 | I/II | Chemotherapy | 5-fluorouracil | CR |
| FYB | SNV | Missense_Mutation | rs746100047 | c.1925N>T | p.Asp642Val | p.D642V | O15117 | protein_coding | deleterious(0) | possibly_damaging(0.726) | TCGA-EW-A1P4-01 | Breast | breast invasive carcinoma | Female | <65 | I/II | Chemotherapy | docetaxel | SD |
| FYB | insertion | Frame_Shift_Ins | novel | c.59_60insTCTTGTTTCCTATCCCAGCAGCATCCGTTGGTCTTTTTTAATGCAA | p.Thr21LeufsTer23 | p.T21Lfs*23 | O15117 | protein_coding | TCGA-A8-A07J-01 | Breast | breast invasive carcinoma | Female | <65 | I/II | Chemotherapy | 5-fluorouracil | CR | ||
| FYB | insertion | Frame_Shift_Ins | rs748874978 | c.1002_1003insG | p.Pro335AlafsTer43 | p.P335Afs*43 | O15117 | protein_coding | TCGA-AN-A0FY-01 | Breast | breast invasive carcinoma | Female | <65 | I/II | Unknown | Unknown | SD | ||
| FYB | SNV | Missense_Mutation | rs757886197 | c.536C>T | p.Ala179Val | p.A179V | O15117 | protein_coding | tolerated(0.87) | benign(0) | TCGA-2W-A8YY-01 | Cervix | cervical & endocervical cancer | Female | <65 | I/II | Chemotherapy | cisplatin | CR |
| Page: 1 2 3 4 5 6 7 8 9 10 11 12 13 14 15 |
Top |
Related drugs of malignant transformation related genes |
| Identification of chemicals and drugs interact with genes involved in malignant transfromation |
| (DGIdb 4.0) |
| Entrez ID | Symbol | Category | Interaction Types | Drug Claim Name | Drug Name | PMIDs |
| Page: 1 |

Copyright 2023-Present -The University of Texas Health Science Center at Houston |