
|
|||||
|
 | |
| |
| |
| |
| |
| |
|
Gene: FXYD6 |
Gene summary for FXYD6 |
| Gene information | Species | Human | Gene symbol | FXYD6 | Gene ID | 53826 |
| Gene name | FXYD domain containing ion transport regulator 6 | |
| Gene Alias | FXYD6 | |
| Cytomap | 11q23.3 | |
| Gene Type | protein-coding | GO ID | GO:0002028 | UniProtAcc | A0A024R3J8 |
Top |
Malignant transformation analysis |
| Identification of the aberrant gene expression in precancerous and cancerous lesions by comparing the gene expression of stem-like cells in diseased tissues with normal stem cells |
| Entrez ID | Symbol | Replicates | Species | Organ | Tissue | Adj P-value | Log2FC | Malignancy |
| 53826 | FXYD6 | LZE2T | Human | Esophagus | ESCC | 1.22e-02 | 4.34e-01 | 0.082 |
| 53826 | FXYD6 | LZE7T | Human | Esophagus | ESCC | 7.33e-05 | 3.03e-01 | 0.0667 |
| 53826 | FXYD6 | LZE24T | Human | Esophagus | ESCC | 3.80e-04 | 1.67e-01 | 0.0596 |
| 53826 | FXYD6 | P2T-E | Human | Esophagus | ESCC | 2.06e-43 | 7.41e-01 | 0.1177 |
| 53826 | FXYD6 | P4T-E | Human | Esophagus | ESCC | 2.24e-26 | 6.41e-01 | 0.1323 |
| 53826 | FXYD6 | P9T-E | Human | Esophagus | ESCC | 4.42e-07 | 2.89e-01 | 0.1131 |
| 53826 | FXYD6 | P10T-E | Human | Esophagus | ESCC | 5.70e-48 | 7.50e-01 | 0.116 |
| 53826 | FXYD6 | P12T-E | Human | Esophagus | ESCC | 3.45e-23 | 5.97e-01 | 0.1122 |
| 53826 | FXYD6 | P15T-E | Human | Esophagus | ESCC | 3.45e-04 | 1.26e-01 | 0.1149 |
| 53826 | FXYD6 | P16T-E | Human | Esophagus | ESCC | 2.78e-55 | 8.19e-01 | 0.1153 |
| 53826 | FXYD6 | P22T-E | Human | Esophagus | ESCC | 7.26e-05 | 1.00e-01 | 0.1236 |
| 53826 | FXYD6 | P26T-E | Human | Esophagus | ESCC | 1.74e-76 | 1.45e+00 | 0.1276 |
| 53826 | FXYD6 | P27T-E | Human | Esophagus | ESCC | 4.01e-55 | 9.50e-01 | 0.1055 |
| 53826 | FXYD6 | P28T-E | Human | Esophagus | ESCC | 1.71e-02 | 1.04e-01 | 0.1149 |
| 53826 | FXYD6 | P30T-E | Human | Esophagus | ESCC | 6.14e-13 | 5.27e-01 | 0.137 |
| 53826 | FXYD6 | P31T-E | Human | Esophagus | ESCC | 1.89e-33 | 6.02e-01 | 0.1251 |
| 53826 | FXYD6 | P40T-E | Human | Esophagus | ESCC | 3.48e-07 | 2.48e-01 | 0.109 |
| 53826 | FXYD6 | P42T-E | Human | Esophagus | ESCC | 4.11e-04 | 2.65e-01 | 0.1175 |
| 53826 | FXYD6 | P47T-E | Human | Esophagus | ESCC | 7.02e-05 | 1.34e-01 | 0.1067 |
| 53826 | FXYD6 | P48T-E | Human | Esophagus | ESCC | 3.41e-05 | 1.39e-01 | 0.0959 |
| Page: 1 2 |
| Tissue | Expression Dynamics | Abbreviation |
| Esophagus |  | ESCC: Esophageal squamous cell carcinoma |
| HGIN: High-grade intraepithelial neoplasias | ||
| LGIN: Low-grade intraepithelial neoplasias | ||
| Oral Cavity | 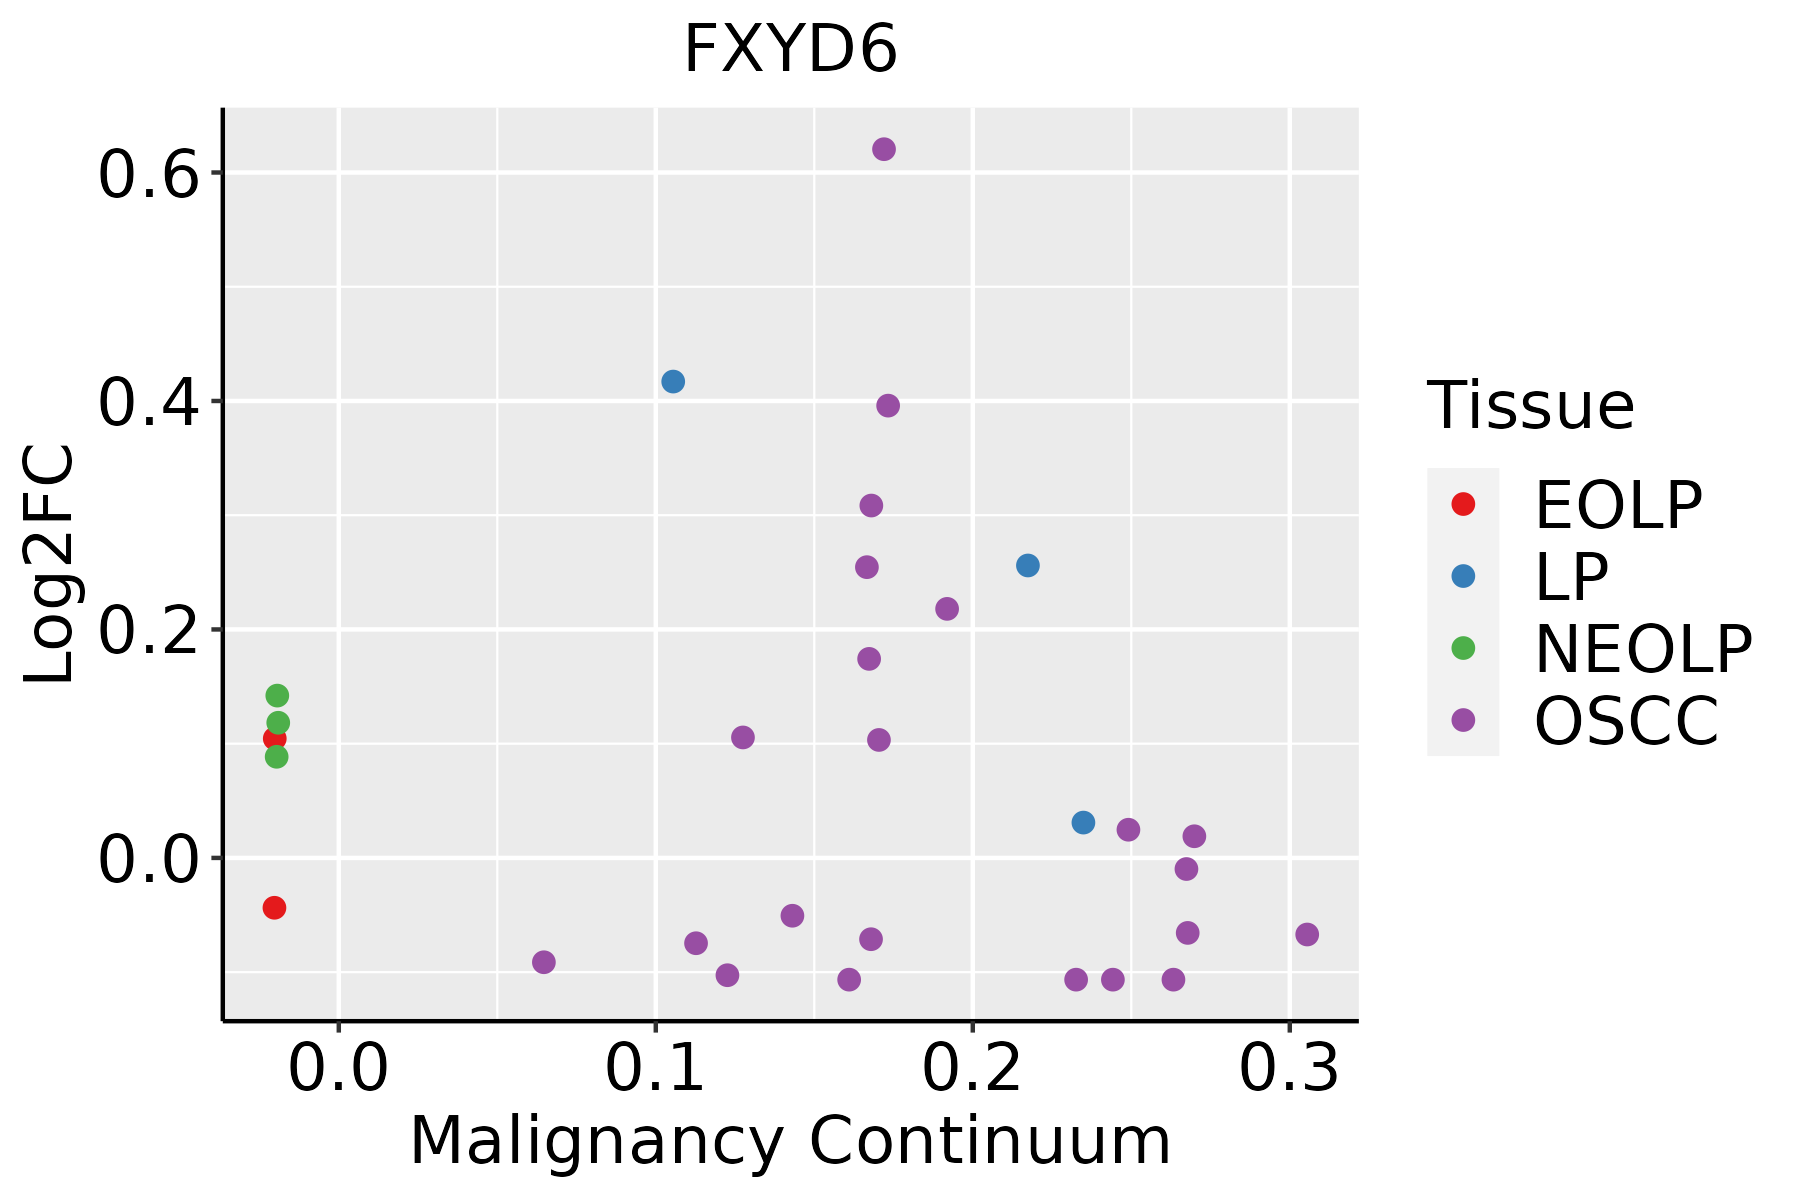 | EOLP: Erosive Oral lichen planus |
| LP: leukoplakia | ||
| NEOLP: Non-erosive oral lichen planus | ||
| OSCC: Oral squamous cell carcinoma |
| ∗log2FC in expression of this searched gene in stem-like cells from each diseased tissue sample relative to stem-like cells in normal samples in each tissue plotted against the malignancy continuum. Samples are colored based on if they are from different disease stage. |
Top |
Malignant transformation related pathway analysis |
| Find out the enriched GO biological processes and KEGG pathways involved in transition from healthy to precancer to cancer |
| Tissue | Disease Stage | Enriched GO biological Processes |
| Colorectum | AD |  |
| Colorectum | SER |  |
| Colorectum | MSS |  |
| Colorectum | MSI-H |  |
| Colorectum | FAP |  |
| ∗Top 15 enriched GO BP terms are showed in the bar plot of each disease state in each tissue. Each row represents a significant GO biological process which is colored according to the -log10(p.adjust). |
| Page: 1 2 3 4 5 6 7 8 9 |
| GO ID | Tissue | Disease Stage | Description | Gene Ratio | Bg Ratio | pvalue | p.adjust | Count |
| GO:190230517 | Oral cavity | NEOLP | regulation of sodium ion transmembrane transport | 16/2005 | 68/18723 | 1.84e-03 | 1.26e-02 | 16 |
| GO:000202813 | Oral cavity | NEOLP | regulation of sodium ion transport | 18/2005 | 90/18723 | 6.48e-03 | 3.33e-02 | 18 |
| GO:20006499 | Oral cavity | NEOLP | regulation of sodium ion transmembrane transporter activity | 13/2005 | 58/18723 | 7.35e-03 | 3.71e-02 | 13 |
| GO:00109598 | Oral cavity | NEOLP | regulation of metal ion transport | 59/2005 | 406/18723 | 9.36e-03 | 4.44e-02 | 59 |
| Page: 1 |
| Pathway ID | Tissue | Disease Stage | Description | Gene Ratio | Bg Ratio | pvalue | p.adjust | qvalue | Count |
| Page: 1 |
Top |
Cell-cell communication analysis |
| Identification of potential cell-cell interactions between two cell types and their ligand-receptor pairs for different disease states |
| Ligand | Receptor | LRpair | Pathway | Tissue | Disease Stage |
| Page: 1 |
Top |
Single-cell gene regulatory network inference analysis |
| Find out the significant the regulons (TFs) and the target genes of each regulon across cell types for different disease states |
| TF | Cell Type | Tissue | Disease Stage | Target Gene | RSS | Regulon Activity |
| ∗The dot plots of a searched regulon are shown for all cell subpopulations in each disease state of each tissue based on the regulon specific score inferred using pySCENIC and by calculating the average expression. |
| Page: 1 |
Top |
Somatic mutation of malignant transformation related genes |
| Annotation of somatic variants for genes involved in malignant transformation |
| Hugo Symbol | Variant Class | Variant Classification | dbSNP RS | HGVSc | HGVSp | HGVSp Short | SWISSPROT | BIOTYPE | SIFT | PolyPhen | Tumor Sample Barcode | Tissue | Histology | Sex | Age | Stage | Therapy Types | Drugs | Outcome |
| FXYD6 | SNV | Missense_Mutation | novel | c.265N>C | p.Glu89Gln | p.E89Q | Q9H0Q3 | protein_coding | tolerated(0.3) | benign(0.003) | TCGA-JW-A5VL-01 | Cervix | cervical & endocervical cancer | Female | <65 | I/II | Unknown | Unknown | SD |
| FXYD6 | SNV | Missense_Mutation | c.282G>T | p.Glu94Asp | p.E94D | Q9H0Q3 | protein_coding | deleterious(0.01) | benign(0.039) | TCGA-AA-3977-01 | Colorectum | colon adenocarcinoma | Male | >=65 | I/II | Unknown | Unknown | SD | |
| FXYD6 | SNV | Missense_Mutation | rs765357596 | c.176N>A | p.Arg59His | p.R59H | Q9H0Q3 | protein_coding | tolerated(0.08) | benign(0.007) | TCGA-A5-A0G2-01 | Endometrium | uterine corpus endometrioid carcinoma | Female | <65 | III/IV | Unknown | Unknown | SD |
| FXYD6 | SNV | Missense_Mutation | c.82N>A | p.Asp28Asn | p.D28N | Q9H0Q3 | protein_coding | tolerated(0.12) | possibly_damaging(0.906) | TCGA-AP-A056-01 | Endometrium | uterine corpus endometrioid carcinoma | Female | <65 | I/II | Unknown | Unknown | SD | |
| FXYD6 | SNV | Missense_Mutation | c.69G>T | p.Lys23Asn | p.K23N | Q9H0Q3 | protein_coding | tolerated(0.13) | benign(0.11) | TCGA-B5-A0JY-01 | Endometrium | uterine corpus endometrioid carcinoma | Female | <65 | III/IV | Chemotherapy | doxorubicin | SD | |
| FXYD6 | SNV | Missense_Mutation | rs765357596 | c.176N>A | p.Arg59His | p.R59H | Q9H0Q3 | protein_coding | tolerated(0.08) | benign(0.007) | TCGA-B5-A3FC-01 | Endometrium | uterine corpus endometrioid carcinoma | Female | <65 | I/II | Unknown | Unknown | SD |
| FXYD6 | SNV | Missense_Mutation | novel | c.114N>T | p.Arg38Ser | p.R38S | Q9H0Q3 | protein_coding | deleterious(0.02) | benign(0.156) | TCGA-DF-A2KU-01 | Endometrium | uterine corpus endometrioid carcinoma | Female | Unknown | I/II | Unknown | Unknown | SD |
| FXYD6 | SNV | Missense_Mutation | novel | c.122N>A | p.Gly41Glu | p.G41E | Q9H0Q3 | protein_coding | deleterious(0) | probably_damaging(0.949) | TCGA-DI-A1BU-01 | Endometrium | uterine corpus endometrioid carcinoma | Female | <65 | I/II | Chemotherapy | paclitaxel | SD |
| FXYD6 | SNV | Missense_Mutation | c.282N>T | p.Glu94Asp | p.E94D | Q9H0Q3 | protein_coding | deleterious(0.01) | benign(0.039) | TCGA-EO-A3B0-01 | Endometrium | uterine corpus endometrioid carcinoma | Female | <65 | III/IV | Unknown | Unknown | SD | |
| FXYD6 | SNV | Missense_Mutation | novel | c.201N>T | p.Gln67His | p.Q67H | Q9H0Q3 | protein_coding | deleterious(0.01) | benign(0.017) | TCGA-EO-A3B0-01 | Endometrium | uterine corpus endometrioid carcinoma | Female | <65 | III/IV | Unknown | Unknown | SD |
| Page: 1 2 |
Top |
Related drugs of malignant transformation related genes |
| Identification of chemicals and drugs interact with genes involved in malignant transfromation |
| (DGIdb 4.0) |
| Entrez ID | Symbol | Category | Interaction Types | Drug Claim Name | Drug Name | PMIDs |
| Page: 1 |

Copyright 2023-Present -The University of Texas Health Science Center at Houston |