
|
|||||
|
 | |
| |
| |
| |
| |
| |
|
Gene: FXYD2 |
Gene summary for FXYD2 |
| Gene information | Species | Human | Gene symbol | FXYD2 | Gene ID | 486 |
| Gene name | FXYD domain containing ion transport regulator 2 | |
| Gene Alias | ATP1G1 | |
| Cytomap | 11q23.3 | |
| Gene Type | protein-coding | GO ID | GO:0002028 | UniProtAcc | P54710 |
Top |
Malignant transformation analysis |
| Identification of the aberrant gene expression in precancerous and cancerous lesions by comparing the gene expression of stem-like cells in diseased tissues with normal stem cells |
| Entrez ID | Symbol | Replicates | Species | Organ | Tissue | Adj P-value | Log2FC | Malignancy |
| 486 | FXYD2 | NAFLD1 | Human | Liver | NAFLD | 4.64e-05 | -1.62e+00 | -0.04 |
| 486 | FXYD2 | S41 | Human | Liver | Cirrhotic | 8.81e-11 | -1.37e+00 | -0.0343 |
| 486 | FXYD2 | S42 | Human | Liver | HCC | 2.26e-10 | -1.62e+00 | -0.0103 |
| 486 | FXYD2 | S43 | Human | Liver | Cirrhotic | 2.55e-48 | -1.37e+00 | -0.0187 |
| 486 | FXYD2 | S44 | Human | Liver | HCC | 1.20e-08 | -1.62e+00 | -0.0083 |
| 486 | FXYD2 | HCC1_Meng | Human | Liver | HCC | 3.81e-140 | -6.18e-01 | 0.0246 |
| 486 | FXYD2 | HCC2_Meng | Human | Liver | HCC | 5.52e-66 | -1.56e+00 | 0.0107 |
| 486 | FXYD2 | cirrhotic1 | Human | Liver | Cirrhotic | 1.10e-24 | 2.58e-01 | 0.0202 |
| 486 | FXYD2 | cirrhotic2 | Human | Liver | Cirrhotic | 1.17e-43 | 2.15e-01 | 0.0201 |
| 486 | FXYD2 | cirrhotic3 | Human | Liver | Cirrhotic | 3.11e-02 | -1.81e-01 | 0.0215 |
| 486 | FXYD2 | p6 | Human | Liver | Cyst | 1.40e-16 | -1.62e+00 | -0.0218 |
| 486 | FXYD2 | HCC1 | Human | Liver | HCC | 3.90e-21 | -1.62e+00 | 0.5336 |
| 486 | FXYD2 | HCC5 | Human | Liver | HCC | 9.67e-38 | -1.62e+00 | 0.4932 |
| 486 | FXYD2 | Pt13.a | Human | Liver | HCC | 3.84e-68 | -1.59e+00 | 0.021 |
| 486 | FXYD2 | Pt13.b | Human | Liver | HCC | 2.37e-72 | -1.48e+00 | 0.0251 |
| 486 | FXYD2 | Pt13.c | Human | Liver | HCC | 2.15e-36 | -1.53e+00 | 0.0076 |
| 486 | FXYD2 | Pt14.a | Human | Liver | HCC | 6.59e-09 | -1.33e+00 | 0.0169 |
| 486 | FXYD2 | Pt14.b | Human | Liver | HCC | 6.83e-17 | -1.62e+00 | 0.018 |
| 486 | FXYD2 | Pt14.c | Human | Liver | HCC | 1.20e-19 | -1.62e+00 | 0.0054 |
| 486 | FXYD2 | Pt14.d | Human | Liver | HCC | 1.34e-64 | -1.58e+00 | 0.0143 |
| Page: 1 2 |
| Tissue | Expression Dynamics | Abbreviation |
| Liver | 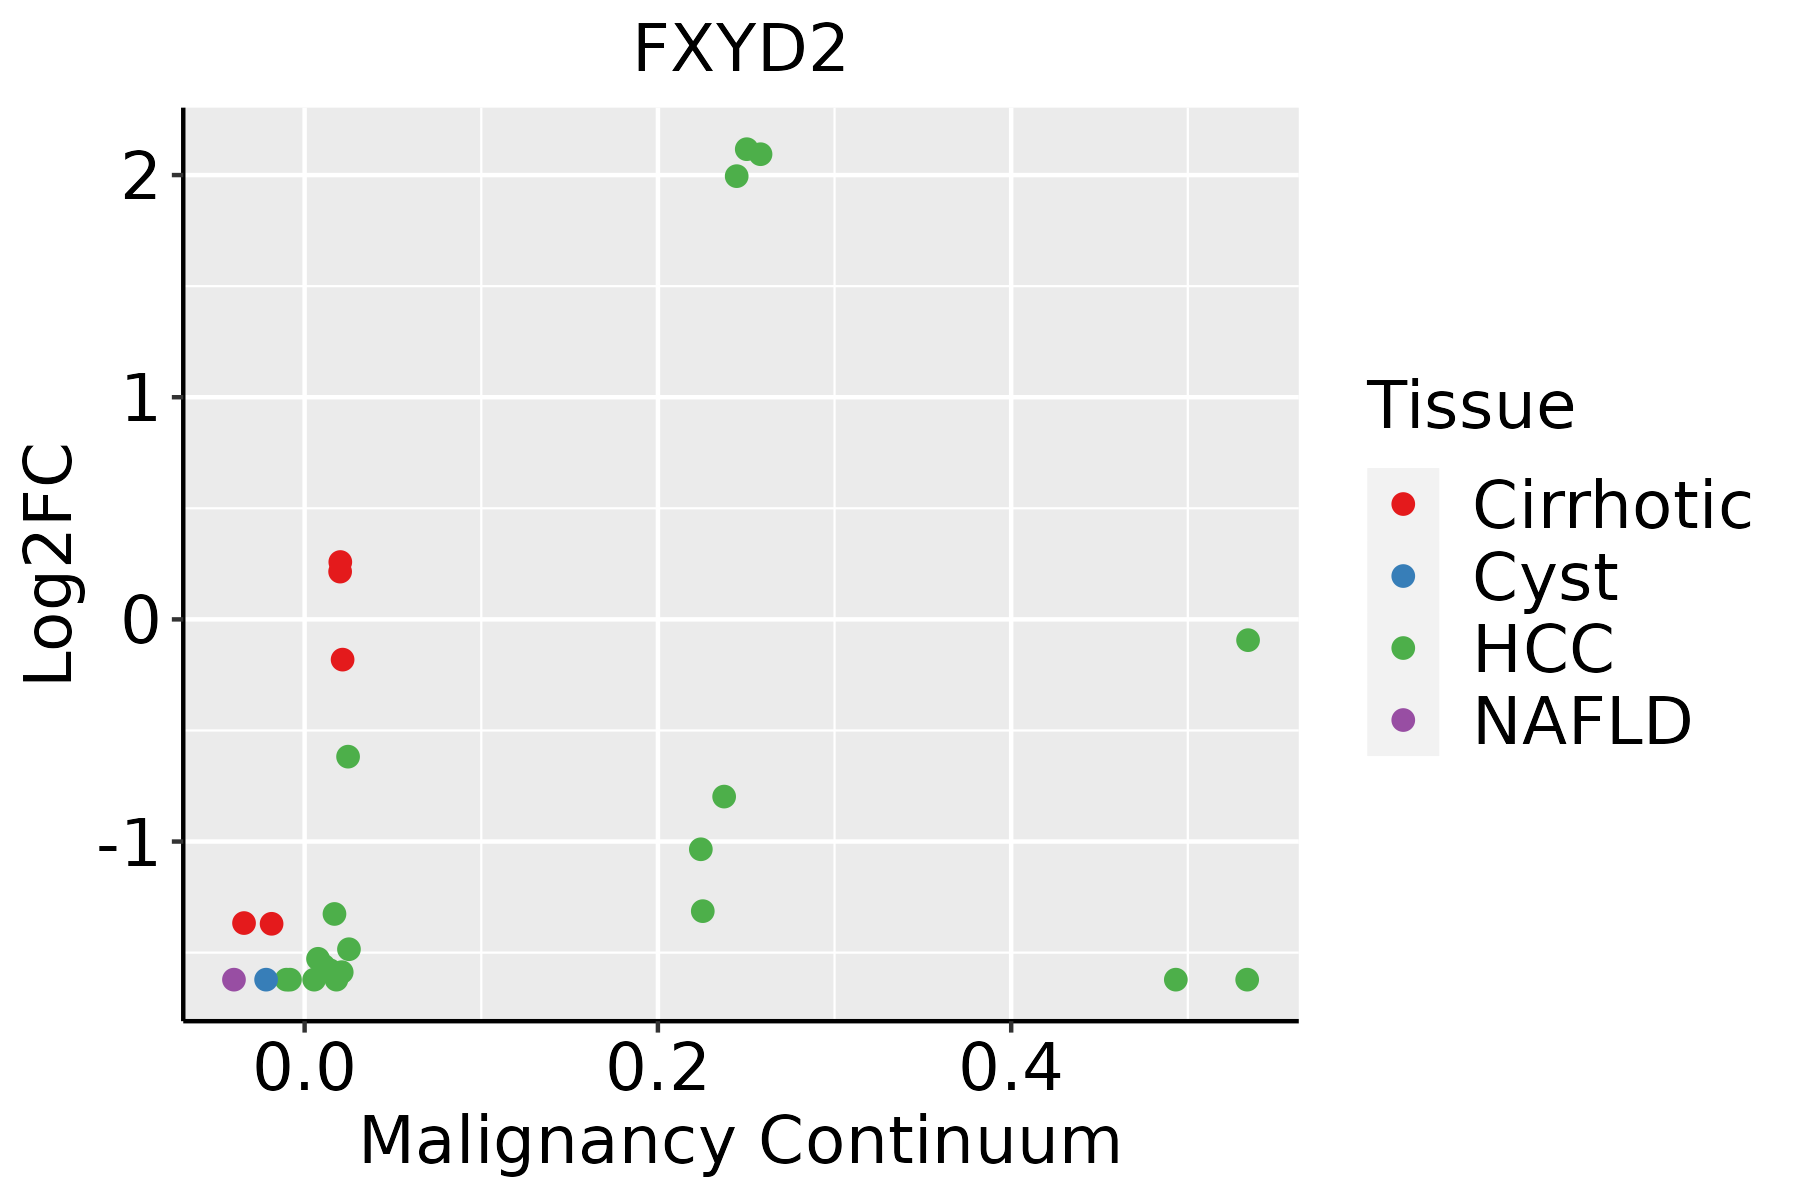 | HCC: Hepatocellular carcinoma |
| NAFLD: Non-alcoholic fatty liver disease | ||
| Oral Cavity | 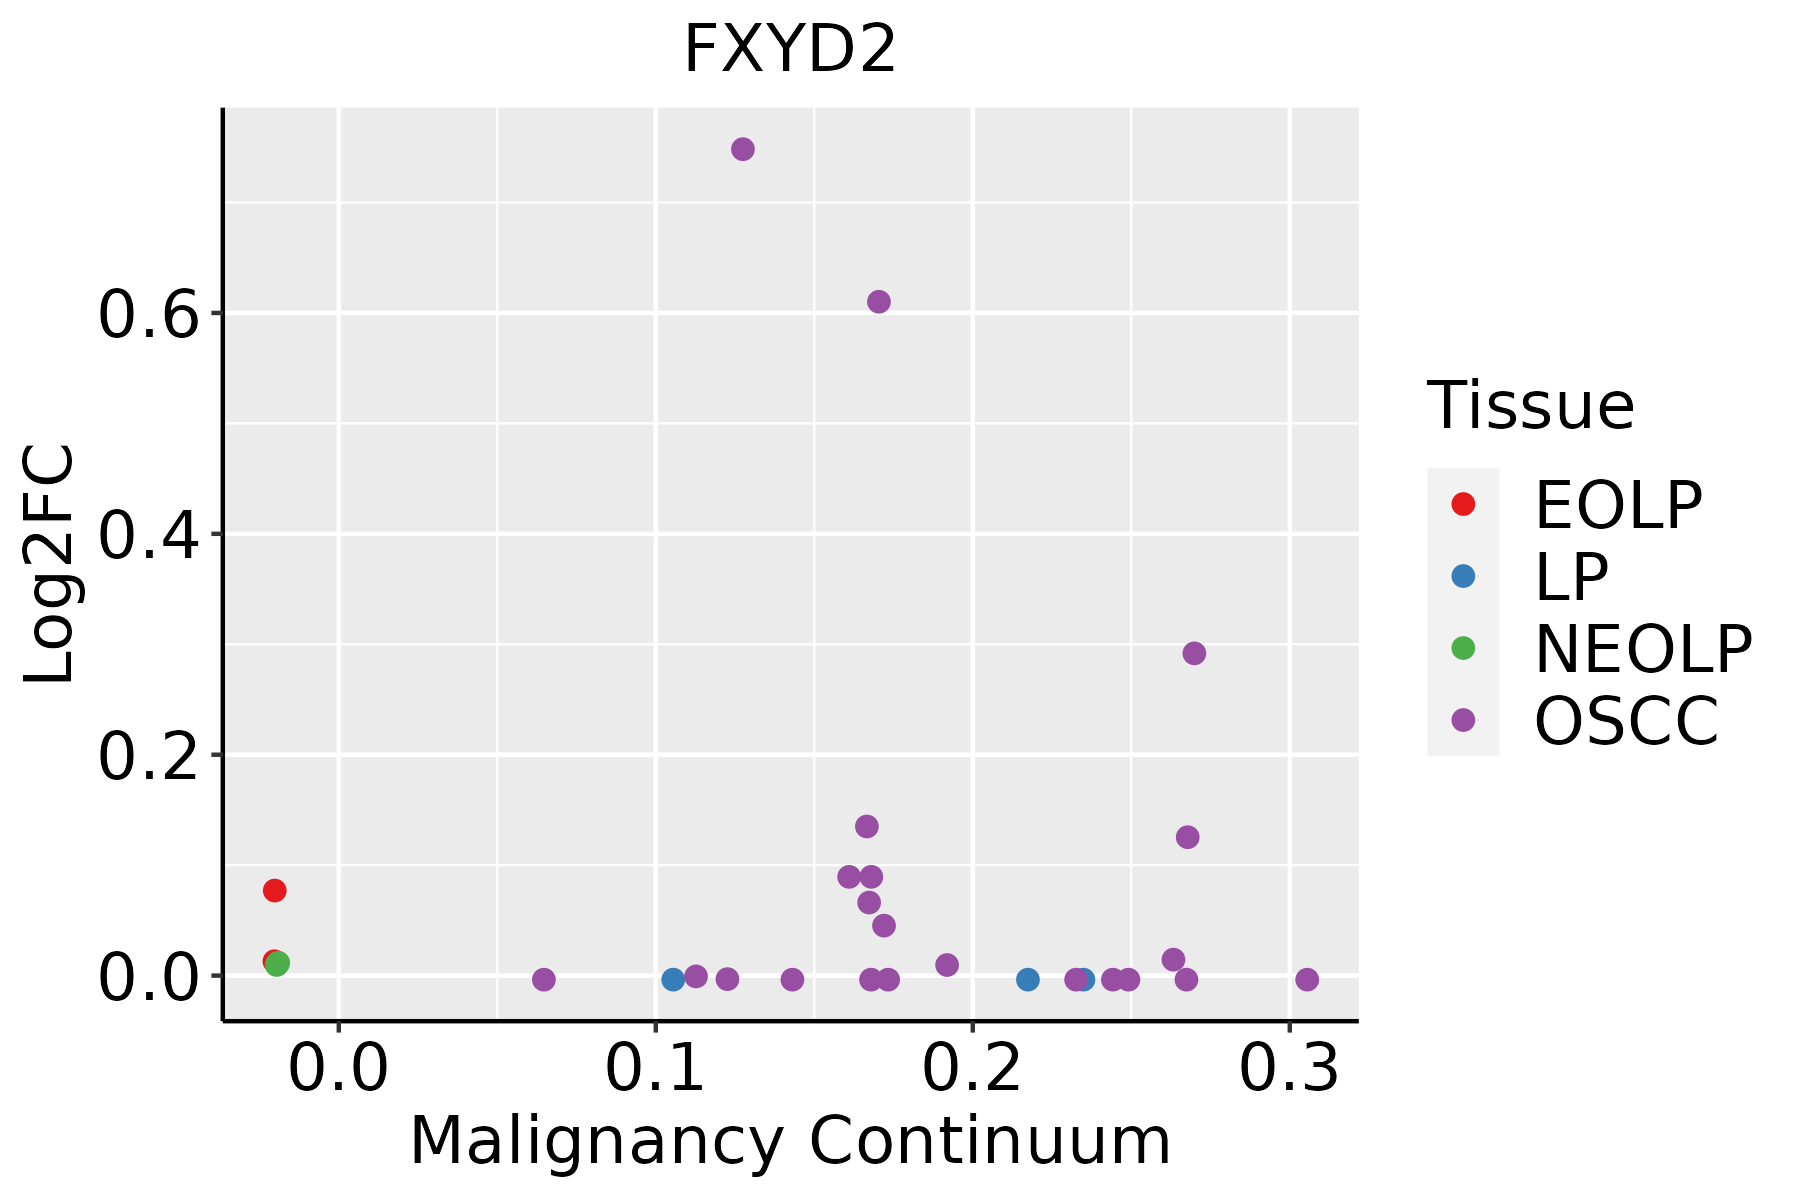 | EOLP: Erosive Oral lichen planus |
| LP: leukoplakia | ||
| NEOLP: Non-erosive oral lichen planus | ||
| OSCC: Oral squamous cell carcinoma |
| ∗log2FC in expression of this searched gene in stem-like cells from each diseased tissue sample relative to stem-like cells in normal samples in each tissue plotted against the malignancy continuum. Samples are colored based on if they are from different disease stage. |
Top |
Malignant transformation related pathway analysis |
| Find out the enriched GO biological processes and KEGG pathways involved in transition from healthy to precancer to cancer |
| Tissue | Disease Stage | Enriched GO biological Processes |
| Colorectum | AD |  |
| Colorectum | SER |  |
| Colorectum | MSS |  |
| Colorectum | MSI-H |  |
| Colorectum | FAP |  |
| ∗Top 15 enriched GO BP terms are showed in the bar plot of each disease state in each tissue. Each row represents a significant GO biological process which is colored according to the -log10(p.adjust). |
| Page: 1 2 3 4 5 6 7 8 9 |
| GO ID | Tissue | Disease Stage | Description | Gene Ratio | Bg Ratio | pvalue | p.adjust | Count |
| GO:00020286 | Liver | NAFLD | regulation of sodium ion transport | 18/1882 | 90/18723 | 3.34e-03 | 2.93e-02 | 18 |
| GO:00347643 | Liver | NAFLD | positive regulation of transmembrane transport | 35/1882 | 219/18723 | 3.92e-03 | 3.32e-02 | 35 |
| GO:19023057 | Liver | NAFLD | regulation of sodium ion transmembrane transport | 14/1882 | 68/18723 | 6.95e-03 | 4.88e-02 | 14 |
| GO:20006516 | Liver | Cirrhotic | positive regulation of sodium ion transmembrane transporter activity | 10/4634 | 16/18723 | 1.51e-03 | 9.91e-03 | 10 |
| GO:19023076 | Liver | Cirrhotic | positive regulation of sodium ion transmembrane transport | 12/4634 | 21/18723 | 1.53e-03 | 9.98e-03 | 12 |
| GO:00107656 | Liver | Cirrhotic | positive regulation of sodium ion transport | 17/4634 | 35/18723 | 1.93e-03 | 1.21e-02 | 17 |
| GO:00324142 | Liver | Cyst | positive regulation of ion transmembrane transporter activity | 12/496 | 109/18723 | 3.19e-05 | 1.84e-03 | 12 |
| GO:00347672 | Liver | Cyst | positive regulation of ion transmembrane transport | 15/496 | 167/18723 | 3.95e-05 | 2.19e-03 | 15 |
| GO:003476411 | Liver | Cyst | positive regulation of transmembrane transport | 17/496 | 219/18723 | 7.88e-05 | 3.78e-03 | 17 |
| GO:00324115 | Liver | Cyst | positive regulation of transporter activity | 12/496 | 120/18723 | 8.26e-05 | 3.92e-03 | 12 |
| GO:190230711 | Liver | Cyst | positive regulation of sodium ion transmembrane transport | 5/496 | 21/18723 | 1.83e-04 | 7.05e-03 | 5 |
| GO:200065111 | Liver | Cyst | positive regulation of sodium ion transmembrane transporter activity | 4/496 | 16/18723 | 6.87e-04 | 1.88e-02 | 4 |
| GO:00432702 | Liver | Cyst | positive regulation of ion transport | 17/496 | 275/18723 | 1.12e-03 | 2.86e-02 | 17 |
| GO:00228983 | Liver | Cyst | regulation of transmembrane transporter activity | 17/496 | 278/18723 | 1.26e-03 | 3.10e-02 | 17 |
| GO:00324094 | Liver | Cyst | regulation of transporter activity | 18/496 | 310/18723 | 1.64e-03 | 3.78e-02 | 18 |
| GO:00324123 | Liver | Cyst | regulation of ion transmembrane transporter activity | 16/496 | 267/18723 | 2.12e-03 | 4.38e-02 | 16 |
| GO:001076511 | Liver | Cyst | positive regulation of sodium ion transport | 5/496 | 35/18723 | 2.15e-03 | 4.38e-02 | 5 |
| GO:1904064 | Liver | Cyst | positive regulation of cation transmembrane transport | 11/496 | 151/18723 | 2.32e-03 | 4.60e-02 | 11 |
| GO:19023079 | Oral cavity | OSCC | positive regulation of sodium ion transmembrane transport | 14/7305 | 21/18723 | 9.54e-03 | 3.39e-02 | 14 |
| GO:20006519 | Oral cavity | OSCC | positive regulation of sodium ion transmembrane transporter activity | 11/7305 | 16/18723 | 1.56e-02 | 4.99e-02 | 11 |
| Page: 1 |
| Pathway ID | Tissue | Disease Stage | Description | Gene Ratio | Bg Ratio | pvalue | p.adjust | qvalue | Count |
| hsa049762 | Liver | NAFLD | Bile secretion | 20/1043 | 89/8465 | 5.08e-03 | 4.43e-02 | 3.57e-02 | 20 |
| hsa0497611 | Liver | NAFLD | Bile secretion | 20/1043 | 89/8465 | 5.08e-03 | 4.43e-02 | 3.57e-02 | 20 |
| hsa0491912 | Liver | HCC | Thyroid hormone signaling pathway | 75/4020 | 121/8465 | 8.76e-04 | 3.38e-03 | 1.88e-03 | 75 |
| hsa0491913 | Liver | HCC | Thyroid hormone signaling pathway | 75/4020 | 121/8465 | 8.76e-04 | 3.38e-03 | 1.88e-03 | 75 |
| hsa0426014 | Liver | Cyst | Cardiac muscle contraction | 16/339 | 87/8465 | 2.73e-07 | 5.24e-06 | 4.33e-06 | 16 |
| hsa0497810 | Liver | Cyst | Mineral absorption | 8/339 | 60/8465 | 2.53e-03 | 2.08e-02 | 1.72e-02 | 8 |
| hsa0426015 | Liver | Cyst | Cardiac muscle contraction | 16/339 | 87/8465 | 2.73e-07 | 5.24e-06 | 4.33e-06 | 16 |
| hsa0497811 | Liver | Cyst | Mineral absorption | 8/339 | 60/8465 | 2.53e-03 | 2.08e-02 | 1.72e-02 | 8 |
| hsa0491926 | Oral cavity | OSCC | Thyroid hormone signaling pathway | 73/3704 | 121/8465 | 1.63e-04 | 5.52e-04 | 2.81e-04 | 73 |
| hsa04919112 | Oral cavity | OSCC | Thyroid hormone signaling pathway | 73/3704 | 121/8465 | 1.63e-04 | 5.52e-04 | 2.81e-04 | 73 |
| Page: 1 |
Top |
Cell-cell communication analysis |
| Identification of potential cell-cell interactions between two cell types and their ligand-receptor pairs for different disease states |
| Ligand | Receptor | LRpair | Pathway | Tissue | Disease Stage |
| Page: 1 |
Top |
Single-cell gene regulatory network inference analysis |
| Find out the significant the regulons (TFs) and the target genes of each regulon across cell types for different disease states |
| TF | Cell Type | Tissue | Disease Stage | Target Gene | RSS | Regulon Activity |
| ∗The dot plots of a searched regulon are shown for all cell subpopulations in each disease state of each tissue based on the regulon specific score inferred using pySCENIC and by calculating the average expression. |
| Page: 1 |
Top |
Somatic mutation of malignant transformation related genes |
| Annotation of somatic variants for genes involved in malignant transformation |
| Hugo Symbol | Variant Class | Variant Classification | dbSNP RS | HGVSc | HGVSp | HGVSp Short | SWISSPROT | BIOTYPE | SIFT | PolyPhen | Tumor Sample Barcode | Tissue | Histology | Sex | Age | Stage | Therapy Types | Drugs | Outcome |
| FXYD2 | SNV | Missense_Mutation | rs761860028 | c.173N>A | p.Arg58His | p.R58H | P54710 | protein_coding | tolerated(0.28) | benign(0.003) | TCGA-A5-A0G2-01 | Endometrium | uterine corpus endometrioid carcinoma | Female | <65 | III/IV | Unknown | Unknown | SD |
| Page: 1 |
Top |
Related drugs of malignant transformation related genes |
| Identification of chemicals and drugs interact with genes involved in malignant transfromation |
| (DGIdb 4.0) |
| Entrez ID | Symbol | Category | Interaction Types | Drug Claim Name | Drug Name | PMIDs |
| 486 | FXYD2 | DRUGGABLE GENOME, TRANSPORTER | inhibitor | CHEMBL1751 | DIGOXIN | |
| 486 | FXYD2 | DRUGGABLE GENOME, TRANSPORTER | inhibitor | CHEMBL3545057 | ACETYLDIGITOXIN | |
| 486 | FXYD2 | DRUGGABLE GENOME, TRANSPORTER | inhibitor | CHEMBL254219 | DIGITOXIN | |
| 486 | FXYD2 | DRUGGABLE GENOME, TRANSPORTER | inhibitor | CHEMBL1614 | DESLANOSIDE | |
| 486 | FXYD2 | DRUGGABLE GENOME, TRANSPORTER | CYCLOTHIAZIDE | CYCLOTHIAZIDE | ||
| 486 | FXYD2 | DRUGGABLE GENOME, TRANSPORTER | CYCLOTHIAZIDE | CYCLOTHIAZIDE |
| Page: 1 |

Copyright 2023-Present -The University of Texas Health Science Center at Houston |