
|
|||||
|
 | |
| |
| |
| |
| |
| |
|
Gene: FXYD1 |
Gene summary for FXYD1 |
| Gene information | Species | Human | Gene symbol | FXYD1 | Gene ID | 5348 |
| Gene name | FXYD domain containing ion transport regulator 1 | |
| Gene Alias | PLM | |
| Cytomap | 19q13.12 | |
| Gene Type | protein-coding | GO ID | GO:0002028 | UniProtAcc | O00168 |
Top |
Malignant transformation analysis |
| Identification of the aberrant gene expression in precancerous and cancerous lesions by comparing the gene expression of stem-like cells in diseased tissues with normal stem cells |
| Entrez ID | Symbol | Replicates | Species | Organ | Tissue | Adj P-value | Log2FC | Malignancy |
| 5348 | FXYD1 | LZE22T | Human | Esophagus | ESCC | 1.57e-02 | 1.93e-01 | 0.068 |
| 5348 | FXYD1 | P8T-E | Human | Esophagus | ESCC | 4.41e-07 | 4.37e-01 | 0.0889 |
| 5348 | FXYD1 | P9T-E | Human | Esophagus | ESCC | 1.60e-17 | 6.36e-01 | 0.1131 |
| 5348 | FXYD1 | P11T-E | Human | Esophagus | ESCC | 2.94e-14 | 8.93e-01 | 0.1426 |
| 5348 | FXYD1 | P19T-E | Human | Esophagus | ESCC | 1.65e-10 | 1.48e+00 | 0.1662 |
| 5348 | FXYD1 | P20T-E | Human | Esophagus | ESCC | 3.20e-07 | 5.08e-01 | 0.1124 |
| 5348 | FXYD1 | P22T-E | Human | Esophagus | ESCC | 9.20e-06 | 1.65e-01 | 0.1236 |
| 5348 | FXYD1 | P44T-E | Human | Esophagus | ESCC | 1.67e-06 | 3.58e-01 | 0.1096 |
| 5348 | FXYD1 | P49T-E | Human | Esophagus | ESCC | 7.48e-03 | 4.63e-01 | 0.1768 |
| 5348 | FXYD1 | P61T-E | Human | Esophagus | ESCC | 5.99e-03 | 2.91e-01 | 0.099 |
| 5348 | FXYD1 | P74T-E | Human | Esophagus | ESCC | 2.07e-18 | 5.00e-01 | 0.1479 |
| 5348 | FXYD1 | P79T-E | Human | Esophagus | ESCC | 1.35e-23 | 4.24e-01 | 0.1154 |
| 5348 | FXYD1 | P130T-E | Human | Esophagus | ESCC | 2.02e-06 | 2.11e-01 | 0.1676 |
| 5348 | FXYD1 | C21 | Human | Oral cavity | OSCC | 9.44e-05 | -5.04e-01 | 0.2678 |
| 5348 | FXYD1 | C43 | Human | Oral cavity | OSCC | 1.51e-09 | -4.99e-01 | 0.1704 |
| 5348 | FXYD1 | C46 | Human | Oral cavity | OSCC | 1.83e-07 | -4.82e-01 | 0.1673 |
| 5348 | FXYD1 | C57 | Human | Oral cavity | OSCC | 1.66e-07 | -5.26e-01 | 0.1679 |
| 5348 | FXYD1 | C08 | Human | Oral cavity | OSCC | 8.48e-07 | -4.78e-01 | 0.1919 |
| 5348 | FXYD1 | C09 | Human | Oral cavity | OSCC | 8.04e-05 | -4.55e-01 | 0.1431 |
| 5348 | FXYD1 | EOLP-1 | Human | Oral cavity | EOLP | 2.37e-05 | -3.02e-01 | -0.0202 |
| Page: 1 2 |
| Tissue | Expression Dynamics | Abbreviation |
| Esophagus | 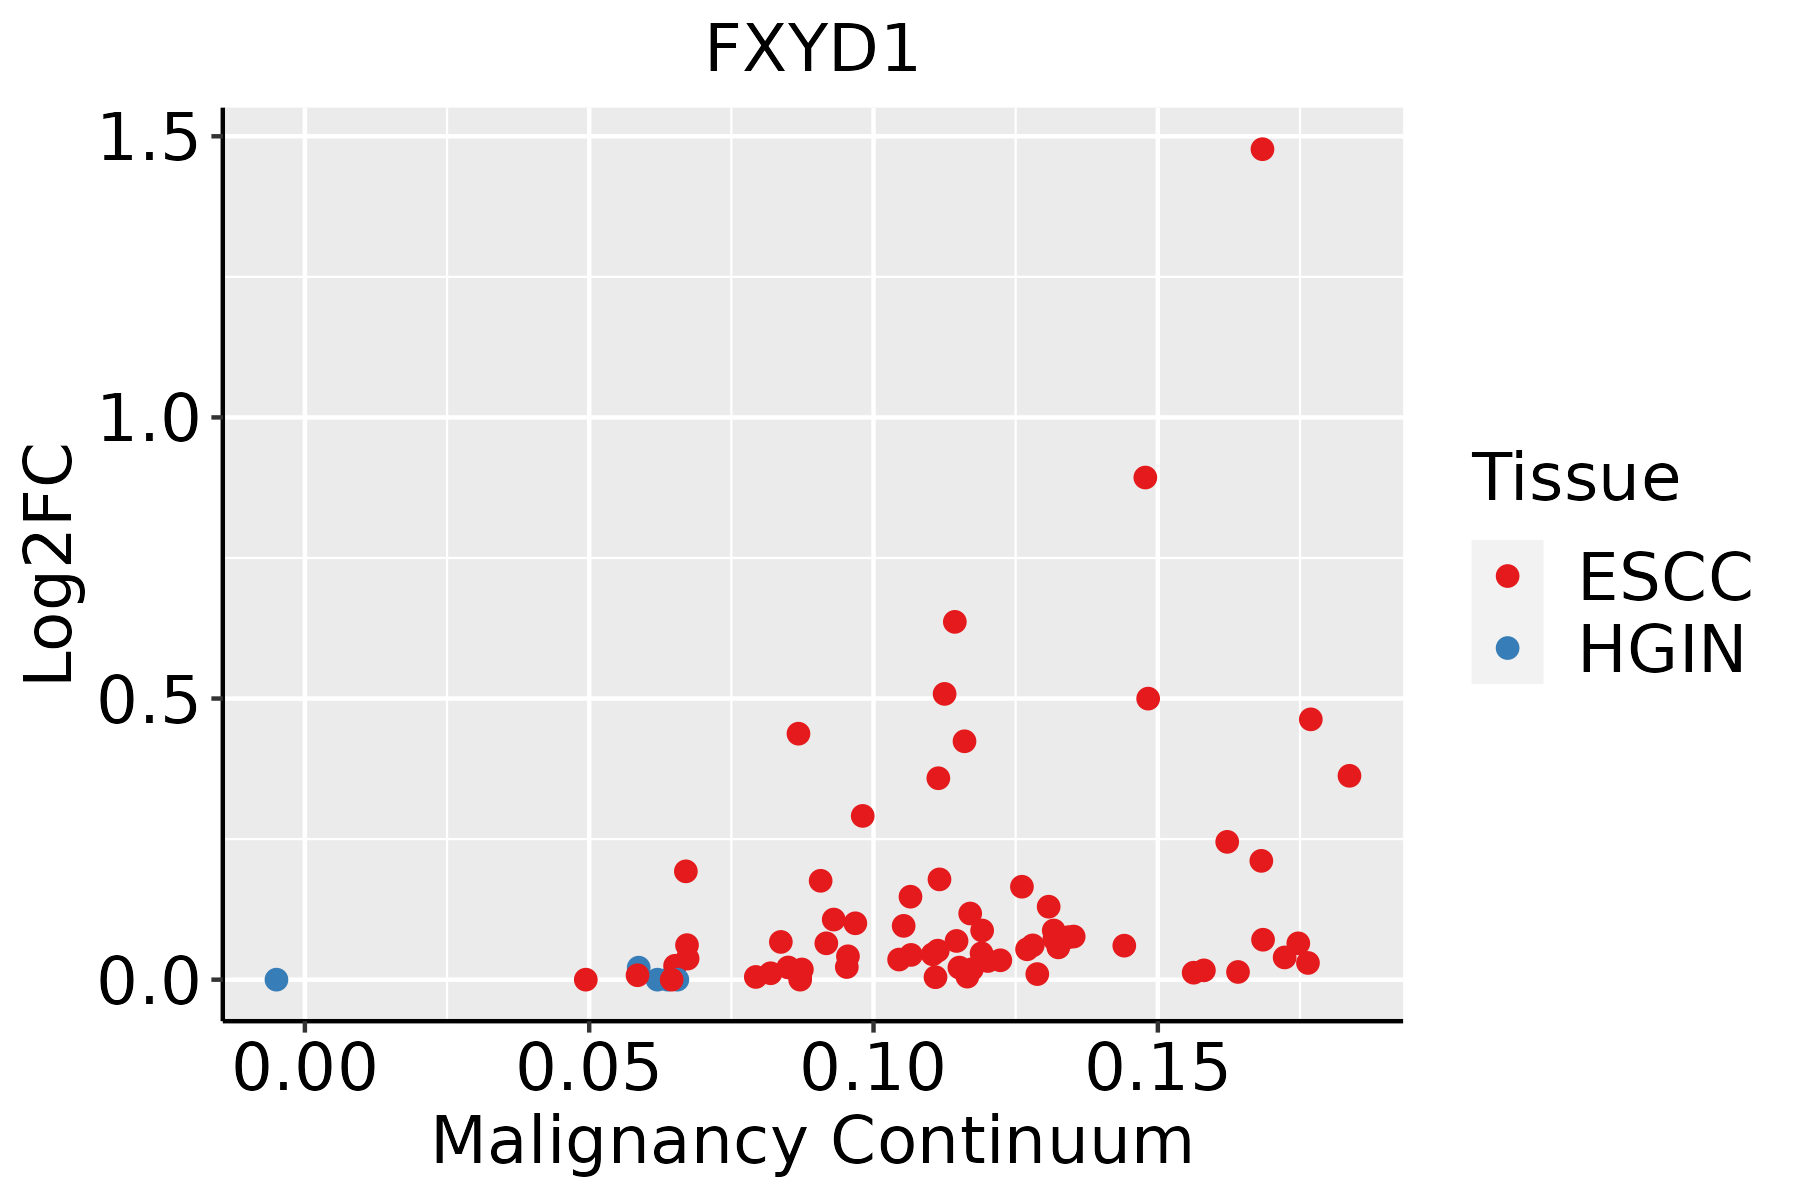 | ESCC: Esophageal squamous cell carcinoma |
| HGIN: High-grade intraepithelial neoplasias | ||
| LGIN: Low-grade intraepithelial neoplasias | ||
| Oral Cavity |  | EOLP: Erosive Oral lichen planus |
| LP: leukoplakia | ||
| NEOLP: Non-erosive oral lichen planus | ||
| OSCC: Oral squamous cell carcinoma | ||
| Thyroid | 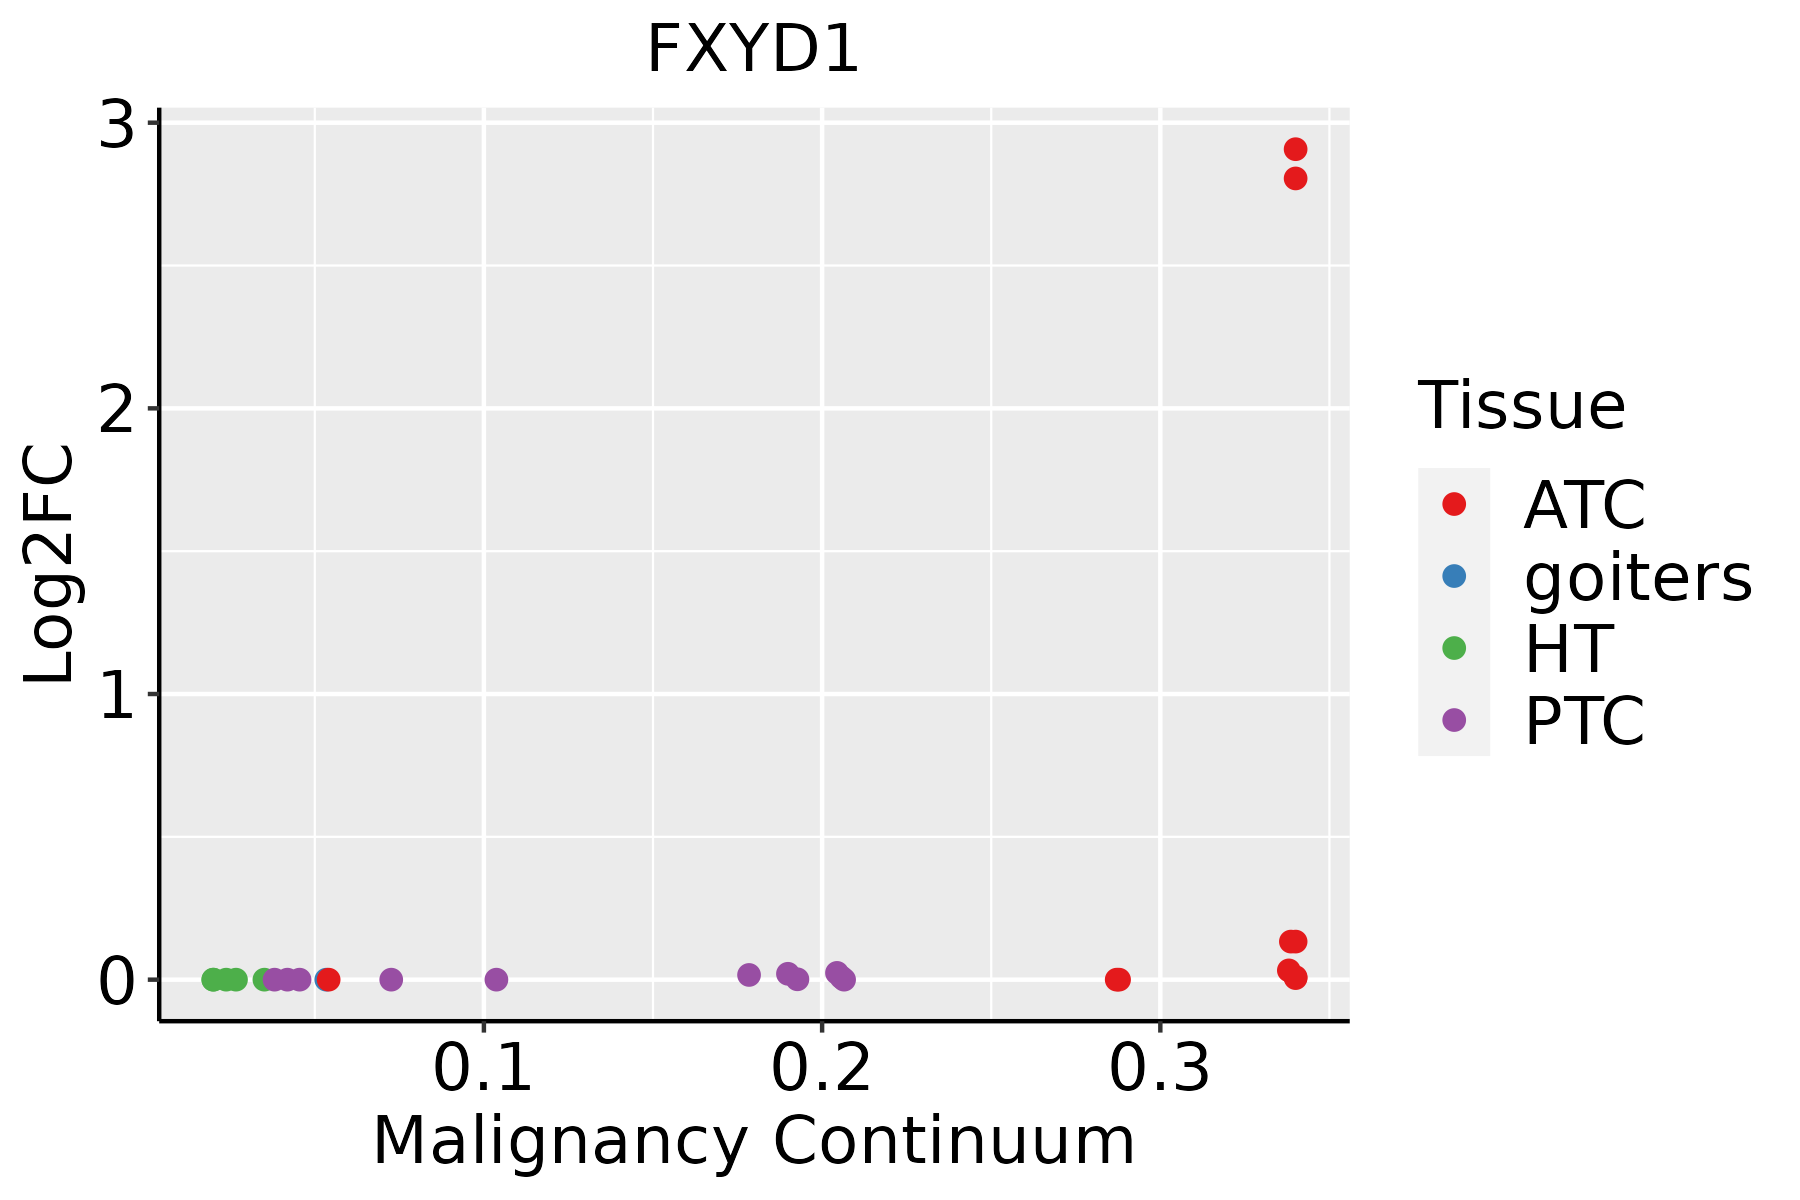 | ATC: Anaplastic thyroid cancer |
| HT: Hashimoto's thyroiditis | ||
| PTC: Papillary thyroid cancer |
| ∗log2FC in expression of this searched gene in stem-like cells from each diseased tissue sample relative to stem-like cells in normal samples in each tissue plotted against the malignancy continuum. Samples are colored based on if they are from different disease stage. |
Top |
Malignant transformation related pathway analysis |
| Find out the enriched GO biological processes and KEGG pathways involved in transition from healthy to precancer to cancer |
| Tissue | Disease Stage | Enriched GO biological Processes |
| Colorectum | AD |  |
| Colorectum | SER |  |
| Colorectum | MSS |  |
| Colorectum | MSI-H |  |
| Colorectum | FAP |  |
| ∗Top 15 enriched GO BP terms are showed in the bar plot of each disease state in each tissue. Each row represents a significant GO biological process which is colored according to the -log10(p.adjust). |
| Page: 1 2 3 4 5 6 7 8 9 |
| GO ID | Tissue | Disease Stage | Description | Gene Ratio | Bg Ratio | pvalue | p.adjust | Count |
| GO:190230710 | Esophagus | ESCC | positive regulation of sodium ion transmembrane transport | 15/8552 | 21/18723 | 1.54e-02 | 4.96e-02 | 15 |
| GO:19023079 | Oral cavity | OSCC | positive regulation of sodium ion transmembrane transport | 14/7305 | 21/18723 | 9.54e-03 | 3.39e-02 | 14 |
| GO:190230516 | Oral cavity | EOLP | regulation of sodium ion transmembrane transport | 17/2218 | 68/18723 | 2.00e-03 | 1.28e-02 | 17 |
| GO:00030128 | Oral cavity | EOLP | muscle system process | 71/2218 | 452/18723 | 7.83e-03 | 3.73e-02 | 71 |
| GO:190230713 | Oral cavity | EOLP | positive regulation of sodium ion transmembrane transport | 7/2218 | 21/18723 | 8.36e-03 | 3.91e-02 | 7 |
| GO:190230517 | Oral cavity | NEOLP | regulation of sodium ion transmembrane transport | 16/2005 | 68/18723 | 1.84e-03 | 1.26e-02 | 16 |
| GO:000202813 | Oral cavity | NEOLP | regulation of sodium ion transport | 18/2005 | 90/18723 | 6.48e-03 | 3.33e-02 | 18 |
| GO:20006499 | Oral cavity | NEOLP | regulation of sodium ion transmembrane transporter activity | 13/2005 | 58/18723 | 7.35e-03 | 3.71e-02 | 13 |
| GO:00109598 | Oral cavity | NEOLP | regulation of metal ion transport | 59/2005 | 406/18723 | 9.36e-03 | 4.44e-02 | 59 |
| GO:190230715 | Thyroid | ATC | positive regulation of sodium ion transmembrane transport | 13/6293 | 21/18723 | 7.34e-03 | 2.87e-02 | 13 |
| Page: 1 |
| Pathway ID | Tissue | Disease Stage | Description | Gene Ratio | Bg Ratio | pvalue | p.adjust | qvalue | Count |
| Page: 1 |
Top |
Cell-cell communication analysis |
| Identification of potential cell-cell interactions between two cell types and their ligand-receptor pairs for different disease states |
| Ligand | Receptor | LRpair | Pathway | Tissue | Disease Stage |
| Page: 1 |
Top |
Single-cell gene regulatory network inference analysis |
| Find out the significant the regulons (TFs) and the target genes of each regulon across cell types for different disease states |
| TF | Cell Type | Tissue | Disease Stage | Target Gene | RSS | Regulon Activity |
| ∗The dot plots of a searched regulon are shown for all cell subpopulations in each disease state of each tissue based on the regulon specific score inferred using pySCENIC and by calculating the average expression. |
| Page: 1 |
Top |
Somatic mutation of malignant transformation related genes |
| Annotation of somatic variants for genes involved in malignant transformation |
| Hugo Symbol | Variant Class | Variant Classification | dbSNP RS | HGVSc | HGVSp | HGVSp Short | SWISSPROT | BIOTYPE | SIFT | PolyPhen | Tumor Sample Barcode | Tissue | Histology | Sex | Age | Stage | Therapy Types | Drugs | Outcome |
| FXYD1 | SNV | Missense_Mutation | novel | c.269N>A | p.Arg90His | p.R90H | O00168 | protein_coding | deleterious(0.01) | probably_damaging(0.98) | TCGA-AA-3845-01 | Colorectum | colon adenocarcinoma | Female | >=65 | I/II | Unknown | Unknown | PD |
| FXYD1 | SNV | Missense_Mutation | novel | c.214N>A | p.Glu72Lys | p.E72K | O00168 | protein_coding | tolerated(0.2) | benign(0.214) | TCGA-EI-6917-01 | Colorectum | rectum adenocarcinoma | Male | <65 | III/IV | Chemotherapy | 5fluorouracil+oxaciplatina+l-folinian | SD |
| FXYD1 | SNV | Missense_Mutation | novel | c.160A>G | p.Ile54Val | p.I54V | O00168 | protein_coding | tolerated(0.06) | probably_damaging(0.981) | TCGA-AJ-A3EK-01 | Endometrium | uterine corpus endometrioid carcinoma | Female | <65 | I/II | Chemotherapy | carboplatin | CR |
| FXYD1 | SNV | Missense_Mutation | novel | c.272G>T | p.Arg91Met | p.R91M | O00168 | protein_coding | tolerated(0.19) | probably_damaging(0.984) | TCGA-AX-A06F-01 | Endometrium | uterine corpus endometrioid carcinoma | Female | <65 | III/IV | Chemotherapy | carboplatin | SD |
| FXYD1 | SNV | Missense_Mutation | novel | c.30N>A | p.Phe10Leu | p.F10L | O00168 | protein_coding | tolerated(0.82) | benign(0) | TCGA-AX-A2IO-01 | Endometrium | uterine corpus endometrioid carcinoma | Female | >=65 | I/II | Chemotherapy | carboplatin | SD |
| FXYD1 | SNV | Missense_Mutation | novel | c.254N>A | p.Arg85His | p.R85H | O00168 | protein_coding | deleterious(0.02) | probably_damaging(0.98) | TCGA-B5-A1MR-01 | Endometrium | uterine corpus endometrioid carcinoma | Female | >=65 | III/IV | Unknown | Unknown | SD |
| FXYD1 | SNV | Missense_Mutation | novel | c.241N>A | p.Arg81Ser | p.R81S | O00168 | protein_coding | deleterious(0.02) | probably_damaging(0.972) | TCGA-53-7626-01 | Lung | lung adenocarcinoma | Female | >=65 | I/II | Unspecific | Cisplatin | PD |
| FXYD1 | SNV | Missense_Mutation | c.16N>A | p.His6Asn | p.H6N | O00168 | protein_coding | deleterious(0.04) | benign(0.011) | TCGA-18-3411-01 | Lung | lung squamous cell carcinoma | Female | <65 | III/IV | Unknown | Unknown | SD | |
| FXYD1 | SNV | Missense_Mutation | c.111N>T | p.Gln37His | p.Q37H | O00168 | protein_coding | deleterious(0) | possibly_damaging(0.503) | TCGA-21-5787-01 | Lung | lung squamous cell carcinoma | Male | >=65 | III/IV | Unknown | Unknown | PD | |
| FXYD1 | SNV | Missense_Mutation | novel | c.253N>A | p.Arg85Ser | p.R85S | O00168 | protein_coding | deleterious(0.04) | probably_damaging(0.972) | TCGA-85-6561-01 | Lung | lung squamous cell carcinoma | Male | >=65 | I/II | Chemotherapy | cisplatin | SD |
| Page: 1 2 |
Top |
Related drugs of malignant transformation related genes |
| Identification of chemicals and drugs interact with genes involved in malignant transfromation |
| (DGIdb 4.0) |
| Entrez ID | Symbol | Category | Interaction Types | Drug Claim Name | Drug Name | PMIDs |
| Page: 1 |

Copyright 2023-Present -The University of Texas Health Science Center at Houston |