
|
|||||
|
 | |
| |
| |
| |
| |
| |
|
Gene: FUT9 |
Gene summary for FUT9 |
| Gene information | Species | Human | Gene symbol | FUT9 | Gene ID | 10690 |
| Gene name | fucosyltransferase 9 | |
| Gene Alias | Fuc-TIX | |
| Cytomap | 6q16.1 | |
| Gene Type | protein-coding | GO ID | GO:0000271 | UniProtAcc | Q9Y231 |
Top |
Malignant transformation analysis |
| Identification of the aberrant gene expression in precancerous and cancerous lesions by comparing the gene expression of stem-like cells in diseased tissues with normal stem cells |
| Entrez ID | Symbol | Replicates | Species | Organ | Tissue | Adj P-value | Log2FC | Malignancy |
| 10690 | FUT9 | Pat02-B | Human | Stomach | GC | 1.29e-13 | 1.44e-01 | 0.0368 |
| 10690 | FUT9 | Pat04-B | Human | Stomach | GC | 3.57e-11 | 4.22e-01 | -0.1483 |
| 10690 | FUT9 | Pat05-B | Human | Stomach | GC | 3.98e-10 | 4.16e-01 | -0.0353 |
| 10690 | FUT9 | Pat06-B | Human | Stomach | GC | 1.24e-29 | 6.11e-01 | -0.1961 |
| 10690 | FUT9 | Pat15-B | Human | Stomach | GC | 1.13e-18 | 5.22e-01 | -0.0778 |
| 10690 | FUT9 | Pat18-B | Human | Stomach | GC | 5.98e-20 | 5.72e-01 | -0.0432 |
| 10690 | FUT9 | Pat19-B | Human | Stomach | GC | 1.59e-03 | 2.50e-01 | 0.0826 |
| 10690 | FUT9 | Pat22-B | Human | Stomach | GC | 6.06e-17 | 3.45e-01 | -0.1042 |
| 10690 | FUT9 | Pat24-B | Human | Stomach | GC | 2.58e-02 | 1.88e-01 | -0.1184 |
| 10690 | FUT9 | Pat25-A | Human | Stomach | CAG with IM | 1.29e-42 | 6.45e-01 | -0.1648 |
| 10690 | FUT9 | Pat26-A | Human | Stomach | CSG | 3.77e-48 | 6.26e-01 | -0.2402 |
| 10690 | FUT9 | Pat28-A | Human | Stomach | CSG | 5.61e-15 | 3.65e-01 | -0.2594 |
| 10690 | FUT9 | Pat29-A | Human | Stomach | CAG with IM | 3.18e-10 | 5.05e-01 | -0.2769 |
| Page: 1 |
| Tissue | Expression Dynamics | Abbreviation |
| GC | 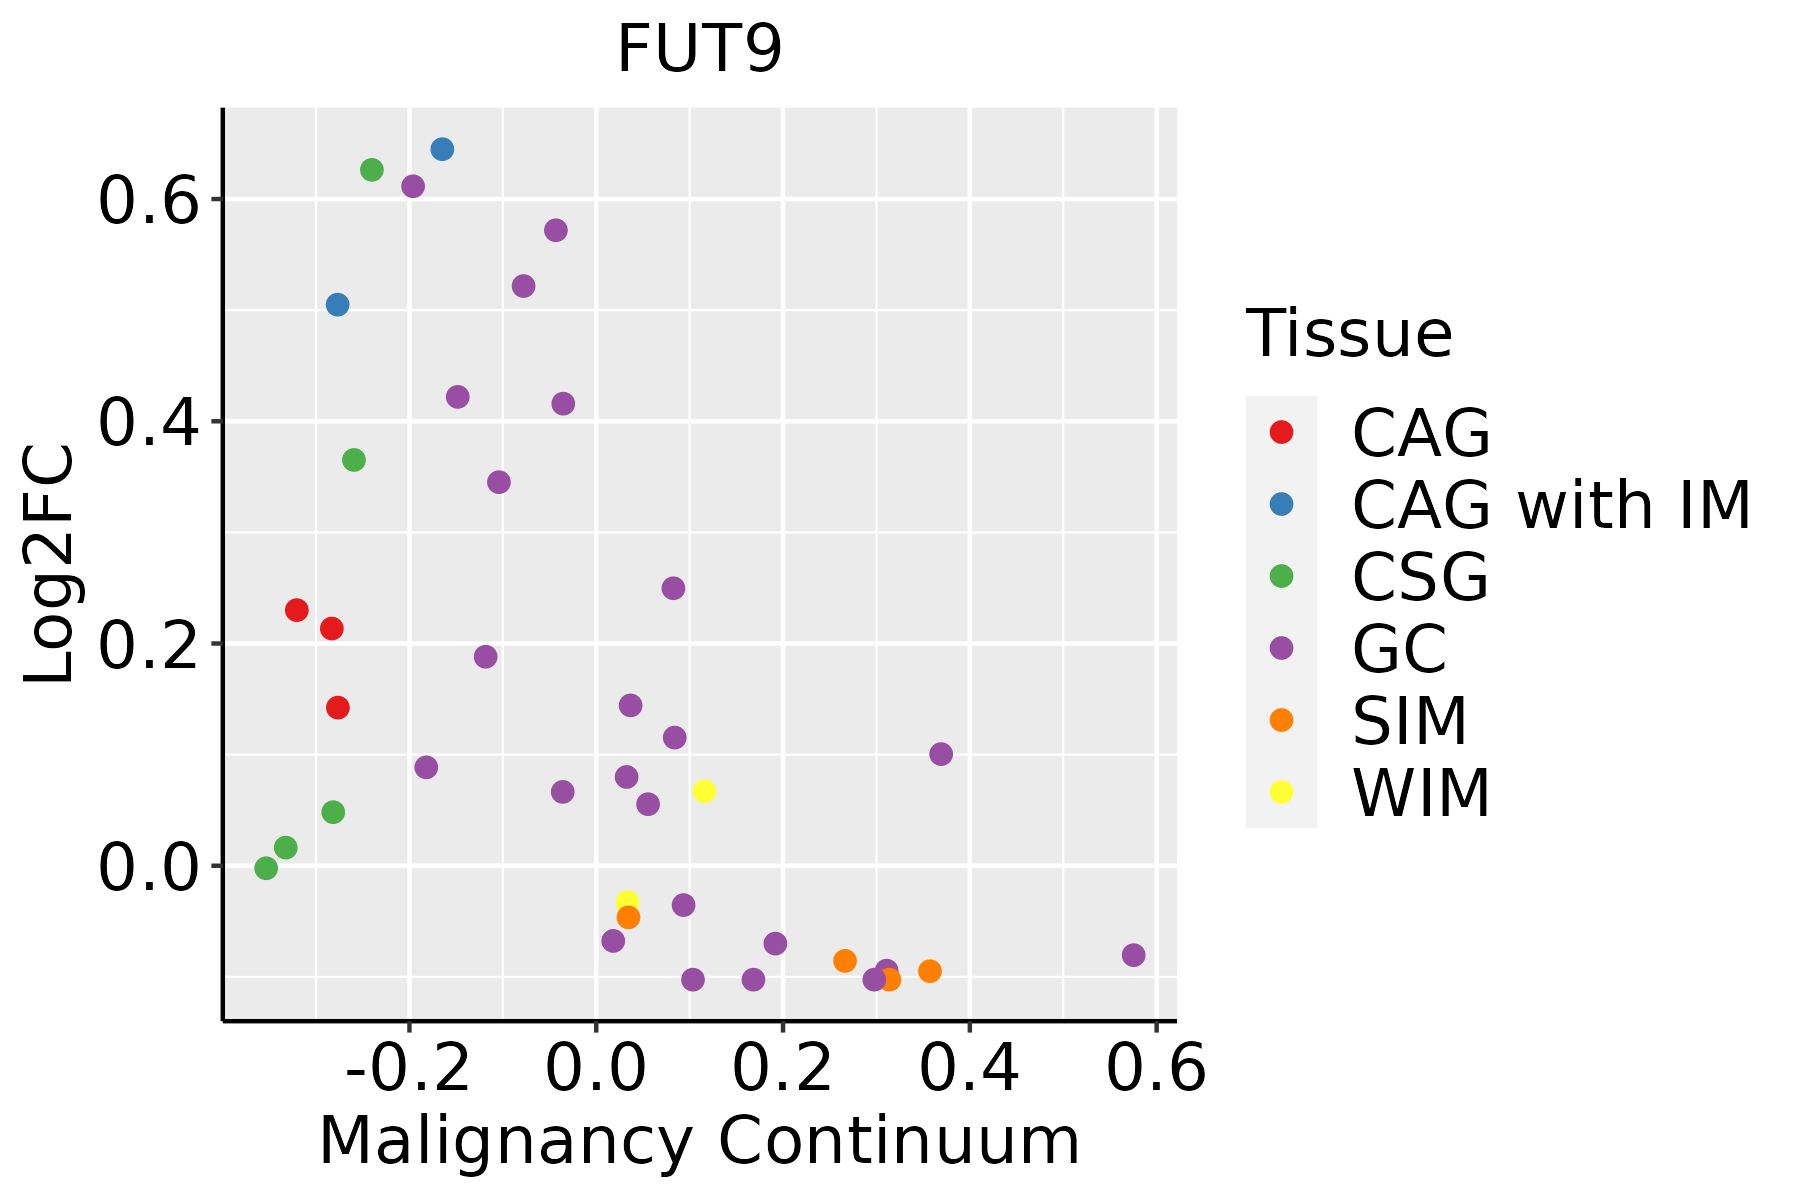 | CAG: Chronic atrophic gastritis |
| CAG with IM: Chronic atrophic gastritis with intestinal metaplasia | ||
| CSG: Chronic superficial gastritis | ||
| GC: Gastric cancer | ||
| SIM: Severe intestinal metaplasia | ||
| WIM: Wild intestinal metaplasia |
| ∗log2FC in expression of this searched gene in stem-like cells from each diseased tissue sample relative to stem-like cells in normal samples in each tissue plotted against the malignancy continuum. Samples are colored based on if they are from different disease stage. |
Top |
Malignant transformation related pathway analysis |
| Find out the enriched GO biological processes and KEGG pathways involved in transition from healthy to precancer to cancer |
| Tissue | Disease Stage | Enriched GO biological Processes |
| Colorectum | AD |  |
| Colorectum | SER |  |
| Colorectum | MSS |  |
| Colorectum | MSI-H |  |
| Colorectum | FAP |  |
| ∗Top 15 enriched GO BP terms are showed in the bar plot of each disease state in each tissue. Each row represents a significant GO biological process which is colored according to the -log10(p.adjust). |
| Page: 1 2 3 4 5 6 7 8 9 |
| GO ID | Tissue | Disease Stage | Description | Gene Ratio | Bg Ratio | pvalue | p.adjust | Count |
| GO:00224076 | Stomach | GC | regulation of cell-cell adhesion | 55/1159 | 448/18723 | 9.21e-07 | 4.39e-05 | 55 |
| GO:0007159 | Stomach | GC | leukocyte cell-cell adhesion | 45/1159 | 371/18723 | 1.21e-05 | 3.99e-04 | 45 |
| GO:0050900 | Stomach | GC | leukocyte migration | 44/1159 | 369/18723 | 2.30e-05 | 6.81e-04 | 44 |
| GO:1903037 | Stomach | GC | regulation of leukocyte cell-cell adhesion | 40/1159 | 336/18723 | 5.53e-05 | 1.30e-03 | 40 |
| GO:0002685 | Stomach | GC | regulation of leukocyte migration | 28/1159 | 210/18723 | 1.04e-04 | 2.05e-03 | 28 |
| GO:00059964 | Stomach | GC | monosaccharide metabolic process | 31/1159 | 257/18723 | 2.90e-04 | 4.67e-03 | 31 |
| GO:00193184 | Stomach | GC | hexose metabolic process | 29/1159 | 237/18723 | 3.53e-04 | 5.54e-03 | 29 |
| GO:00160525 | Stomach | GC | carbohydrate catabolic process | 21/1159 | 154/18723 | 5.38e-04 | 7.55e-03 | 21 |
| GO:00442824 | Stomach | GC | small molecule catabolic process | 40/1159 | 376/18723 | 5.92e-04 | 8.09e-03 | 40 |
| GO:00224071 | Stomach | CAG with IM | regulation of cell-cell adhesion | 49/1050 | 448/18723 | 6.02e-06 | 2.23e-04 | 49 |
| GO:00509001 | Stomach | CAG with IM | leukocyte migration | 40/1050 | 369/18723 | 5.16e-05 | 1.32e-03 | 40 |
| GO:00071591 | Stomach | CAG with IM | leukocyte cell-cell adhesion | 40/1050 | 371/18723 | 5.82e-05 | 1.44e-03 | 40 |
| GO:00026851 | Stomach | CAG with IM | regulation of leukocyte migration | 26/1050 | 210/18723 | 1.27e-04 | 2.64e-03 | 26 |
| GO:19030371 | Stomach | CAG with IM | regulation of leukocyte cell-cell adhesion | 36/1050 | 336/18723 | 1.52e-04 | 2.97e-03 | 36 |
| GO:001605211 | Stomach | CAG with IM | carbohydrate catabolic process | 19/1050 | 154/18723 | 1.02e-03 | 1.29e-02 | 19 |
| GO:000599611 | Stomach | CAG with IM | monosaccharide metabolic process | 26/1050 | 257/18723 | 2.67e-03 | 2.58e-02 | 26 |
| GO:001931811 | Stomach | CAG with IM | hexose metabolic process | 24/1050 | 237/18723 | 3.77e-03 | 3.31e-02 | 24 |
| GO:00224072 | Stomach | CSG | regulation of cell-cell adhesion | 48/1034 | 448/18723 | 8.67e-06 | 3.05e-04 | 48 |
| GO:00509002 | Stomach | CSG | leukocyte migration | 40/1034 | 369/18723 | 3.68e-05 | 9.87e-04 | 40 |
| GO:00071592 | Stomach | CSG | leukocyte cell-cell adhesion | 39/1034 | 371/18723 | 8.93e-05 | 2.07e-03 | 39 |
| Page: 1 2 |
| Pathway ID | Tissue | Disease Stage | Description | Gene Ratio | Bg Ratio | pvalue | p.adjust | qvalue | Count |
| Page: 1 |
Top |
Cell-cell communication analysis |
| Identification of potential cell-cell interactions between two cell types and their ligand-receptor pairs for different disease states |
| Ligand | Receptor | LRpair | Pathway | Tissue | Disease Stage |
| Page: 1 |
Top |
Single-cell gene regulatory network inference analysis |
| Find out the significant the regulons (TFs) and the target genes of each regulon across cell types for different disease states |
| TF | Cell Type | Tissue | Disease Stage | Target Gene | RSS | Regulon Activity |
| ∗The dot plots of a searched regulon are shown for all cell subpopulations in each disease state of each tissue based on the regulon specific score inferred using pySCENIC and by calculating the average expression. |
| Page: 1 |
Top |
Somatic mutation of malignant transformation related genes |
| Annotation of somatic variants for genes involved in malignant transformation |
| Hugo Symbol | Variant Class | Variant Classification | dbSNP RS | HGVSc | HGVSp | HGVSp Short | SWISSPROT | BIOTYPE | SIFT | PolyPhen | Tumor Sample Barcode | Tissue | Histology | Sex | Age | Stage | Therapy Types | Drugs | Outcome |
| FUT9 | SNV | Missense_Mutation | novel | c.359T>C | p.Leu120Ser | p.L120S | Q9Y231 | protein_coding | deleterious(0) | probably_damaging(0.993) | TCGA-A2-A1FX-01 | Breast | breast invasive carcinoma | Female | <65 | III/IV | Chemotherapy | taxotere | SD |
| FUT9 | SNV | Missense_Mutation | novel | c.245N>A | p.Cys82Tyr | p.C82Y | Q9Y231 | protein_coding | deleterious(0) | probably_damaging(1) | TCGA-EA-A3HU-01 | Cervix | cervical & endocervical cancer | Female | <65 | I/II | Unknown | Unknown | SD |
| FUT9 | SNV | Missense_Mutation | c.573G>C | p.Trp191Cys | p.W191C | Q9Y231 | protein_coding | deleterious(0) | probably_damaging(1) | TCGA-EK-A2PM-01 | Cervix | cervical & endocervical cancer | Female | >=65 | I/II | Unknown | Unknown | SD | |
| FUT9 | SNV | Missense_Mutation | c.645N>G | p.Ile215Met | p.I215M | Q9Y231 | protein_coding | deleterious(0) | probably_damaging(0.989) | TCGA-EK-A3GJ-01 | Cervix | cervical & endocervical cancer | Female | <65 | I/II | Unknown | Unknown | SD | |
| FUT9 | SNV | Missense_Mutation | c.349C>G | p.Leu117Val | p.L117V | Q9Y231 | protein_coding | deleterious(0.01) | probably_damaging(0.996) | TCGA-A6-6652-01 | Colorectum | colon adenocarcinoma | Male | <65 | I/II | Targeted Molecular therapy | cetuximab | SD | |
| FUT9 | SNV | Missense_Mutation | rs142793962 | c.983N>A | p.Arg328Gln | p.R328Q | Q9Y231 | protein_coding | tolerated(0.58) | benign(0) | TCGA-AA-3510-01 | Colorectum | colon adenocarcinoma | Male | >=65 | I/II | Unknown | Unknown | SD |
| FUT9 | SNV | Missense_Mutation | c.450N>A | p.His150Gln | p.H150Q | Q9Y231 | protein_coding | tolerated(0.24) | possibly_damaging(0.484) | TCGA-AA-3715-01 | Colorectum | colon adenocarcinoma | Male | >=65 | I/II | Unknown | Unknown | PD | |
| FUT9 | SNV | Missense_Mutation | c.739T>G | p.Ser247Ala | p.S247A | Q9Y231 | protein_coding | deleterious(0) | probably_damaging(0.993) | TCGA-AA-3977-01 | Colorectum | colon adenocarcinoma | Male | >=65 | I/II | Unknown | Unknown | SD | |
| FUT9 | SNV | Missense_Mutation | novel | c.838N>C | p.Tyr280His | p.Y280H | Q9Y231 | protein_coding | tolerated(0.14) | benign(0.015) | TCGA-AD-A5EJ-01 | Colorectum | colon adenocarcinoma | Female | >=65 | I/II | Unknown | Unknown | SD |
| FUT9 | SNV | Missense_Mutation | novel | c.686N>C | p.Lys229Thr | p.K229T | Q9Y231 | protein_coding | tolerated(0.18) | benign(0.065) | TCGA-AZ-4315-01 | Colorectum | colon adenocarcinoma | Male | <65 | I/II | Unknown | Unknown | SD |
| Page: 1 2 3 4 5 6 7 8 9 10 |
Top |
Related drugs of malignant transformation related genes |
| Identification of chemicals and drugs interact with genes involved in malignant transfromation |
| (DGIdb 4.0) |
| Entrez ID | Symbol | Category | Interaction Types | Drug Claim Name | Drug Name | PMIDs |
| Page: 1 |

Copyright 2023-Present -The University of Texas Health Science Center at Houston |