
|
|||||
|
 | |
| |
| |
| |
| |
| |
|
Gene: FUT3 |
Gene summary for FUT3 |
| Gene information | Species | Human | Gene symbol | FUT3 | Gene ID | 2525 |
| Gene name | fucosyltransferase 3 (Lewis blood group) | |
| Gene Alias | CD174 | |
| Cytomap | 19p13.3 | |
| Gene Type | protein-coding | GO ID | GO:0005975 | UniProtAcc | A8K737 |
Top |
Malignant transformation analysis |
| Identification of the aberrant gene expression in precancerous and cancerous lesions by comparing the gene expression of stem-like cells in diseased tissues with normal stem cells |
| Entrez ID | Symbol | Replicates | Species | Organ | Tissue | Adj P-value | Log2FC | Malignancy |
| 2525 | FUT3 | LZE5T | Human | Esophagus | ESCC | 7.03e-04 | 3.78e-01 | 0.0514 |
| 2525 | FUT3 | LZE24T | Human | Esophagus | ESCC | 1.12e-07 | 4.22e-01 | 0.0596 |
| 2525 | FUT3 | P1T-E | Human | Esophagus | ESCC | 1.43e-07 | 1.46e+00 | 0.0875 |
| 2525 | FUT3 | P8T-E | Human | Esophagus | ESCC | 5.64e-21 | 4.42e-01 | 0.0889 |
| 2525 | FUT3 | P23T-E | Human | Esophagus | ESCC | 1.30e-17 | 1.53e+00 | 0.108 |
| 2525 | FUT3 | P39T-E | Human | Esophagus | ESCC | 1.28e-20 | 9.74e-01 | 0.0894 |
| 2525 | FUT3 | P57T-E | Human | Esophagus | ESCC | 5.02e-08 | 2.65e-01 | 0.0926 |
| 2525 | FUT3 | P61T-E | Human | Esophagus | ESCC | 3.13e-05 | 6.46e-02 | 0.099 |
| 2525 | FUT3 | P74T-E | Human | Esophagus | ESCC | 2.15e-06 | 3.64e-01 | 0.1479 |
| 2525 | FUT3 | P75T-E | Human | Esophagus | ESCC | 4.97e-23 | 9.48e-01 | 0.1125 |
| 2525 | FUT3 | P82T-E | Human | Esophagus | ESCC | 1.08e-11 | 1.14e+00 | 0.1072 |
| 2525 | FUT3 | P94T-E | Human | Esophagus | ESCC | 2.07e-04 | 9.37e-01 | 0.0879 |
| 2525 | FUT3 | P126T-E | Human | Esophagus | ESCC | 3.26e-02 | 9.56e-01 | 0.1125 |
| 2525 | FUT3 | P127T-E | Human | Esophagus | ESCC | 6.28e-10 | 3.73e-01 | 0.0826 |
| 2525 | FUT3 | P128T-E | Human | Esophagus | ESCC | 1.53e-22 | 1.02e+00 | 0.1241 |
| 2525 | FUT3 | C21 | Human | Oral cavity | OSCC | 4.68e-06 | 6.14e-01 | 0.2678 |
| 2525 | FUT3 | C57 | Human | Oral cavity | OSCC | 2.98e-48 | 1.66e+00 | 0.1679 |
| Page: 1 |
| Tissue | Expression Dynamics | Abbreviation |
| Esophagus | 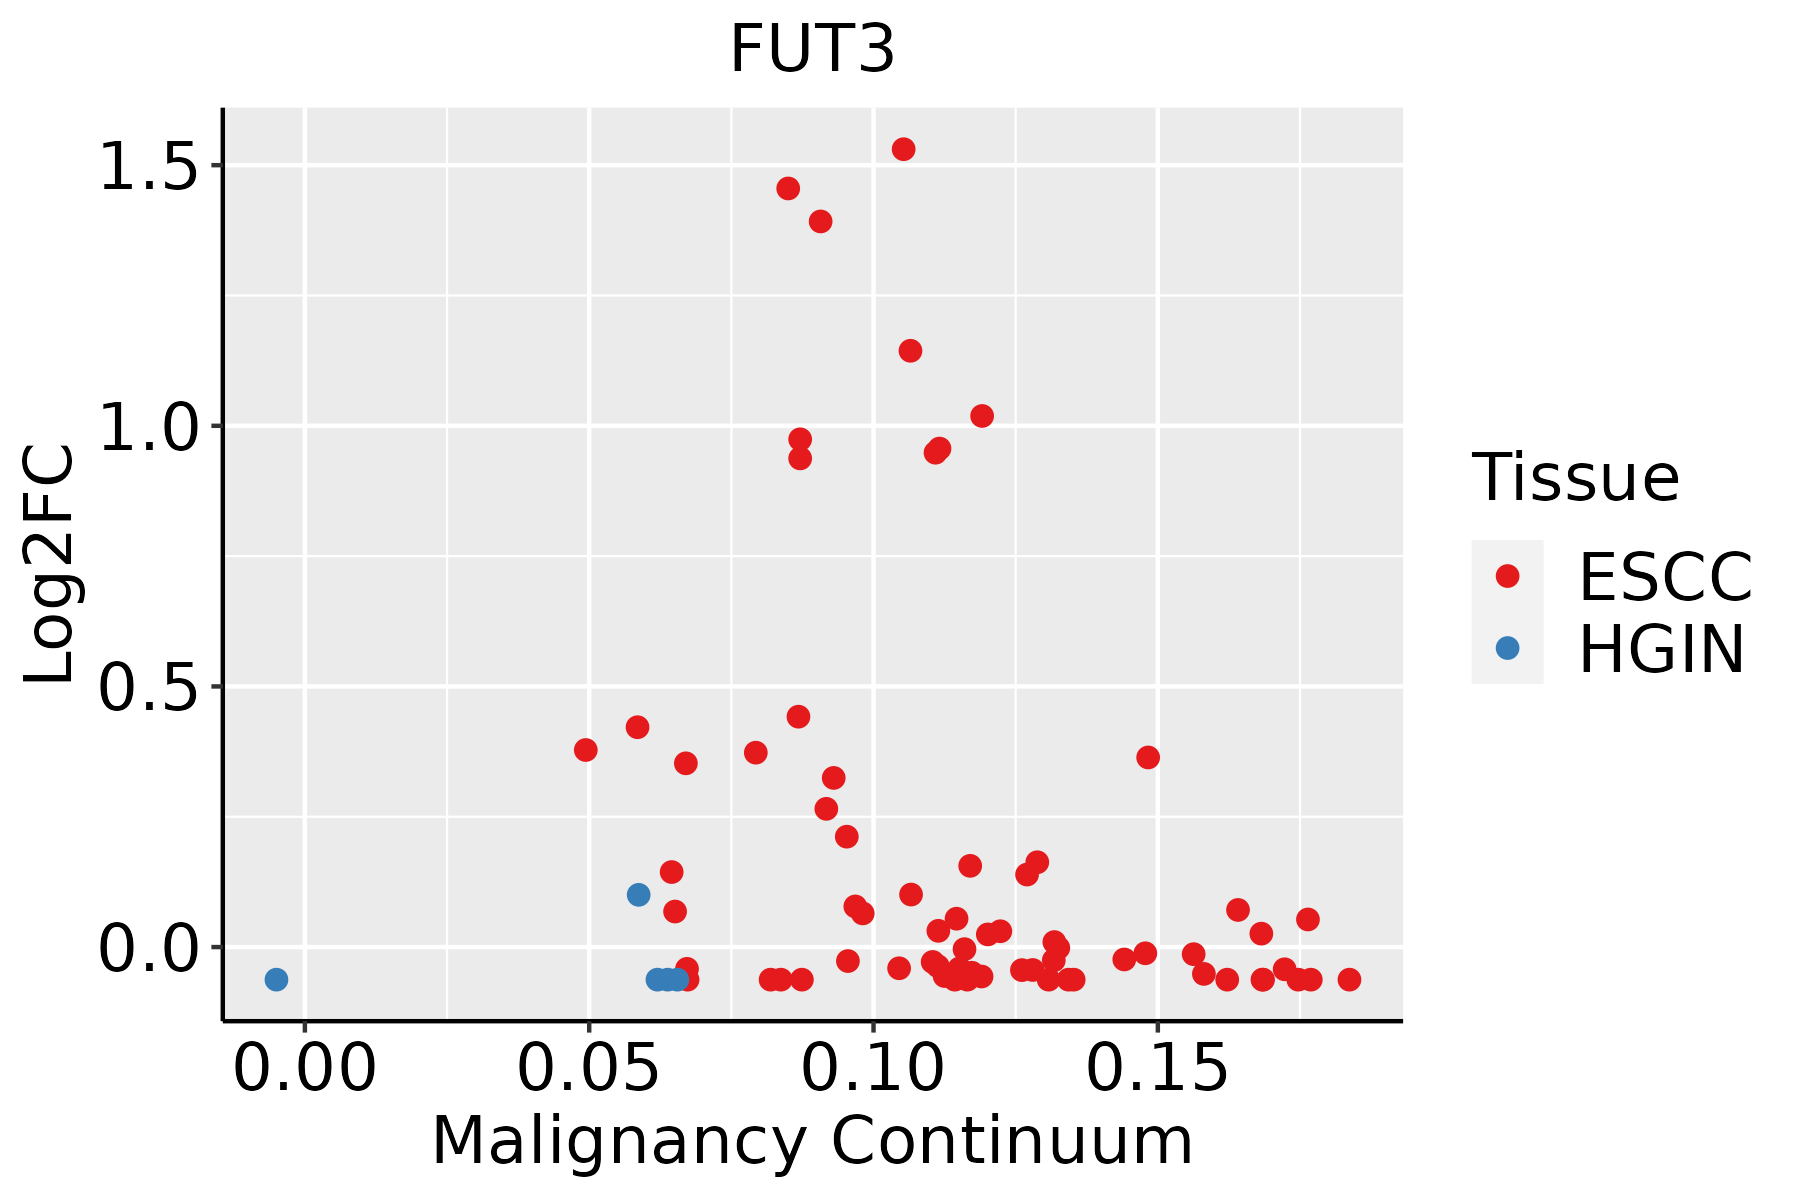 | ESCC: Esophageal squamous cell carcinoma |
| HGIN: High-grade intraepithelial neoplasias | ||
| LGIN: Low-grade intraepithelial neoplasias | ||
| Oral Cavity | 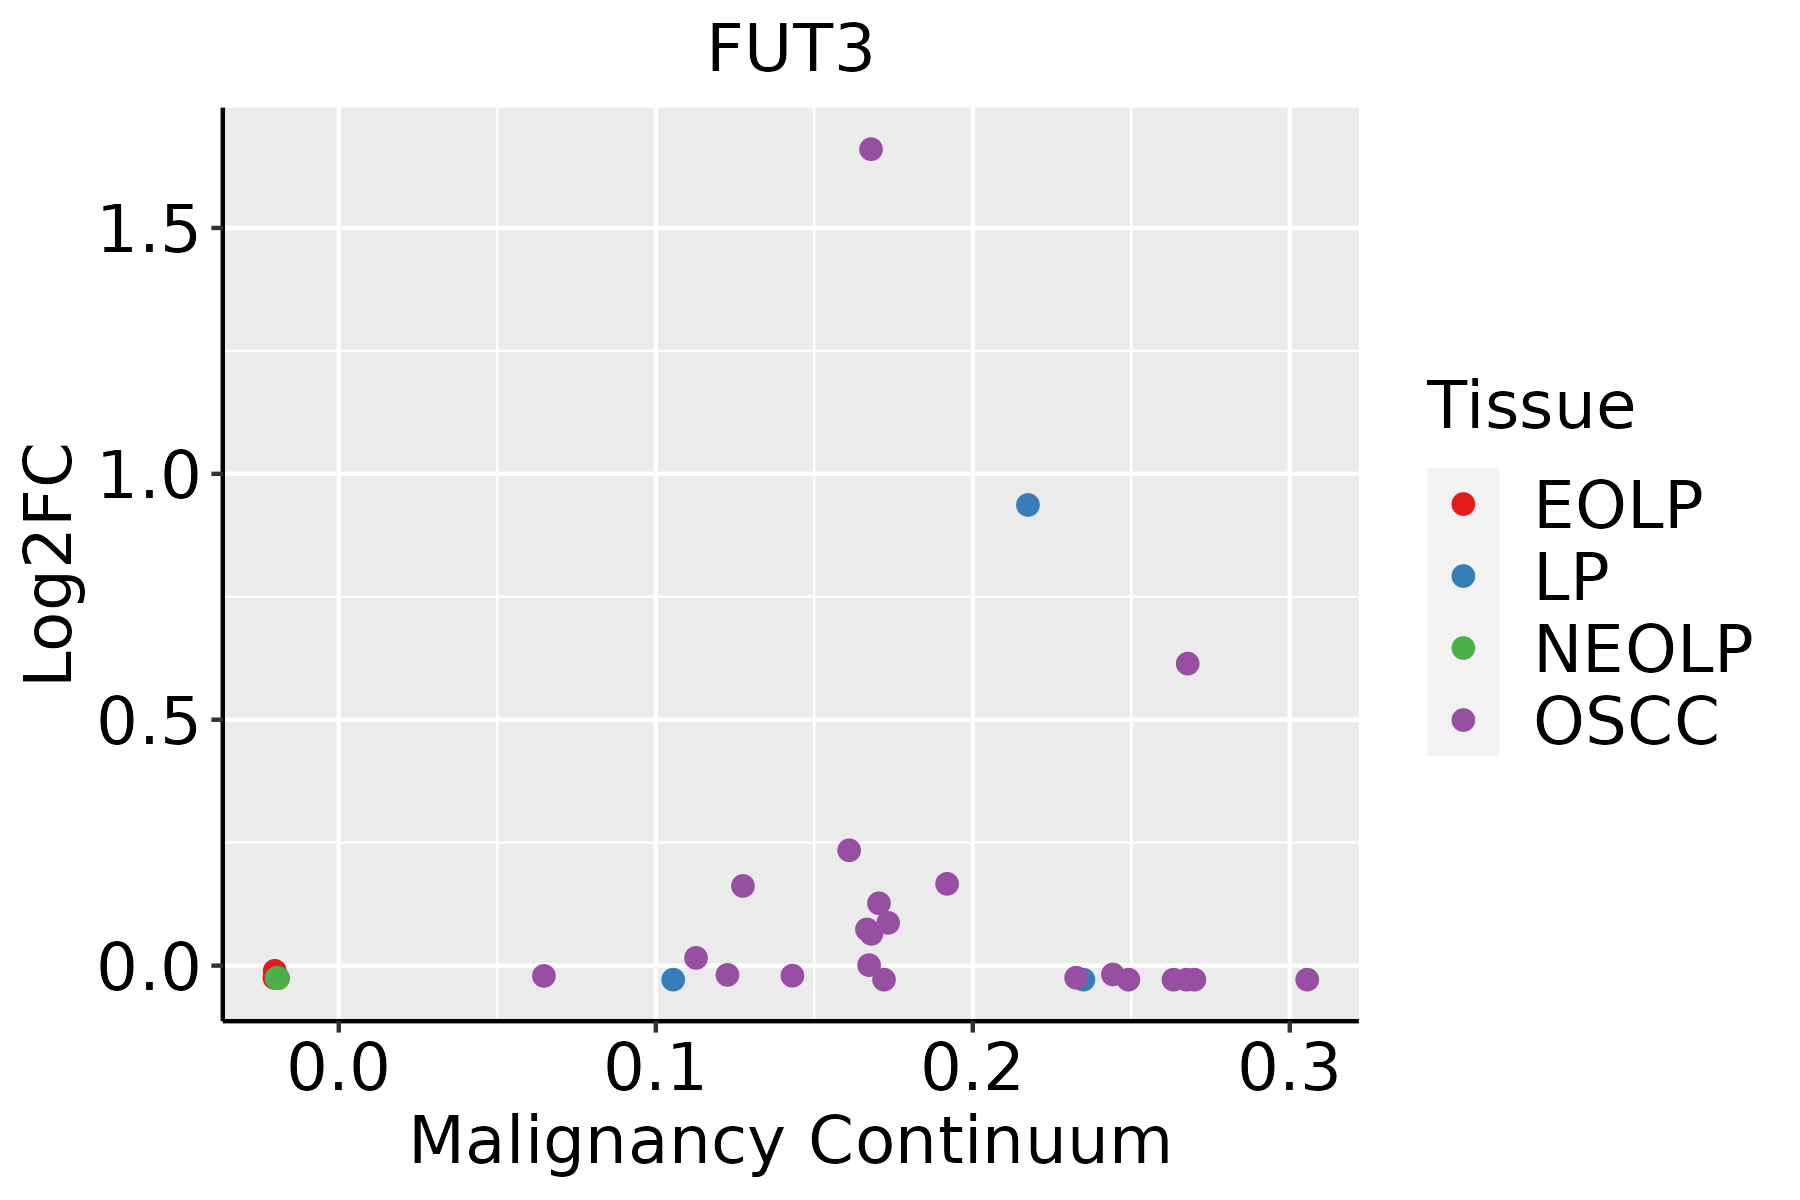 | EOLP: Erosive Oral lichen planus |
| LP: leukoplakia | ||
| NEOLP: Non-erosive oral lichen planus | ||
| OSCC: Oral squamous cell carcinoma |
| ∗log2FC in expression of this searched gene in stem-like cells from each diseased tissue sample relative to stem-like cells in normal samples in each tissue plotted against the malignancy continuum. Samples are colored based on if they are from different disease stage. |
Top |
Malignant transformation related pathway analysis |
| Find out the enriched GO biological processes and KEGG pathways involved in transition from healthy to precancer to cancer |
| Tissue | Disease Stage | Enriched GO biological Processes |
| Colorectum | AD |  |
| Colorectum | SER |  |
| Colorectum | MSS |  |
| Colorectum | MSI-H |  |
| Colorectum | FAP |  |
| ∗Top 15 enriched GO BP terms are showed in the bar plot of each disease state in each tissue. Each row represents a significant GO biological process which is colored according to the -log10(p.adjust). |
| Page: 1 2 3 4 5 6 7 8 9 |
| GO ID | Tissue | Disease Stage | Description | Gene Ratio | Bg Ratio | pvalue | p.adjust | Count |
| GO:004578527 | Esophagus | ESCC | positive regulation of cell adhesion | 255/8552 | 437/18723 | 5.07e-08 | 9.11e-07 | 255 |
| GO:00066433 | Esophagus | ESCC | membrane lipid metabolic process | 130/8552 | 203/18723 | 9.29e-08 | 1.54e-06 | 130 |
| GO:00091002 | Esophagus | ESCC | glycoprotein metabolic process | 226/8552 | 387/18723 | 2.64e-07 | 3.94e-06 | 226 |
| GO:00700854 | Esophagus | ESCC | glycosylation | 144/8552 | 240/18723 | 5.12e-06 | 5.38e-05 | 144 |
| GO:00064865 | Esophagus | ESCC | protein glycosylation | 135/8552 | 226/18723 | 1.36e-05 | 1.24e-04 | 135 |
| GO:00434135 | Esophagus | ESCC | macromolecule glycosylation | 135/8552 | 226/18723 | 1.36e-05 | 1.24e-04 | 135 |
| GO:00091012 | Esophagus | ESCC | glycoprotein biosynthetic process | 181/8552 | 317/18723 | 2.54e-05 | 2.15e-04 | 181 |
| GO:00066652 | Esophagus | ESCC | sphingolipid metabolic process | 96/8552 | 155/18723 | 3.21e-05 | 2.66e-04 | 96 |
| GO:00160514 | Esophagus | ESCC | carbohydrate biosynthetic process | 117/8552 | 202/18723 | 2.96e-04 | 1.79e-03 | 117 |
| GO:002240720 | Esophagus | ESCC | regulation of cell-cell adhesion | 239/8552 | 448/18723 | 5.88e-04 | 3.19e-03 | 239 |
| GO:002240919 | Esophagus | ESCC | positive regulation of cell-cell adhesion | 155/8552 | 284/18723 | 1.50e-03 | 7.06e-03 | 155 |
| GO:00066721 | Esophagus | ESCC | ceramide metabolic process | 61/8552 | 102/18723 | 2.82e-03 | 1.19e-02 | 61 |
| GO:004578520 | Oral cavity | OSCC | positive regulation of cell adhesion | 225/7305 | 437/18723 | 6.06e-08 | 1.09e-06 | 225 |
| GO:00066432 | Oral cavity | OSCC | membrane lipid metabolic process | 111/7305 | 203/18723 | 4.02e-06 | 4.69e-05 | 111 |
| GO:002240718 | Oral cavity | OSCC | regulation of cell-cell adhesion | 218/7305 | 448/18723 | 1.71e-05 | 1.68e-04 | 218 |
| GO:00066651 | Oral cavity | OSCC | sphingolipid metabolic process | 84/7305 | 155/18723 | 8.64e-05 | 6.61e-04 | 84 |
| GO:00091001 | Oral cavity | OSCC | glycoprotein metabolic process | 185/7305 | 387/18723 | 2.37e-04 | 1.54e-03 | 185 |
| GO:00091011 | Oral cavity | OSCC | glycoprotein biosynthetic process | 151/7305 | 317/18723 | 1.01e-03 | 5.26e-03 | 151 |
| GO:00064864 | Oral cavity | OSCC | protein glycosylation | 111/7305 | 226/18723 | 1.22e-03 | 6.10e-03 | 111 |
| GO:00434134 | Oral cavity | OSCC | macromolecule glycosylation | 111/7305 | 226/18723 | 1.22e-03 | 6.10e-03 | 111 |
| Page: 1 2 |
| Pathway ID | Tissue | Disease Stage | Description | Gene Ratio | Bg Ratio | pvalue | p.adjust | qvalue | Count |
| Page: 1 |
Top |
Cell-cell communication analysis |
| Identification of potential cell-cell interactions between two cell types and their ligand-receptor pairs for different disease states |
| Ligand | Receptor | LRpair | Pathway | Tissue | Disease Stage |
| Page: 1 |
Top |
Single-cell gene regulatory network inference analysis |
| Find out the significant the regulons (TFs) and the target genes of each regulon across cell types for different disease states |
| TF | Cell Type | Tissue | Disease Stage | Target Gene | RSS | Regulon Activity |
| ∗The dot plots of a searched regulon are shown for all cell subpopulations in each disease state of each tissue based on the regulon specific score inferred using pySCENIC and by calculating the average expression. |
| Page: 1 |
Top |
Somatic mutation of malignant transformation related genes |
| Annotation of somatic variants for genes involved in malignant transformation |
| Hugo Symbol | Variant Class | Variant Classification | dbSNP RS | HGVSc | HGVSp | HGVSp Short | SWISSPROT | BIOTYPE | SIFT | PolyPhen | Tumor Sample Barcode | Tissue | Histology | Sex | Age | Stage | Therapy Types | Drugs | Outcome |
| FUT3 | SNV | Missense_Mutation | rs574660146 | c.391N>T | p.Arg131Cys | p.R131C | P21217 | protein_coding | deleterious(0) | probably_damaging(0.977) | TCGA-AN-A0AM-01 | Breast | breast invasive carcinoma | Female | <65 | I/II | Unknown | Unknown | SD |
| FUT3 | SNV | Missense_Mutation | rs377154201 | c.710N>T | p.Thr237Met | p.T237M | P21217 | protein_coding | tolerated(0.12) | possibly_damaging(0.865) | TCGA-AN-A0AR-01 | Breast | breast invasive carcinoma | Female | <65 | I/II | Unknown | Unknown | SD |
| FUT3 | SNV | Missense_Mutation | c.943C>A | p.Arg315Ser | p.R315S | P21217 | protein_coding | tolerated(0.13) | benign(0.054) | TCGA-B6-A0RG-01 | Breast | breast invasive carcinoma | Female | <65 | I/II | Unknown | Unknown | SD | |
| FUT3 | SNV | Missense_Mutation | rs757862405 | c.587N>T | p.Ala196Val | p.A196V | P21217 | protein_coding | tolerated(1) | benign(0.003) | TCGA-2W-A8YY-01 | Cervix | cervical & endocervical cancer | Female | <65 | I/II | Chemotherapy | cisplatin | CR |
| FUT3 | SNV | Missense_Mutation | rs778522520 | c.742N>A | p.Glu248Lys | p.E248K | P21217 | protein_coding | deleterious(0.03) | benign(0.437) | TCGA-DR-A0ZM-01 | Cervix | cervical & endocervical cancer | Female | <65 | III/IV | Unspecific | Cisplatin | SD |
| FUT3 | SNV | Missense_Mutation | novel | c.76N>C | p.Val26Leu | p.V26L | P21217 | protein_coding | tolerated(1) | benign(0.005) | TCGA-5M-AAT5-01 | Colorectum | colon adenocarcinoma | Unknown | Unknown | I/II | Unknown | Unknown | Unknown |
| FUT3 | SNV | Missense_Mutation | rs779913543 | c.359G>A | p.Arg120His | p.R120H | P21217 | protein_coding | deleterious(0.04) | benign(0.06) | TCGA-AA-3864-01 | Colorectum | colon adenocarcinoma | Male | >=65 | I/II | Unknown | Unknown | SD |
| FUT3 | SNV | Missense_Mutation | novel | c.863A>G | p.Asp288Gly | p.D288G | P21217 | protein_coding | deleterious(0) | probably_damaging(0.962) | TCGA-AA-A00N-01 | Colorectum | colon adenocarcinoma | Male | >=65 | I/II | Unknown | Unknown | PD |
| FUT3 | SNV | Missense_Mutation | rs758856535 | c.479G>A | p.Arg160His | p.R160H | P21217 | protein_coding | tolerated(0.05) | possibly_damaging(0.754) | TCGA-AA-A00N-01 | Colorectum | colon adenocarcinoma | Male | >=65 | I/II | Unknown | Unknown | PD |
| FUT3 | SNV | Missense_Mutation | novel | c.152N>A | p.Ser51Tyr | p.S51Y | P21217 | protein_coding | tolerated(0.65) | possibly_damaging(0.517) | TCGA-AG-3602-01 | Colorectum | rectum adenocarcinoma | Female | >=65 | III/IV | Unknown | Unknown | SD |
| Page: 1 2 3 4 5 6 |
Top |
Related drugs of malignant transformation related genes |
| Identification of chemicals and drugs interact with genes involved in malignant transfromation |
| (DGIdb 4.0) |
| Entrez ID | Symbol | Category | Interaction Types | Drug Claim Name | Drug Name | PMIDs |
| 2525 | FUT3 | ENZYME | Rebmab-100 |
| Page: 1 |

Copyright 2023-Present -The University of Texas Health Science Center at Houston |