
|
|||||
|
 | |
| |
| |
| |
| |
| |
|
Gene: FUT2 |
Gene summary for FUT2 |
| Gene information | Species | Human | Gene symbol | FUT2 | Gene ID | 2524 |
| Gene name | fucosyltransferase 2 | |
| Gene Alias | B12QTL1 | |
| Cytomap | 19q13.33 | |
| Gene Type | protein-coding | GO ID | GO:0001935 | UniProtAcc | A8K2L2 |
Top |
Malignant transformation analysis |
| Identification of the aberrant gene expression in precancerous and cancerous lesions by comparing the gene expression of stem-like cells in diseased tissues with normal stem cells |
| Entrez ID | Symbol | Replicates | Species | Organ | Tissue | Adj P-value | Log2FC | Malignancy |
| 2524 | FUT2 | HTA11_2487_2000001011 | Human | Colorectum | SER | 1.15e-06 | 3.97e-01 | -0.1808 |
| 2524 | FUT2 | HTA11_347_2000001011 | Human | Colorectum | AD | 8.20e-16 | 4.97e-01 | -0.1954 |
| 2524 | FUT2 | HTA11_411_2000001011 | Human | Colorectum | SER | 6.61e-05 | 8.59e-01 | -0.2602 |
| 2524 | FUT2 | HTA11_2112_2000001011 | Human | Colorectum | SER | 2.19e-02 | 6.50e-01 | -0.2196 |
| 2524 | FUT2 | HTA11_83_2000001011 | Human | Colorectum | SER | 1.83e-02 | 3.01e-01 | -0.1526 |
| 2524 | FUT2 | HTA11_696_2000001011 | Human | Colorectum | AD | 6.65e-04 | 3.70e-01 | -0.1464 |
| 2524 | FUT2 | HTA11_1391_2000001011 | Human | Colorectum | AD | 3.56e-07 | 4.03e-01 | -0.059 |
| 2524 | FUT2 | HTA11_866_3004761011 | Human | Colorectum | AD | 1.84e-03 | 1.65e-01 | 0.096 |
| 2524 | FUT2 | A015-C-203 | Human | Colorectum | FAP | 2.44e-03 | -1.31e-01 | -0.1294 |
| 2524 | FUT2 | A015-C-104 | Human | Colorectum | FAP | 5.57e-07 | -2.07e-01 | -0.1899 |
| 2524 | FUT2 | A002-C-016 | Human | Colorectum | FAP | 2.45e-03 | -1.41e-01 | 0.0521 |
| 2524 | FUT2 | A002-C-116 | Human | Colorectum | FAP | 8.04e-04 | -1.40e-01 | -0.0452 |
| 2524 | FUT2 | F034 | Human | Colorectum | FAP | 3.50e-02 | -1.25e-01 | -0.0665 |
| 2524 | FUT2 | LZE5T | Human | Esophagus | ESCC | 8.71e-05 | 1.05e+00 | 0.0514 |
| 2524 | FUT2 | LZE24T | Human | Esophagus | ESCC | 1.84e-03 | -1.79e-02 | 0.0596 |
| 2524 | FUT2 | LZE21T | Human | Esophagus | ESCC | 2.59e-04 | 1.54e-01 | 0.0655 |
| 2524 | FUT2 | P1T-E | Human | Esophagus | ESCC | 4.84e-02 | 7.40e-01 | 0.0875 |
| 2524 | FUT2 | P4T-E | Human | Esophagus | ESCC | 3.55e-04 | -3.75e-02 | 0.1323 |
| 2524 | FUT2 | P5T-E | Human | Esophagus | ESCC | 3.36e-05 | -6.23e-03 | 0.1327 |
| 2524 | FUT2 | P8T-E | Human | Esophagus | ESCC | 1.76e-28 | 6.84e-01 | 0.0889 |
| Page: 1 2 3 |
| Tissue | Expression Dynamics | Abbreviation |
| Colorectum (GSE201348) |  | FAP: Familial adenomatous polyposis |
| CRC: Colorectal cancer | ||
| Colorectum (HTA11) | 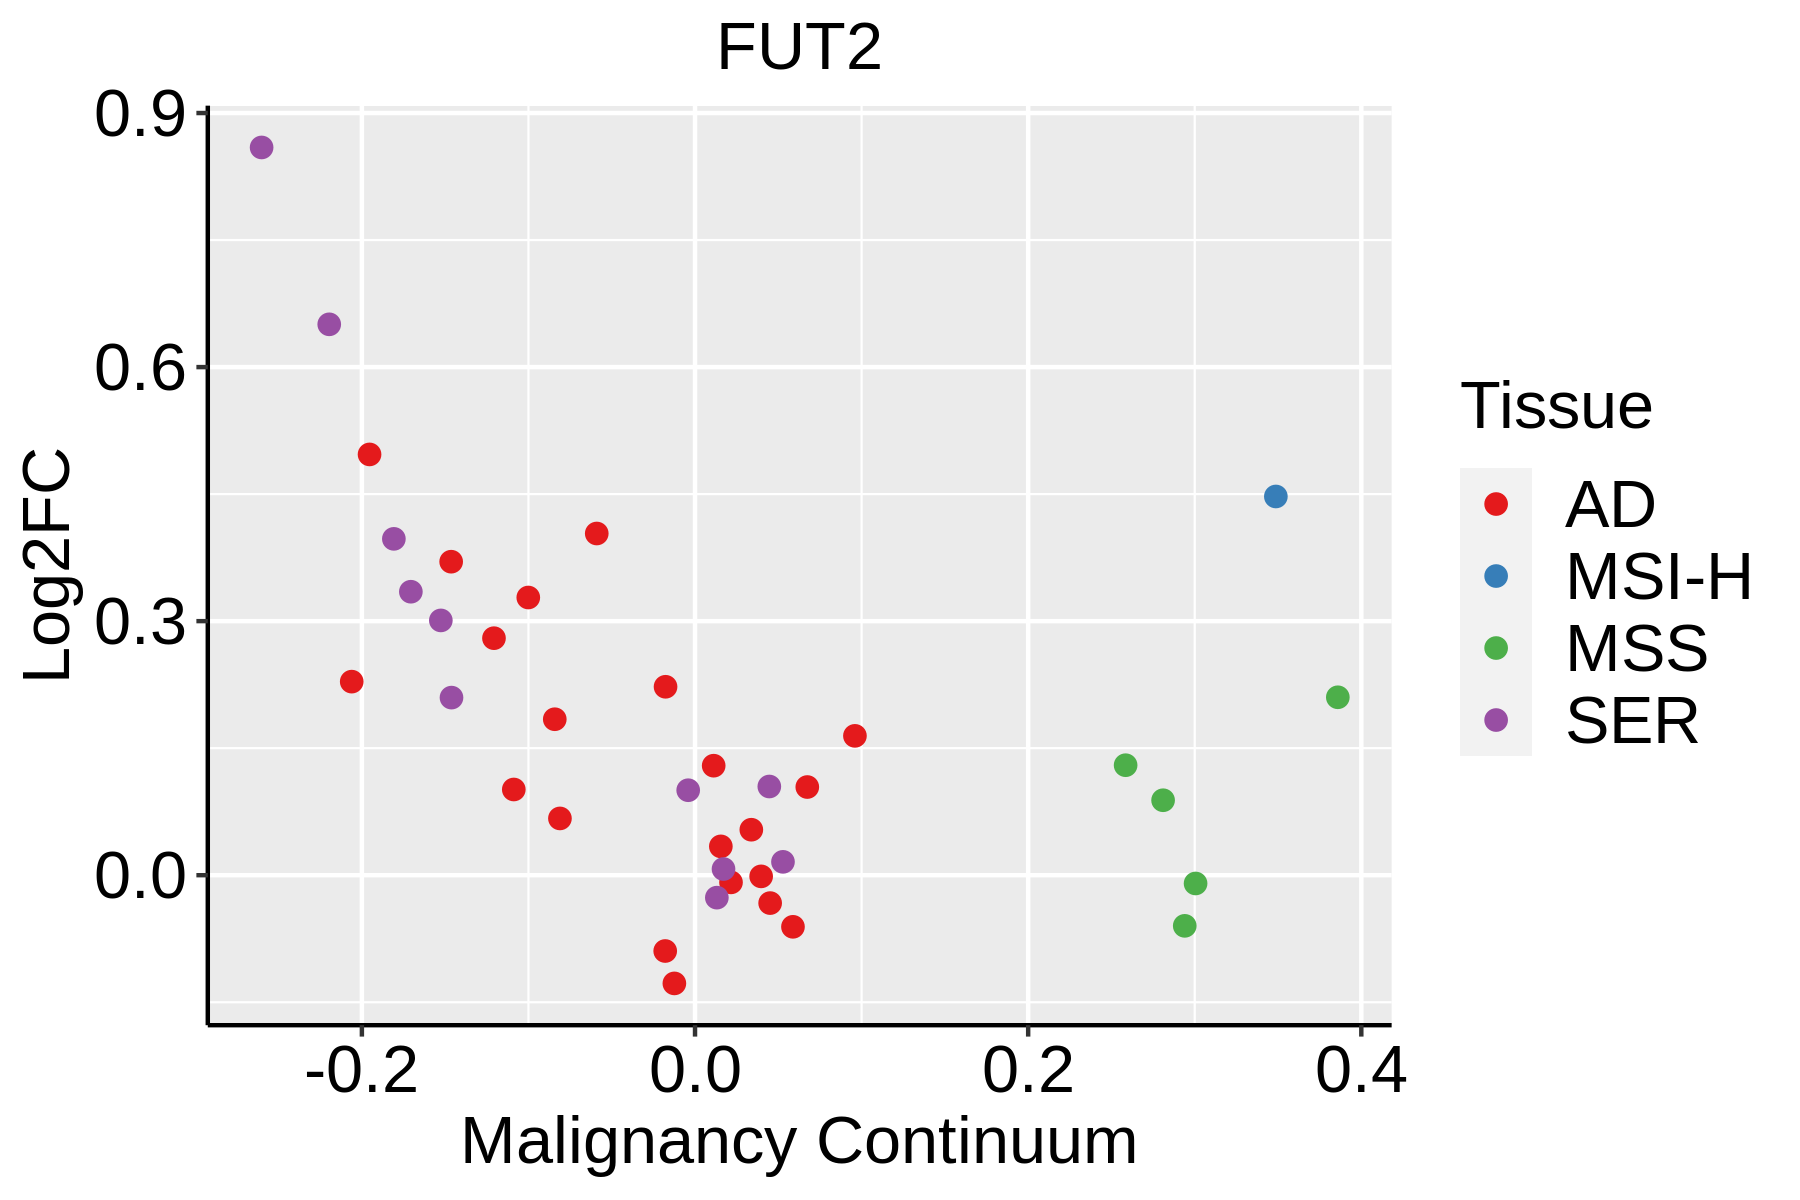 | AD: Adenomas |
| SER: Sessile serrated lesions | ||
| MSI-H: Microsatellite-high colorectal cancer | ||
| MSS: Microsatellite stable colorectal cancer | ||
| Esophagus | 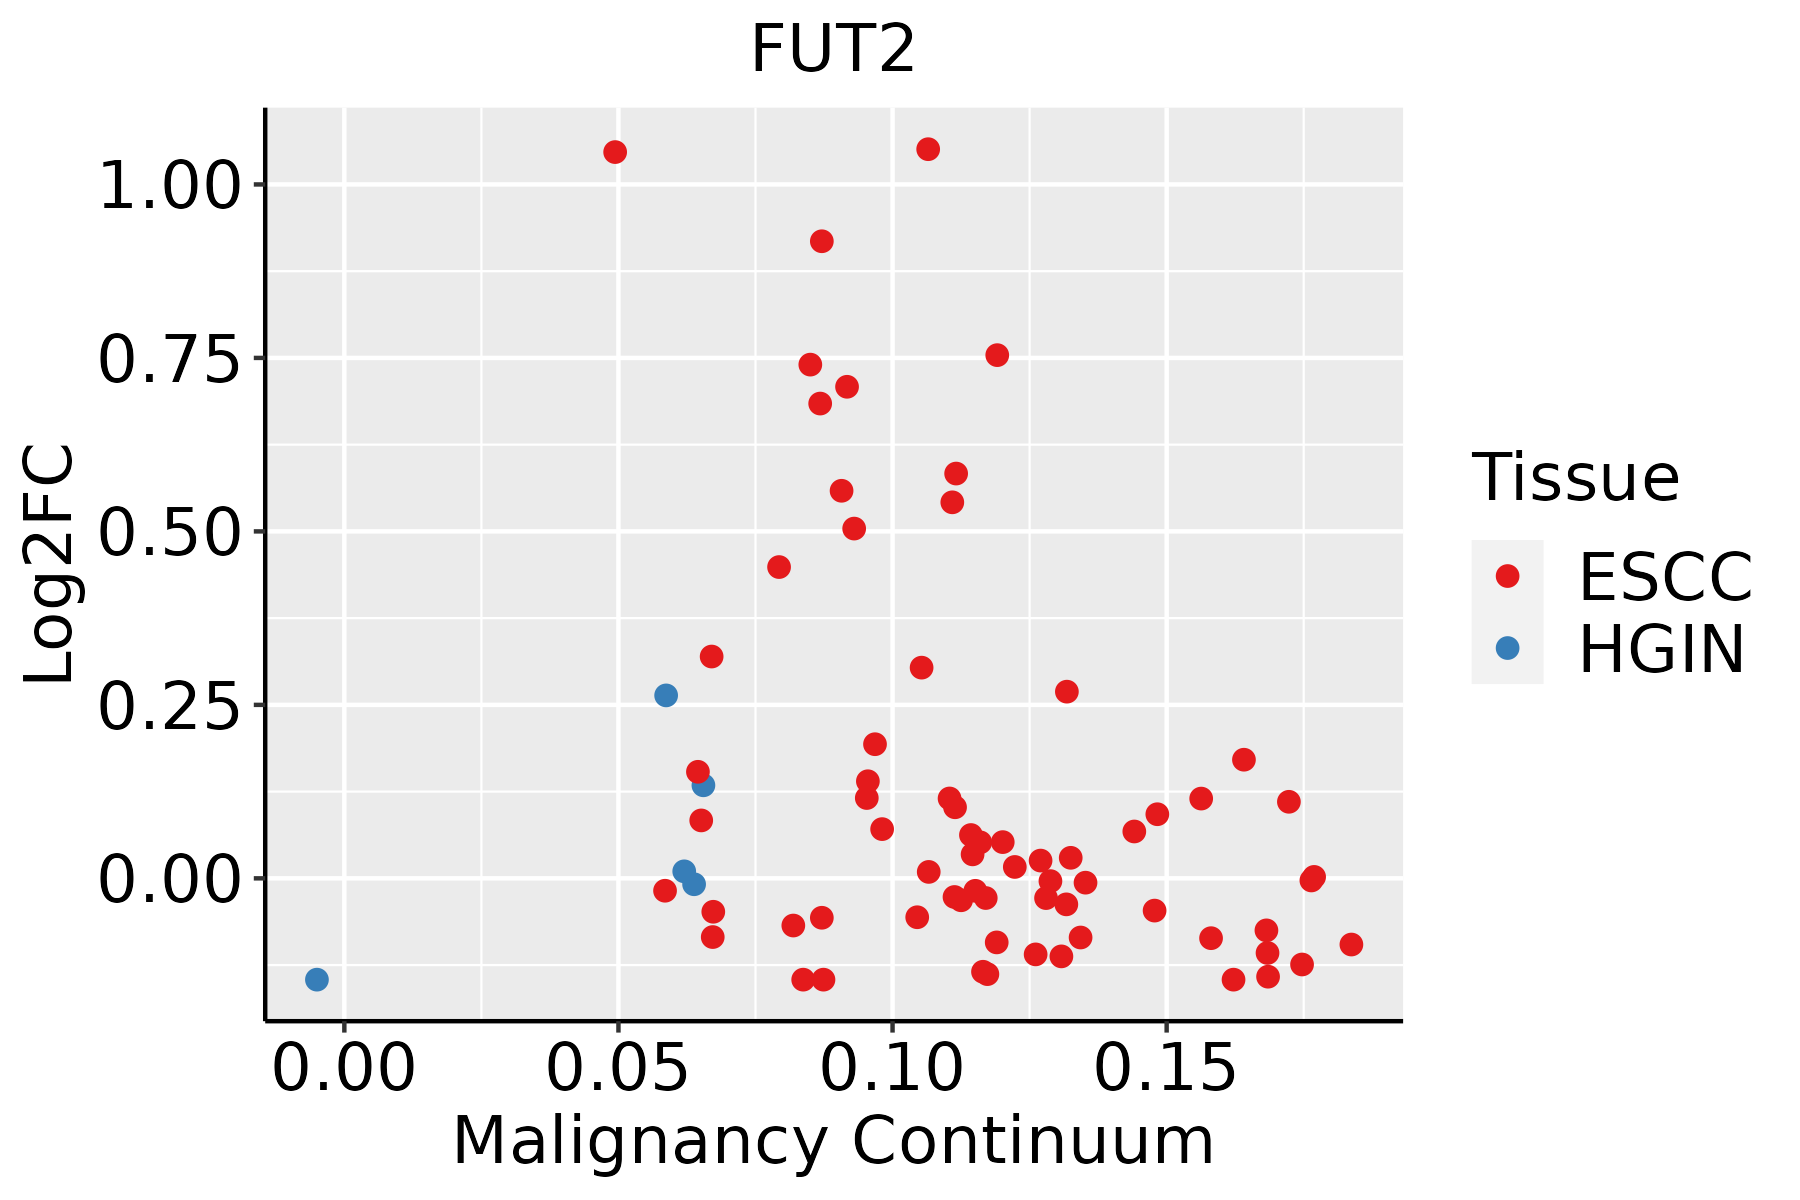 | ESCC: Esophageal squamous cell carcinoma |
| HGIN: High-grade intraepithelial neoplasias | ||
| LGIN: Low-grade intraepithelial neoplasias | ||
| Liver |  | HCC: Hepatocellular carcinoma |
| NAFLD: Non-alcoholic fatty liver disease | ||
| Oral Cavity | 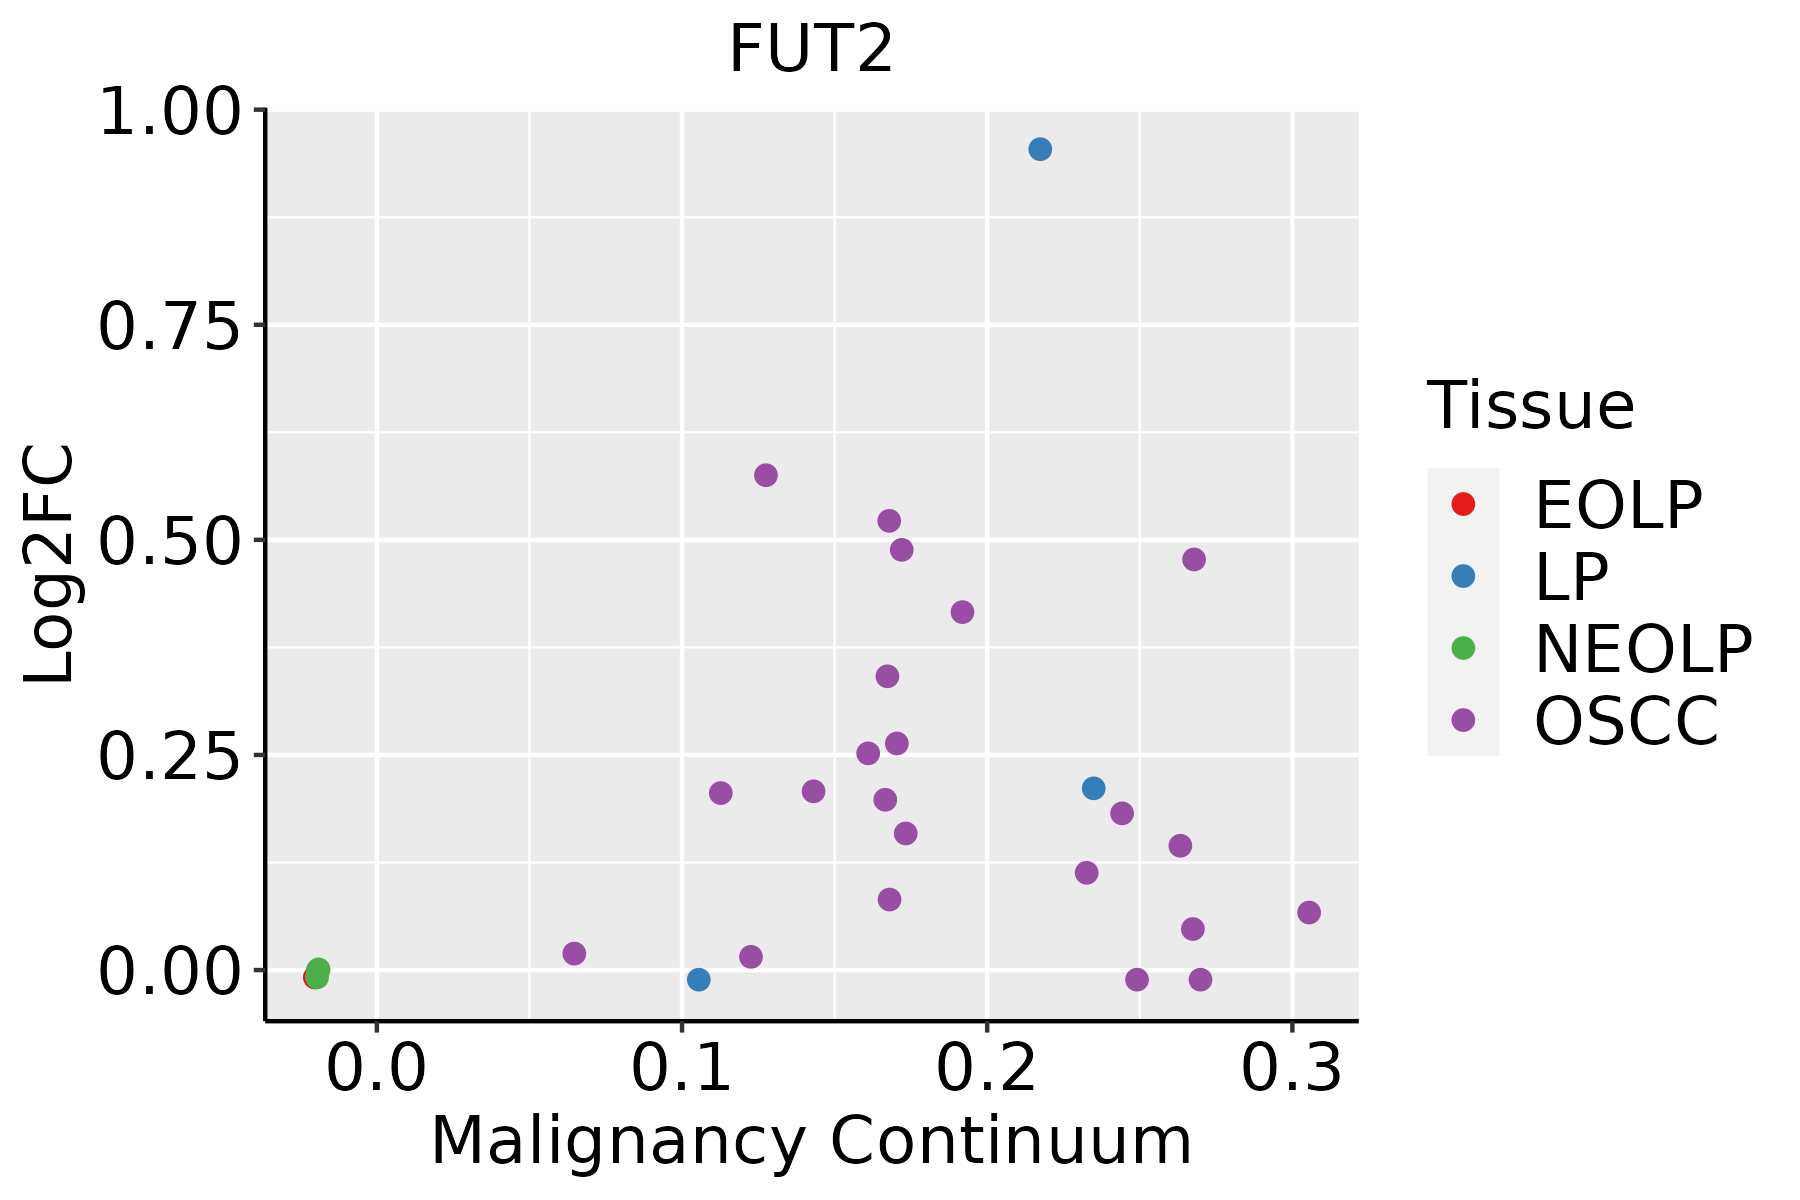 | EOLP: Erosive Oral lichen planus |
| LP: leukoplakia | ||
| NEOLP: Non-erosive oral lichen planus | ||
| OSCC: Oral squamous cell carcinoma |
| ∗log2FC in expression of this searched gene in stem-like cells from each diseased tissue sample relative to stem-like cells in normal samples in each tissue plotted against the malignancy continuum. Samples are colored based on if they are from different disease stage. |
Top |
Malignant transformation related pathway analysis |
| Find out the enriched GO biological processes and KEGG pathways involved in transition from healthy to precancer to cancer |
| Tissue | Disease Stage | Enriched GO biological Processes |
| Colorectum | AD |  |
| Colorectum | SER |  |
| Colorectum | MSS |  |
| Colorectum | MSI-H |  |
| Colorectum | FAP |  |
| ∗Top 15 enriched GO BP terms are showed in the bar plot of each disease state in each tissue. Each row represents a significant GO biological process which is colored according to the -log10(p.adjust). |
| Page: 1 2 3 4 5 6 7 8 9 |
| GO ID | Tissue | Disease Stage | Description | Gene Ratio | Bg Ratio | pvalue | p.adjust | Count |
| GO:0044282 | Colorectum | AD | small molecule catabolic process | 118/3918 | 376/18723 | 1.05e-06 | 3.55e-05 | 118 |
| GO:0016052 | Colorectum | AD | carbohydrate catabolic process | 56/3918 | 154/18723 | 7.01e-06 | 1.73e-04 | 56 |
| GO:0019318 | Colorectum | AD | hexose metabolic process | 77/3918 | 237/18723 | 1.96e-05 | 4.01e-04 | 77 |
| GO:0005996 | Colorectum | AD | monosaccharide metabolic process | 80/3918 | 257/18723 | 7.31e-05 | 1.17e-03 | 80 |
| GO:0050673 | Colorectum | AD | epithelial cell proliferation | 119/3918 | 437/18723 | 8.75e-04 | 8.51e-03 | 119 |
| GO:0006486 | Colorectum | AD | protein glycosylation | 64/3918 | 226/18723 | 4.86e-03 | 3.27e-02 | 64 |
| GO:0043413 | Colorectum | AD | macromolecule glycosylation | 64/3918 | 226/18723 | 4.86e-03 | 3.27e-02 | 64 |
| GO:0070085 | Colorectum | AD | glycosylation | 67/3918 | 240/18723 | 5.78e-03 | 3.67e-02 | 67 |
| GO:0019320 | Colorectum | AD | hexose catabolic process | 14/3918 | 34/18723 | 5.86e-03 | 3.69e-02 | 14 |
| GO:00442821 | Colorectum | SER | small molecule catabolic process | 87/2897 | 376/18723 | 5.31e-05 | 1.27e-03 | 87 |
| GO:00193181 | Colorectum | SER | hexose metabolic process | 56/2897 | 237/18723 | 6.19e-04 | 8.42e-03 | 56 |
| GO:00059961 | Colorectum | SER | monosaccharide metabolic process | 59/2897 | 257/18723 | 9.65e-04 | 1.15e-02 | 59 |
| GO:00160521 | Colorectum | SER | carbohydrate catabolic process | 38/2897 | 154/18723 | 1.92e-03 | 1.93e-02 | 38 |
| GO:00160523 | Colorectum | FAP | carbohydrate catabolic process | 44/2622 | 154/18723 | 1.82e-06 | 7.42e-05 | 44 |
| GO:00193183 | Colorectum | FAP | hexose metabolic process | 58/2622 | 237/18723 | 1.09e-05 | 3.08e-04 | 58 |
| GO:00059963 | Colorectum | FAP | monosaccharide metabolic process | 59/2622 | 257/18723 | 6.79e-05 | 1.28e-03 | 59 |
| GO:00193201 | Colorectum | FAP | hexose catabolic process | 14/2622 | 34/18723 | 9.46e-05 | 1.61e-03 | 14 |
| GO:00442823 | Colorectum | FAP | small molecule catabolic process | 77/2622 | 376/18723 | 3.25e-04 | 4.16e-03 | 77 |
| GO:0046365 | Colorectum | FAP | monosaccharide catabolic process | 14/2622 | 40/18723 | 6.94e-04 | 7.50e-03 | 14 |
| GO:00506732 | Colorectum | FAP | epithelial cell proliferation | 84/2622 | 437/18723 | 1.39e-03 | 1.25e-02 | 84 |
| Page: 1 2 3 4 5 6 |
| Pathway ID | Tissue | Disease Stage | Description | Gene Ratio | Bg Ratio | pvalue | p.adjust | qvalue | Count |
| Page: 1 |
Top |
Cell-cell communication analysis |
| Identification of potential cell-cell interactions between two cell types and their ligand-receptor pairs for different disease states |
| Ligand | Receptor | LRpair | Pathway | Tissue | Disease Stage |
| Page: 1 |
Top |
Single-cell gene regulatory network inference analysis |
| Find out the significant the regulons (TFs) and the target genes of each regulon across cell types for different disease states |
| TF | Cell Type | Tissue | Disease Stage | Target Gene | RSS | Regulon Activity |
| ∗The dot plots of a searched regulon are shown for all cell subpopulations in each disease state of each tissue based on the regulon specific score inferred using pySCENIC and by calculating the average expression. |
| Page: 1 |
Top |
Somatic mutation of malignant transformation related genes |
| Annotation of somatic variants for genes involved in malignant transformation |
| Hugo Symbol | Variant Class | Variant Classification | dbSNP RS | HGVSc | HGVSp | HGVSp Short | SWISSPROT | BIOTYPE | SIFT | PolyPhen | Tumor Sample Barcode | Tissue | Histology | Sex | Age | Stage | Therapy Types | Drugs | Outcome |
| FUT2 | SNV | Missense_Mutation | novel | c.976N>A | p.Phe326Ile | p.F326I | Q10981 | protein_coding | deleterious(0) | probably_damaging(0.932) | TCGA-AN-A046-01 | Breast | breast invasive carcinoma | Female | >=65 | I/II | Unknown | Unknown | SD |
| FUT2 | SNV | Missense_Mutation | rs756430917 | c.125C>T | p.Pro42Leu | p.P42L | Q10981 | protein_coding | deleterious_low_confidence(0.05) | benign(0.053) | TCGA-AO-A128-01 | Breast | breast invasive carcinoma | Female | <65 | I/II | Chemotherapy | doxorubicin | SD |
| FUT2 | SNV | Missense_Mutation | rs761263000 | c.97G>A | p.Ala33Thr | p.A33T | Q10981 | protein_coding | tolerated_low_confidence(0.14) | benign(0.044) | TCGA-AR-A1AY-01 | Breast | breast invasive carcinoma | Female | >=65 | I/II | Unspecific | Doxorubicin | SD |
| FUT2 | SNV | Missense_Mutation | novel | c.395N>C | p.Trp132Ser | p.W132S | Q10981 | protein_coding | deleterious(0) | probably_damaging(0.971) | TCGA-BH-A1EV-01 | Breast | breast invasive carcinoma | Female | <65 | III/IV | Unknown | Unknown | PD |
| FUT2 | insertion | In_Frame_Ins | novel | c.843_844insGGCCAGGTGGACAATTTCCCTTCA | p.Cys281_Asn282insGlyGlnValAspAsnPheProSer | p.C281_N282insGQVDNFPS | Q10981 | protein_coding | TCGA-A8-A09I-01 | Breast | breast invasive carcinoma | Female | >=65 | I/II | Hormone Therapy | anastrozole | SD | ||
| FUT2 | SNV | Missense_Mutation | c.537N>T | p.Gln179His | p.Q179H | Q10981 | protein_coding | deleterious(0) | probably_damaging(0.999) | TCGA-MY-A5BD-01 | Cervix | cervical & endocervical cancer | Female | <65 | I/II | Chemotherapy | cisplatin | CR | |
| FUT2 | SNV | Missense_Mutation | c.634N>A | p.Val212Met | p.V212M | Q10981 | protein_coding | tolerated(0.18) | benign(0.238) | TCGA-A6-6781-01 | Colorectum | colon adenocarcinoma | Male | <65 | III/IV | Chemotherapy | oxaliplatin | SD | |
| FUT2 | SNV | Missense_Mutation | c.239N>A | p.Ala80Asp | p.A80D | Q10981 | protein_coding | deleterious(0) | probably_damaging(1) | TCGA-AA-3715-01 | Colorectum | colon adenocarcinoma | Male | >=65 | I/II | Unknown | Unknown | PD | |
| FUT2 | SNV | Missense_Mutation | c.290N>A | p.Ala97Asp | p.A97D | Q10981 | protein_coding | deleterious(0.02) | possibly_damaging(0.529) | TCGA-AA-3841-01 | Colorectum | colon adenocarcinoma | Male | >=65 | I/II | Chemotherapy | folinic | CR | |
| FUT2 | SNV | Missense_Mutation | rs760999180 | c.353C>T | p.Thr118Met | p.T118M | Q10981 | protein_coding | tolerated(0.17) | benign(0.179) | TCGA-AD-6895-01 | Colorectum | colon adenocarcinoma | Male | >=65 | III/IV | Unknown | Unknown | SD |
| Page: 1 2 3 4 |
Top |
Related drugs of malignant transformation related genes |
| Identification of chemicals and drugs interact with genes involved in malignant transfromation |
| (DGIdb 4.0) |
| Entrez ID | Symbol | Category | Interaction Types | Drug Claim Name | Drug Name | PMIDs |
| 2524 | FUT2 | DRUGGABLE GENOME, ENZYME | ethanol | ALCOHOL | 32451486 |
| Page: 1 |

Copyright 2023-Present -The University of Texas Health Science Center at Houston |