
|
|||||
|
 | |
| |
| |
| |
| |
| |
|
Gene: FURIN |
Gene summary for FURIN |
| Gene information | Species | Human | Gene symbol | FURIN | Gene ID | 5045 |
| Gene name | furin, paired basic amino acid cleaving enzyme | |
| Gene Alias | FUR | |
| Cytomap | 15q26.1 | |
| Gene Type | protein-coding | GO ID | GO:0001701 | UniProtAcc | A0A024RC70 |
Top |
Malignant transformation analysis |
| Identification of the aberrant gene expression in precancerous and cancerous lesions by comparing the gene expression of stem-like cells in diseased tissues with normal stem cells |
| Entrez ID | Symbol | Replicates | Species | Organ | Tissue | Adj P-value | Log2FC | Malignancy |
| 5045 | FURIN | HTA11_2487_2000001011 | Human | Colorectum | SER | 6.63e-11 | 4.52e-01 | -0.1808 |
| 5045 | FURIN | HTA11_1938_2000001011 | Human | Colorectum | AD | 4.54e-05 | 2.90e-01 | -0.0811 |
| 5045 | FURIN | HTA11_78_2000001011 | Human | Colorectum | AD | 6.61e-03 | 1.81e-01 | -0.1088 |
| 5045 | FURIN | HTA11_347_2000001011 | Human | Colorectum | AD | 3.33e-07 | 2.60e-01 | -0.1954 |
| 5045 | FURIN | HTA11_411_2000001011 | Human | Colorectum | SER | 2.46e-05 | 7.34e-01 | -0.2602 |
| 5045 | FURIN | HTA11_2112_2000001011 | Human | Colorectum | SER | 3.89e-03 | 3.85e-01 | -0.2196 |
| 5045 | FURIN | HTA11_3361_2000001011 | Human | Colorectum | AD | 3.31e-03 | 2.38e-01 | -0.1207 |
| 5045 | FURIN | HTA11_696_2000001011 | Human | Colorectum | AD | 5.44e-11 | 3.32e-01 | -0.1464 |
| 5045 | FURIN | HTA11_866_2000001011 | Human | Colorectum | AD | 6.39e-03 | 1.45e-01 | -0.1001 |
| 5045 | FURIN | HTA11_1391_2000001011 | Human | Colorectum | AD | 4.44e-08 | 2.81e-01 | -0.059 |
| 5045 | FURIN | HTA11_2992_2000001011 | Human | Colorectum | SER | 4.33e-02 | 2.71e-01 | -0.1706 |
| 5045 | FURIN | HTA11_7696_3000711011 | Human | Colorectum | AD | 1.53e-02 | 9.36e-02 | 0.0674 |
| 5045 | FURIN | HTA11_99999965104_69814 | Human | Colorectum | MSS | 7.33e-03 | 1.63e-01 | 0.281 |
| 5045 | FURIN | HTA11_99999971662_82457 | Human | Colorectum | MSS | 7.70e-11 | 1.63e-01 | 0.3859 |
| 5045 | FURIN | HTA11_99999974143_84620 | Human | Colorectum | MSS | 1.11e-04 | 1.78e-01 | 0.3005 |
| 5045 | FURIN | LZE7T | Human | Esophagus | ESCC | 8.00e-05 | 3.65e-01 | 0.0667 |
| 5045 | FURIN | P2T-E | Human | Esophagus | ESCC | 1.86e-06 | 9.29e-03 | 0.1177 |
| 5045 | FURIN | P4T-E | Human | Esophagus | ESCC | 4.84e-03 | -3.37e-02 | 0.1323 |
| 5045 | FURIN | P5T-E | Human | Esophagus | ESCC | 1.25e-10 | 5.34e-02 | 0.1327 |
| 5045 | FURIN | P8T-E | Human | Esophagus | ESCC | 8.60e-15 | 1.59e-01 | 0.0889 |
| Page: 1 2 3 4 5 6 |
| Tissue | Expression Dynamics | Abbreviation |
| Colorectum (GSE201348) |  | FAP: Familial adenomatous polyposis |
| CRC: Colorectal cancer | ||
| Colorectum (HTA11) |  | AD: Adenomas |
| SER: Sessile serrated lesions | ||
| MSI-H: Microsatellite-high colorectal cancer | ||
| MSS: Microsatellite stable colorectal cancer | ||
| Esophagus | 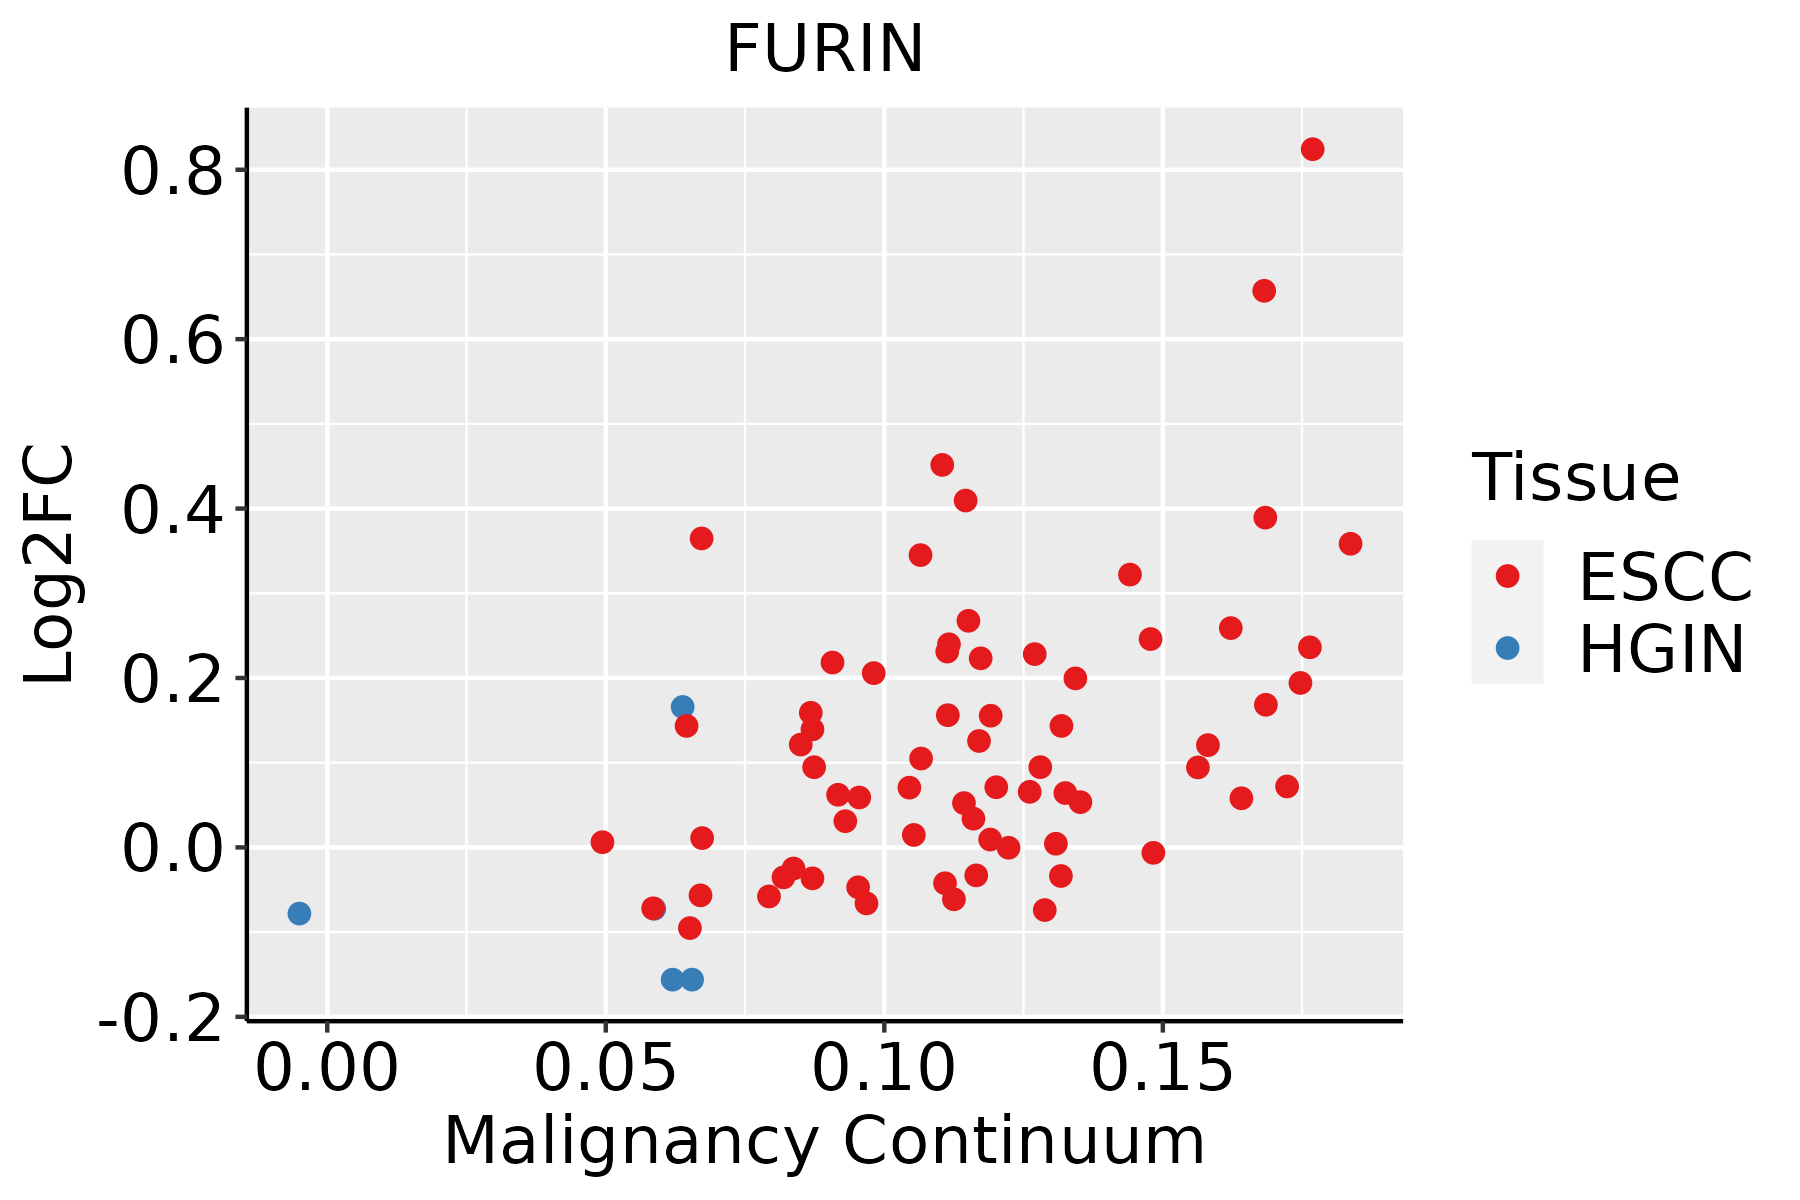 | ESCC: Esophageal squamous cell carcinoma |
| HGIN: High-grade intraepithelial neoplasias | ||
| LGIN: Low-grade intraepithelial neoplasias | ||
| Liver | 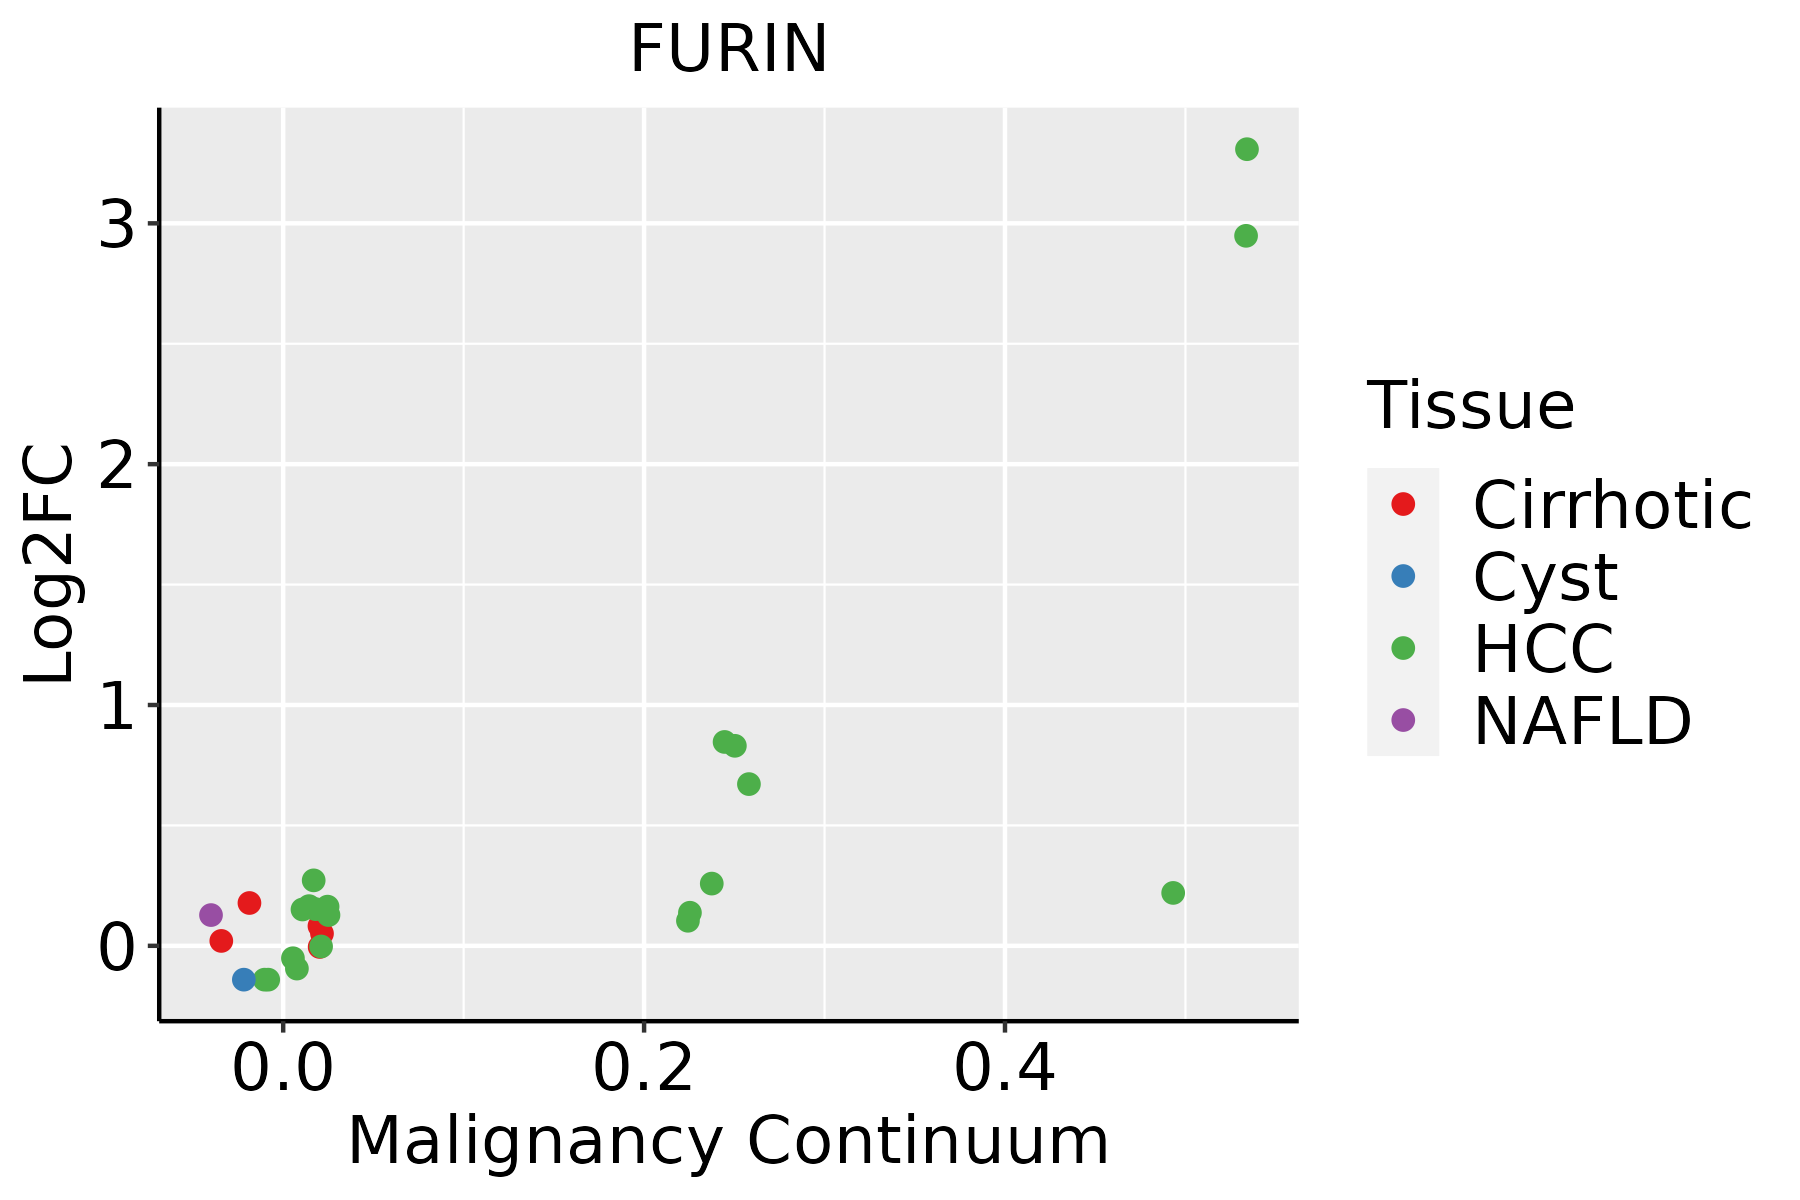 | HCC: Hepatocellular carcinoma |
| NAFLD: Non-alcoholic fatty liver disease | ||
| Oral Cavity | 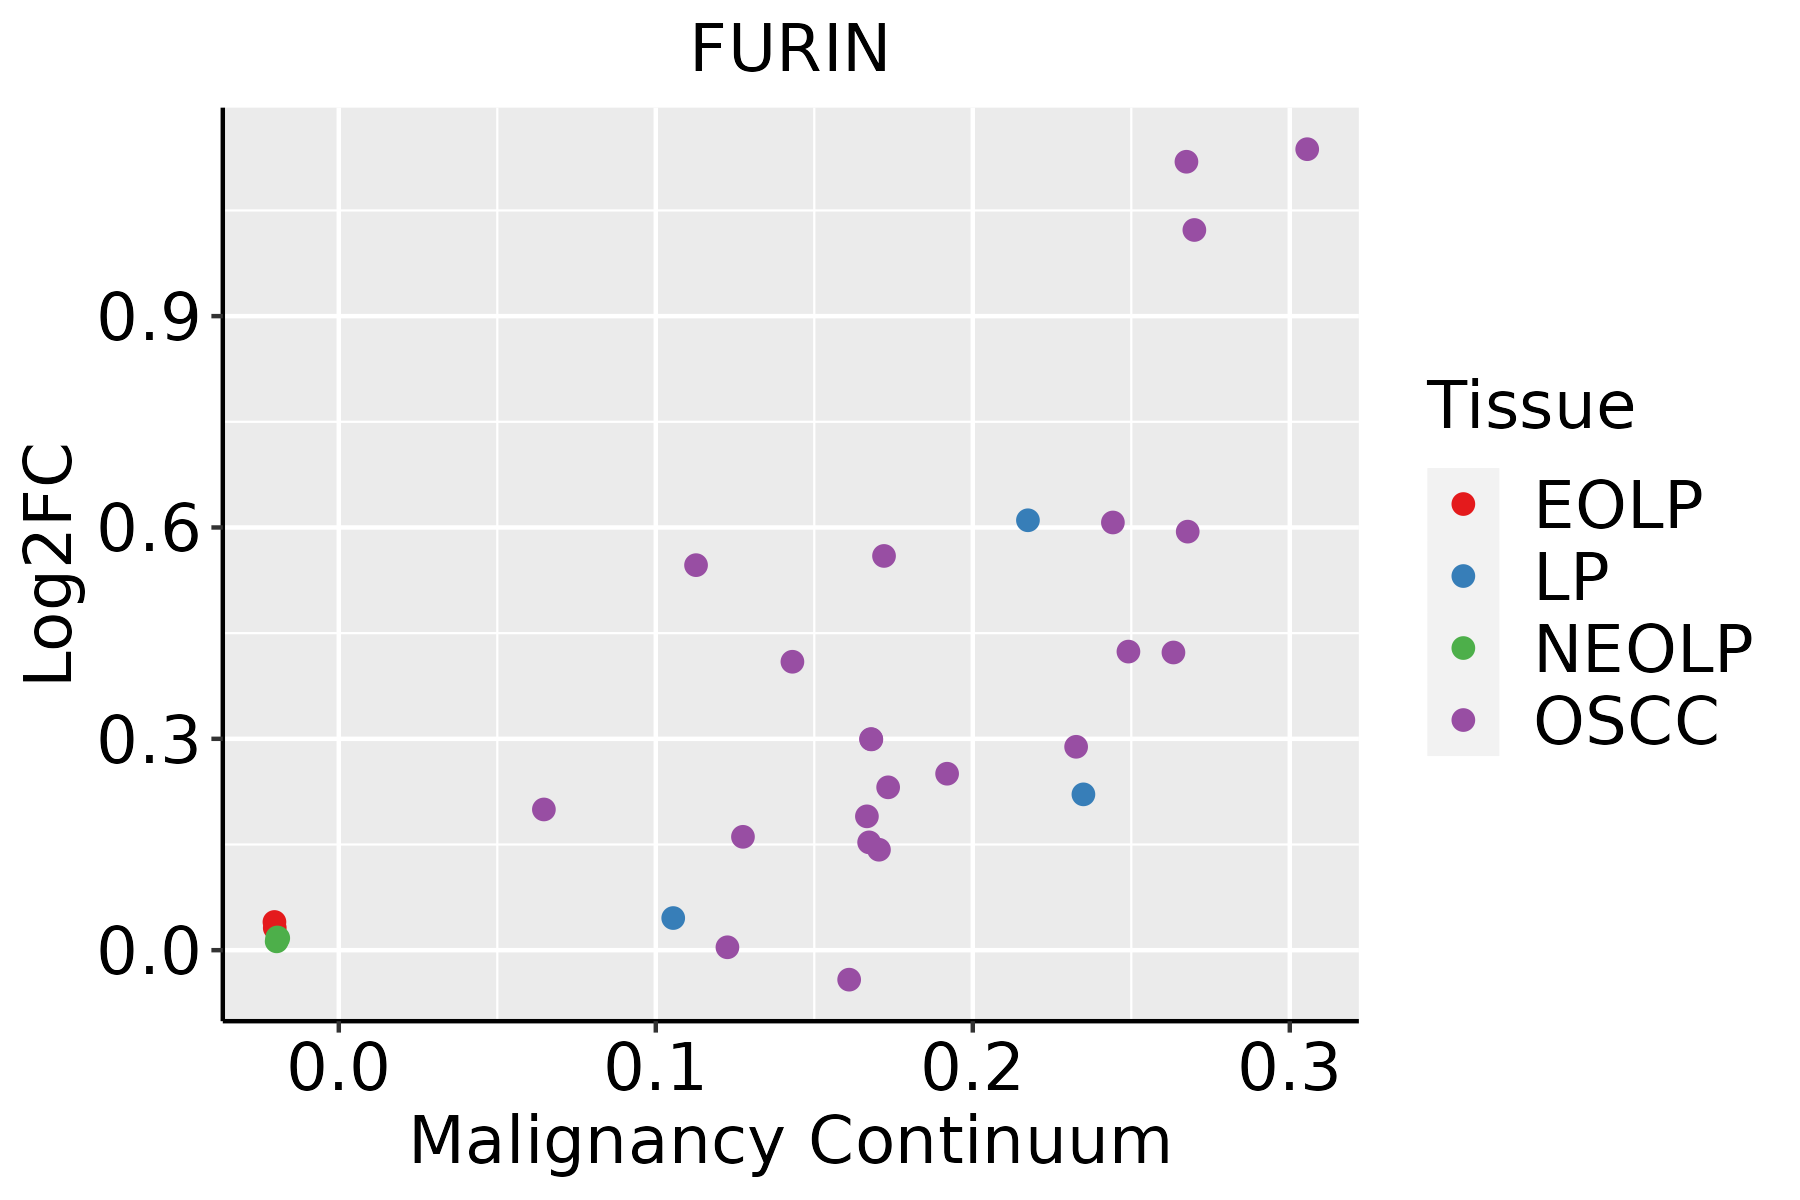 | EOLP: Erosive Oral lichen planus |
| LP: leukoplakia | ||
| NEOLP: Non-erosive oral lichen planus | ||
| OSCC: Oral squamous cell carcinoma | ||
| Skin | 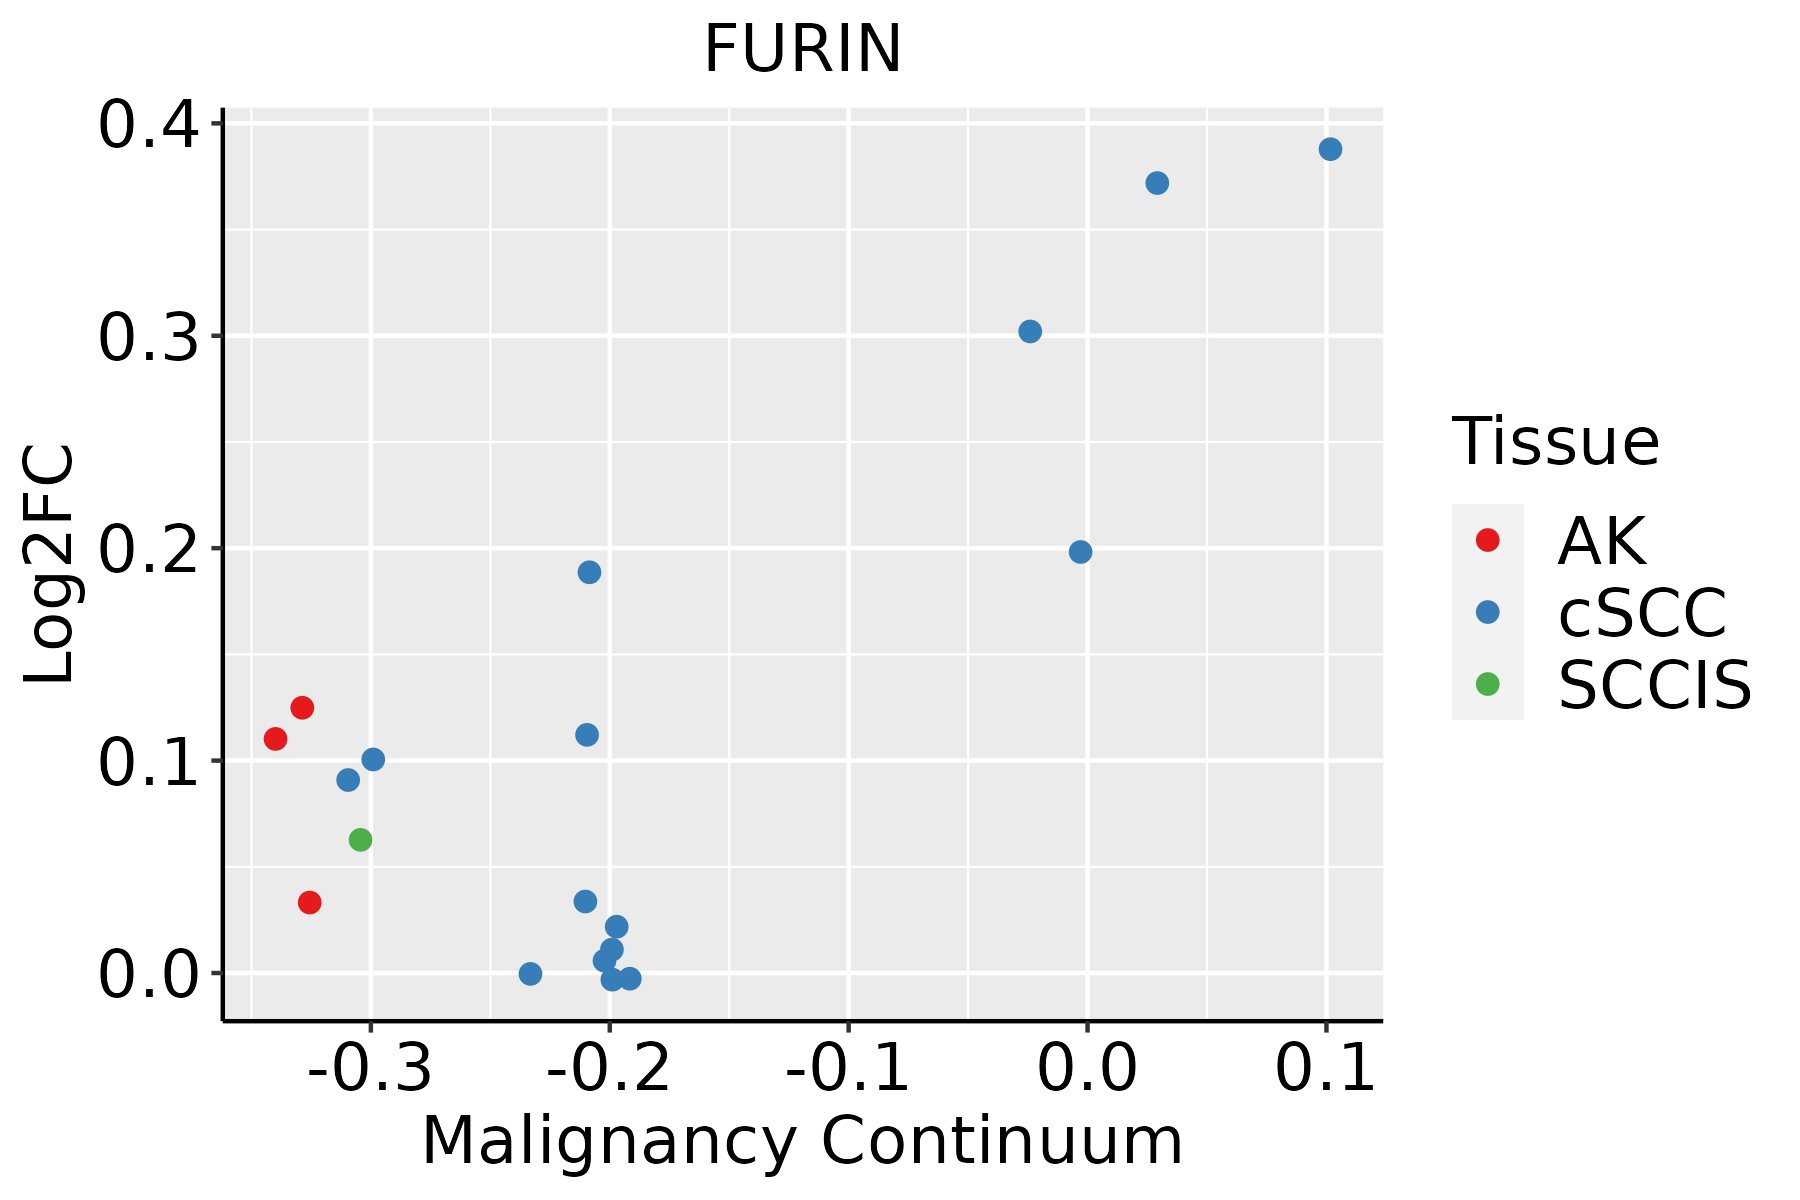 | AK: Actinic keratosis |
| cSCC: Cutaneous squamous cell carcinoma | ||
| SCCIS:squamous cell carcinoma in situ | ||
| Thyroid | 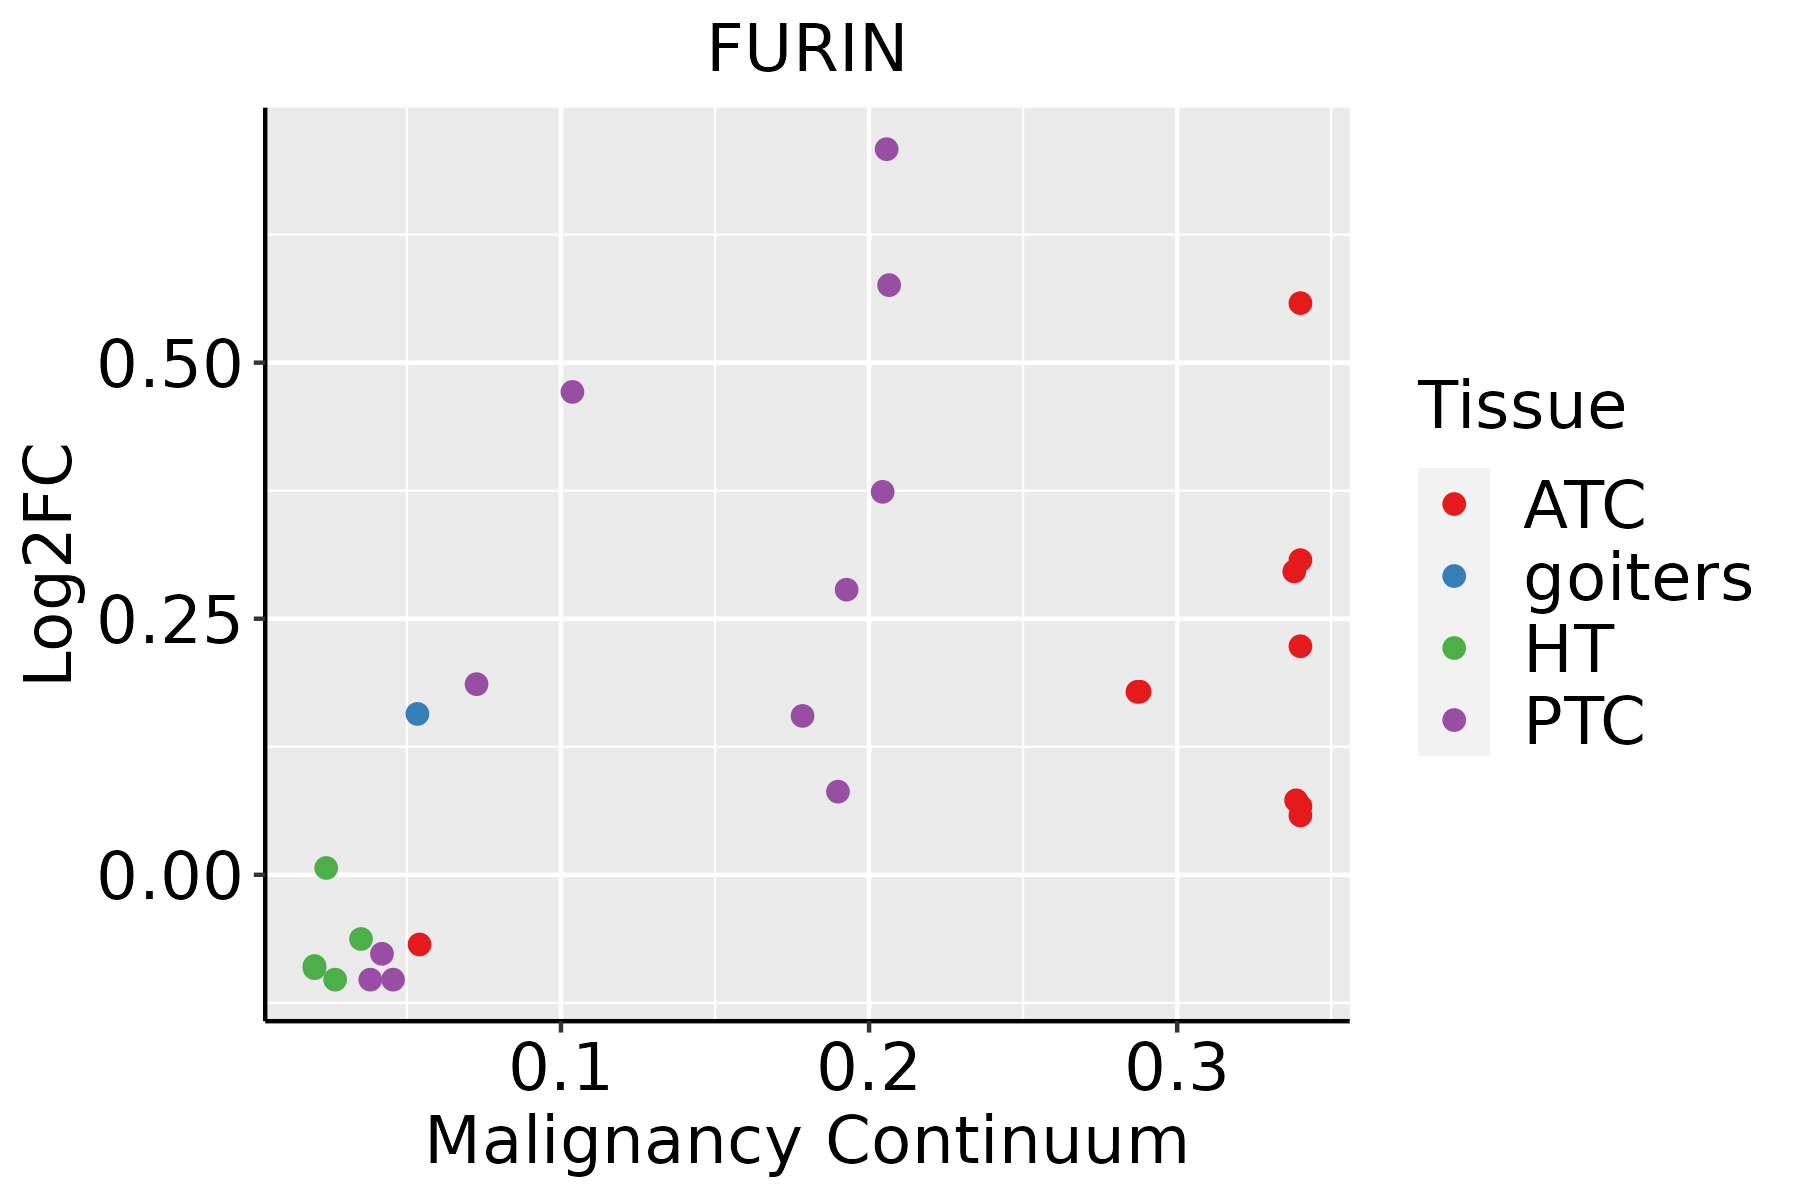 | ATC: Anaplastic thyroid cancer |
| HT: Hashimoto's thyroiditis | ||
| PTC: Papillary thyroid cancer |
| ∗log2FC in expression of this searched gene in stem-like cells from each diseased tissue sample relative to stem-like cells in normal samples in each tissue plotted against the malignancy continuum. Samples are colored based on if they are from different disease stage. |
Top |
Malignant transformation related pathway analysis |
| Find out the enriched GO biological processes and KEGG pathways involved in transition from healthy to precancer to cancer |
| Tissue | Disease Stage | Enriched GO biological Processes |
| Colorectum | AD |  |
| Colorectum | SER |  |
| Colorectum | MSS |  |
| Colorectum | MSI-H |  |
| Colorectum | FAP |  |
| ∗Top 15 enriched GO BP terms are showed in the bar plot of each disease state in each tissue. Each row represents a significant GO biological process which is colored according to the -log10(p.adjust). |
| Page: 1 2 3 4 5 6 7 8 9 |
| GO ID | Tissue | Disease Stage | Description | Gene Ratio | Bg Ratio | pvalue | p.adjust | Count |
| GO:0016032 | Colorectum | AD | viral process | 168/3918 | 415/18723 | 4.67e-20 | 3.66e-17 | 168 |
| GO:0042176 | Colorectum | AD | regulation of protein catabolic process | 160/3918 | 391/18723 | 1.06e-19 | 7.34e-17 | 160 |
| GO:0009896 | Colorectum | AD | positive regulation of catabolic process | 180/3918 | 492/18723 | 4.33e-16 | 1.94e-13 | 180 |
| GO:1903362 | Colorectum | AD | regulation of cellular protein catabolic process | 109/3918 | 255/18723 | 2.14e-15 | 6.08e-13 | 109 |
| GO:0031331 | Colorectum | AD | positive regulation of cellular catabolic process | 156/3918 | 427/18723 | 4.68e-14 | 1.05e-11 | 156 |
| GO:0009895 | Colorectum | AD | negative regulation of catabolic process | 124/3918 | 320/18723 | 1.66e-13 | 3.35e-11 | 124 |
| GO:0031330 | Colorectum | AD | negative regulation of cellular catabolic process | 104/3918 | 262/18723 | 2.66e-12 | 3.96e-10 | 104 |
| GO:0019058 | Colorectum | AD | viral life cycle | 119/3918 | 317/18723 | 6.18e-12 | 8.23e-10 | 119 |
| GO:0045732 | Colorectum | AD | positive regulation of protein catabolic process | 92/3918 | 231/18723 | 3.85e-11 | 4.47e-09 | 92 |
| GO:0045862 | Colorectum | AD | positive regulation of proteolysis | 129/3918 | 372/18723 | 4.04e-10 | 3.46e-08 | 129 |
| GO:0022411 | Colorectum | AD | cellular component disassembly | 147/3918 | 443/18723 | 8.53e-10 | 6.76e-08 | 147 |
| GO:0042177 | Colorectum | AD | negative regulation of protein catabolic process | 55/3918 | 121/18723 | 1.19e-09 | 8.85e-08 | 55 |
| GO:1903363 | Colorectum | AD | negative regulation of cellular protein catabolic process | 39/3918 | 75/18723 | 2.69e-09 | 1.87e-07 | 39 |
| GO:0019080 | Colorectum | AD | viral gene expression | 42/3918 | 94/18723 | 1.90e-07 | 8.02e-06 | 42 |
| GO:0043112 | Colorectum | AD | receptor metabolic process | 62/3918 | 166/18723 | 8.18e-07 | 2.85e-05 | 62 |
| GO:0052547 | Colorectum | AD | regulation of peptidase activity | 137/3918 | 461/18723 | 4.12e-06 | 1.12e-04 | 137 |
| GO:0019082 | Colorectum | AD | viral protein processing | 17/3918 | 29/18723 | 1.04e-05 | 2.40e-04 | 17 |
| GO:0045861 | Colorectum | AD | negative regulation of proteolysis | 106/3918 | 351/18723 | 2.33e-05 | 4.57e-04 | 106 |
| GO:0001701 | Colorectum | AD | in utero embryonic development | 110/3918 | 367/18723 | 2.36e-05 | 4.62e-04 | 110 |
| GO:0052548 | Colorectum | AD | regulation of endopeptidase activity | 124/3918 | 432/18723 | 6.58e-05 | 1.07e-03 | 124 |
| Page: 1 2 3 4 5 6 7 8 9 10 11 12 13 14 15 16 17 18 19 20 21 22 |
| Pathway ID | Tissue | Disease Stage | Description | Gene Ratio | Bg Ratio | pvalue | p.adjust | qvalue | Count |
| hsa03250 | Colorectum | MSS | Viral life cycle - HIV-1 | 23/1875 | 63/8465 | 6.55e-03 | 2.64e-02 | 1.62e-02 | 23 |
| hsa032501 | Colorectum | MSS | Viral life cycle - HIV-1 | 23/1875 | 63/8465 | 6.55e-03 | 2.64e-02 | 1.62e-02 | 23 |
| hsa032509 | Esophagus | ESCC | Viral life cycle - HIV-1 | 54/4205 | 63/8465 | 2.01e-09 | 2.17e-08 | 1.11e-08 | 54 |
| hsa0325014 | Esophagus | ESCC | Viral life cycle - HIV-1 | 54/4205 | 63/8465 | 2.01e-09 | 2.17e-08 | 1.11e-08 | 54 |
| hsa032502 | Liver | HCC | Viral life cycle - HIV-1 | 46/4020 | 63/8465 | 3.25e-05 | 1.88e-04 | 1.04e-04 | 46 |
| hsa0325011 | Liver | HCC | Viral life cycle - HIV-1 | 46/4020 | 63/8465 | 3.25e-05 | 1.88e-04 | 1.04e-04 | 46 |
| hsa032508 | Oral cavity | OSCC | Viral life cycle - HIV-1 | 45/3704 | 63/8465 | 7.62e-06 | 3.59e-05 | 1.83e-05 | 45 |
| hsa0325013 | Oral cavity | OSCC | Viral life cycle - HIV-1 | 45/3704 | 63/8465 | 7.62e-06 | 3.59e-05 | 1.83e-05 | 45 |
| hsa0325022 | Oral cavity | LP | Viral life cycle - HIV-1 | 32/2418 | 63/8465 | 1.55e-04 | 9.08e-04 | 5.86e-04 | 32 |
| hsa0325031 | Oral cavity | LP | Viral life cycle - HIV-1 | 32/2418 | 63/8465 | 1.55e-04 | 9.08e-04 | 5.86e-04 | 32 |
| Page: 1 |
Top |
Cell-cell communication analysis |
| Identification of potential cell-cell interactions between two cell types and their ligand-receptor pairs for different disease states |
| Ligand | Receptor | LRpair | Pathway | Tissue | Disease Stage |
| Page: 1 |
Top |
Single-cell gene regulatory network inference analysis |
| Find out the significant the regulons (TFs) and the target genes of each regulon across cell types for different disease states |
| TF | Cell Type | Tissue | Disease Stage | Target Gene | RSS | Regulon Activity |
| ∗The dot plots of a searched regulon are shown for all cell subpopulations in each disease state of each tissue based on the regulon specific score inferred using pySCENIC and by calculating the average expression. |
| Page: 1 |
Top |
Somatic mutation of malignant transformation related genes |
| Annotation of somatic variants for genes involved in malignant transformation |
| Hugo Symbol | Variant Class | Variant Classification | dbSNP RS | HGVSc | HGVSp | HGVSp Short | SWISSPROT | BIOTYPE | SIFT | PolyPhen | Tumor Sample Barcode | Tissue | Histology | Sex | Age | Stage | Therapy Types | Drugs | Outcome |
| FURIN | SNV | Missense_Mutation | novel | c.2167N>T | p.Ala723Ser | p.A723S | P09958 | protein_coding | tolerated(0.14) | benign(0.247) | TCGA-A2-A04R-01 | Breast | breast invasive carcinoma | Female | <65 | I/II | Chemotherapy | taxol | SD |
| FURIN | SNV | Missense_Mutation | novel | c.1492C>A | p.Arg498Ser | p.R498S | P09958 | protein_coding | deleterious(0) | probably_damaging(1) | TCGA-A2-A1FW-01 | Breast | breast invasive carcinoma | Female | <65 | III/IV | Chemotherapy | cytoxan | SD |
| FURIN | SNV | Missense_Mutation | c.356N>A | p.Pro119His | p.P119H | P09958 | protein_coding | tolerated(0.25) | possibly_damaging(0.572) | TCGA-AO-A128-01 | Breast | breast invasive carcinoma | Female | <65 | I/II | Chemotherapy | doxorubicin | SD | |
| FURIN | SNV | Missense_Mutation | novel | c.1956N>C | p.Gln652His | p.Q652H | P09958 | protein_coding | tolerated(0.42) | benign(0.005) | TCGA-B6-A40B-01 | Breast | breast invasive carcinoma | Female | >=65 | I/II | Unknown | Unknown | SD |
| FURIN | SNV | Missense_Mutation | c.1874N>T | p.Thr625Met | p.T625M | P09958 | protein_coding | tolerated(0.22) | benign(0.02) | TCGA-BH-A0BP-01 | Breast | breast invasive carcinoma | Female | >=65 | I/II | Unknown | Unknown | SD | |
| FURIN | SNV | Missense_Mutation | novel | c.245C>A | p.Pro82Gln | p.P82Q | P09958 | protein_coding | deleterious(0.02) | benign(0.027) | TCGA-OL-A6VR-01 | Breast | breast invasive carcinoma | Female | <65 | I/II | Unknown | Unknown | SD |
| FURIN | insertion | Frame_Shift_Ins | novel | c.547dupC | p.Gln183ProfsTer9 | p.Q183Pfs*9 | P09958 | protein_coding | TCGA-D8-A1XQ-01 | Breast | breast invasive carcinoma | Female | >=65 | I/II | Unknown | Unknown | SD | ||
| FURIN | SNV | Missense_Mutation | novel | c.158N>A | p.Gly53Glu | p.G53E | P09958 | protein_coding | deleterious(0) | probably_damaging(0.932) | TCGA-2W-A8YY-01 | Cervix | cervical & endocervical cancer | Female | <65 | I/II | Chemotherapy | cisplatin | CR |
| FURIN | SNV | Missense_Mutation | novel | c.958N>A | p.Ala320Thr | p.A320T | P09958 | protein_coding | tolerated(1) | benign(0.05) | TCGA-2W-A8YY-01 | Cervix | cervical & endocervical cancer | Female | <65 | I/II | Chemotherapy | cisplatin | CR |
| FURIN | SNV | Missense_Mutation | novel | c.2167N>A | p.Ala723Thr | p.A723T | P09958 | protein_coding | tolerated(0.16) | benign(0.089) | TCGA-2W-A8YY-01 | Cervix | cervical & endocervical cancer | Female | <65 | I/II | Chemotherapy | cisplatin | CR |
| Page: 1 2 3 4 5 6 7 8 9 |
Top |
Related drugs of malignant transformation related genes |
| Identification of chemicals and drugs interact with genes involved in malignant transfromation |
| (DGIdb 4.0) |
| Entrez ID | Symbol | Category | Interaction Types | Drug Claim Name | Drug Name | PMIDs |
| 5045 | FURIN | ENZYME, PROTEASE, CELL SURFACE, DRUGGABLE GENOME | inhibitor | 252166802 | ||
| 5045 | FURIN | ENZYME, PROTEASE, CELL SURFACE, DRUGGABLE GENOME | US9266828, E | |||
| 5045 | FURIN | ENZYME, PROTEASE, CELL SURFACE, DRUGGABLE GENOME | inhibitor | 178103178 | ||
| 5045 | FURIN | ENZYME, PROTEASE, CELL SURFACE, DRUGGABLE GENOME | US9266828, B | |||
| 5045 | FURIN | ENZYME, PROTEASE, CELL SURFACE, DRUGGABLE GENOME | inhibitor | 252166868 | ||
| 5045 | FURIN | ENZYME, PROTEASE, CELL SURFACE, DRUGGABLE GENOME | US9266828, C | |||
| 5045 | FURIN | ENZYME, PROTEASE, CELL SURFACE, DRUGGABLE GENOME | inhibitor | 252166858 |
| Page: 1 |

Copyright 2023-Present -The University of Texas Health Science Center at Houston |