
|
|||||
|
 | |
| |
| |
| |
| |
| |
|
Gene: FUOM |
Gene summary for FUOM |
| Gene information | Species | Human | Gene symbol | FUOM | Gene ID | 282969 |
| Gene name | fucose mutarotase | |
| Gene Alias | C10orf125 | |
| Cytomap | 10q26.3 | |
| Gene Type | protein-coding | GO ID | GO:0005975 | UniProtAcc | A2VDF0 |
Top |
Malignant transformation analysis |
| Identification of the aberrant gene expression in precancerous and cancerous lesions by comparing the gene expression of stem-like cells in diseased tissues with normal stem cells |
| Entrez ID | Symbol | Replicates | Species | Organ | Tissue | Adj P-value | Log2FC | Malignancy |
| 282969 | FUOM | LZE4T | Human | Esophagus | ESCC | 3.07e-02 | 1.40e-01 | 0.0811 |
| 282969 | FUOM | LZE5T | Human | Esophagus | ESCC | 1.37e-02 | 2.65e-01 | 0.0514 |
| 282969 | FUOM | LZE8T | Human | Esophagus | ESCC | 2.18e-04 | 2.12e-01 | 0.067 |
| 282969 | FUOM | LZE24T | Human | Esophagus | ESCC | 5.35e-08 | 2.93e-01 | 0.0596 |
| 282969 | FUOM | LZE6T | Human | Esophagus | ESCC | 2.12e-03 | 1.93e-01 | 0.0845 |
| 282969 | FUOM | P2T-E | Human | Esophagus | ESCC | 6.30e-26 | 4.83e-01 | 0.1177 |
| 282969 | FUOM | P4T-E | Human | Esophagus | ESCC | 3.60e-27 | 6.67e-01 | 0.1323 |
| 282969 | FUOM | P5T-E | Human | Esophagus | ESCC | 8.95e-47 | 9.36e-01 | 0.1327 |
| 282969 | FUOM | P8T-E | Human | Esophagus | ESCC | 5.66e-06 | 1.04e-01 | 0.0889 |
| 282969 | FUOM | P9T-E | Human | Esophagus | ESCC | 3.41e-07 | 2.23e-01 | 0.1131 |
| 282969 | FUOM | P10T-E | Human | Esophagus | ESCC | 1.46e-04 | 1.13e-01 | 0.116 |
| 282969 | FUOM | P11T-E | Human | Esophagus | ESCC | 1.34e-11 | 4.72e-01 | 0.1426 |
| 282969 | FUOM | P12T-E | Human | Esophagus | ESCC | 1.66e-27 | 6.55e-01 | 0.1122 |
| 282969 | FUOM | P15T-E | Human | Esophagus | ESCC | 2.58e-11 | 3.33e-01 | 0.1149 |
| 282969 | FUOM | P16T-E | Human | Esophagus | ESCC | 7.67e-37 | 8.21e-01 | 0.1153 |
| 282969 | FUOM | P17T-E | Human | Esophagus | ESCC | 8.19e-15 | 5.17e-01 | 0.1278 |
| 282969 | FUOM | P19T-E | Human | Esophagus | ESCC | 4.30e-16 | 1.11e+00 | 0.1662 |
| 282969 | FUOM | P20T-E | Human | Esophagus | ESCC | 4.88e-04 | 1.35e-01 | 0.1124 |
| 282969 | FUOM | P21T-E | Human | Esophagus | ESCC | 1.60e-44 | 9.03e-01 | 0.1617 |
| 282969 | FUOM | P22T-E | Human | Esophagus | ESCC | 3.34e-12 | 2.97e-01 | 0.1236 |
| Page: 1 2 3 4 5 6 |
| Tissue | Expression Dynamics | Abbreviation |
| Esophagus | 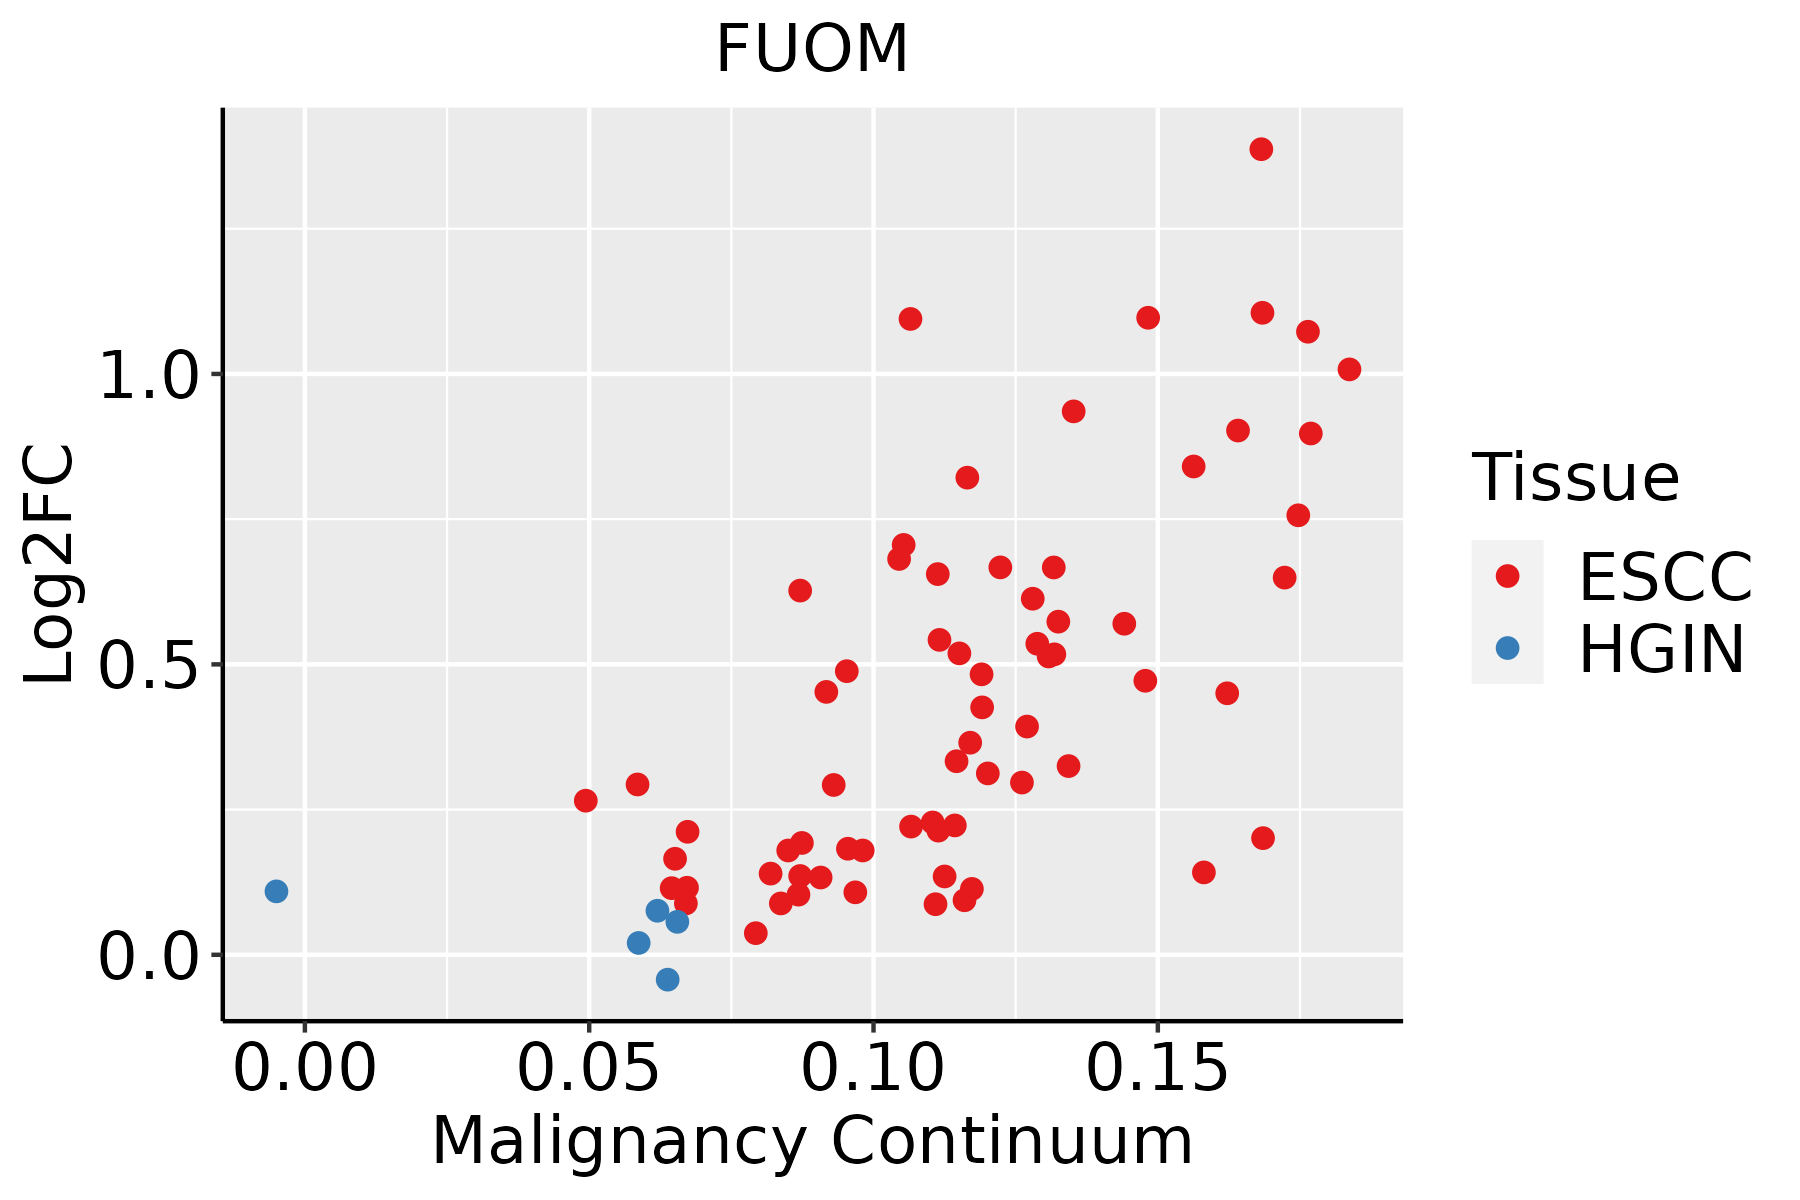 | ESCC: Esophageal squamous cell carcinoma |
| HGIN: High-grade intraepithelial neoplasias | ||
| LGIN: Low-grade intraepithelial neoplasias | ||
| GC | 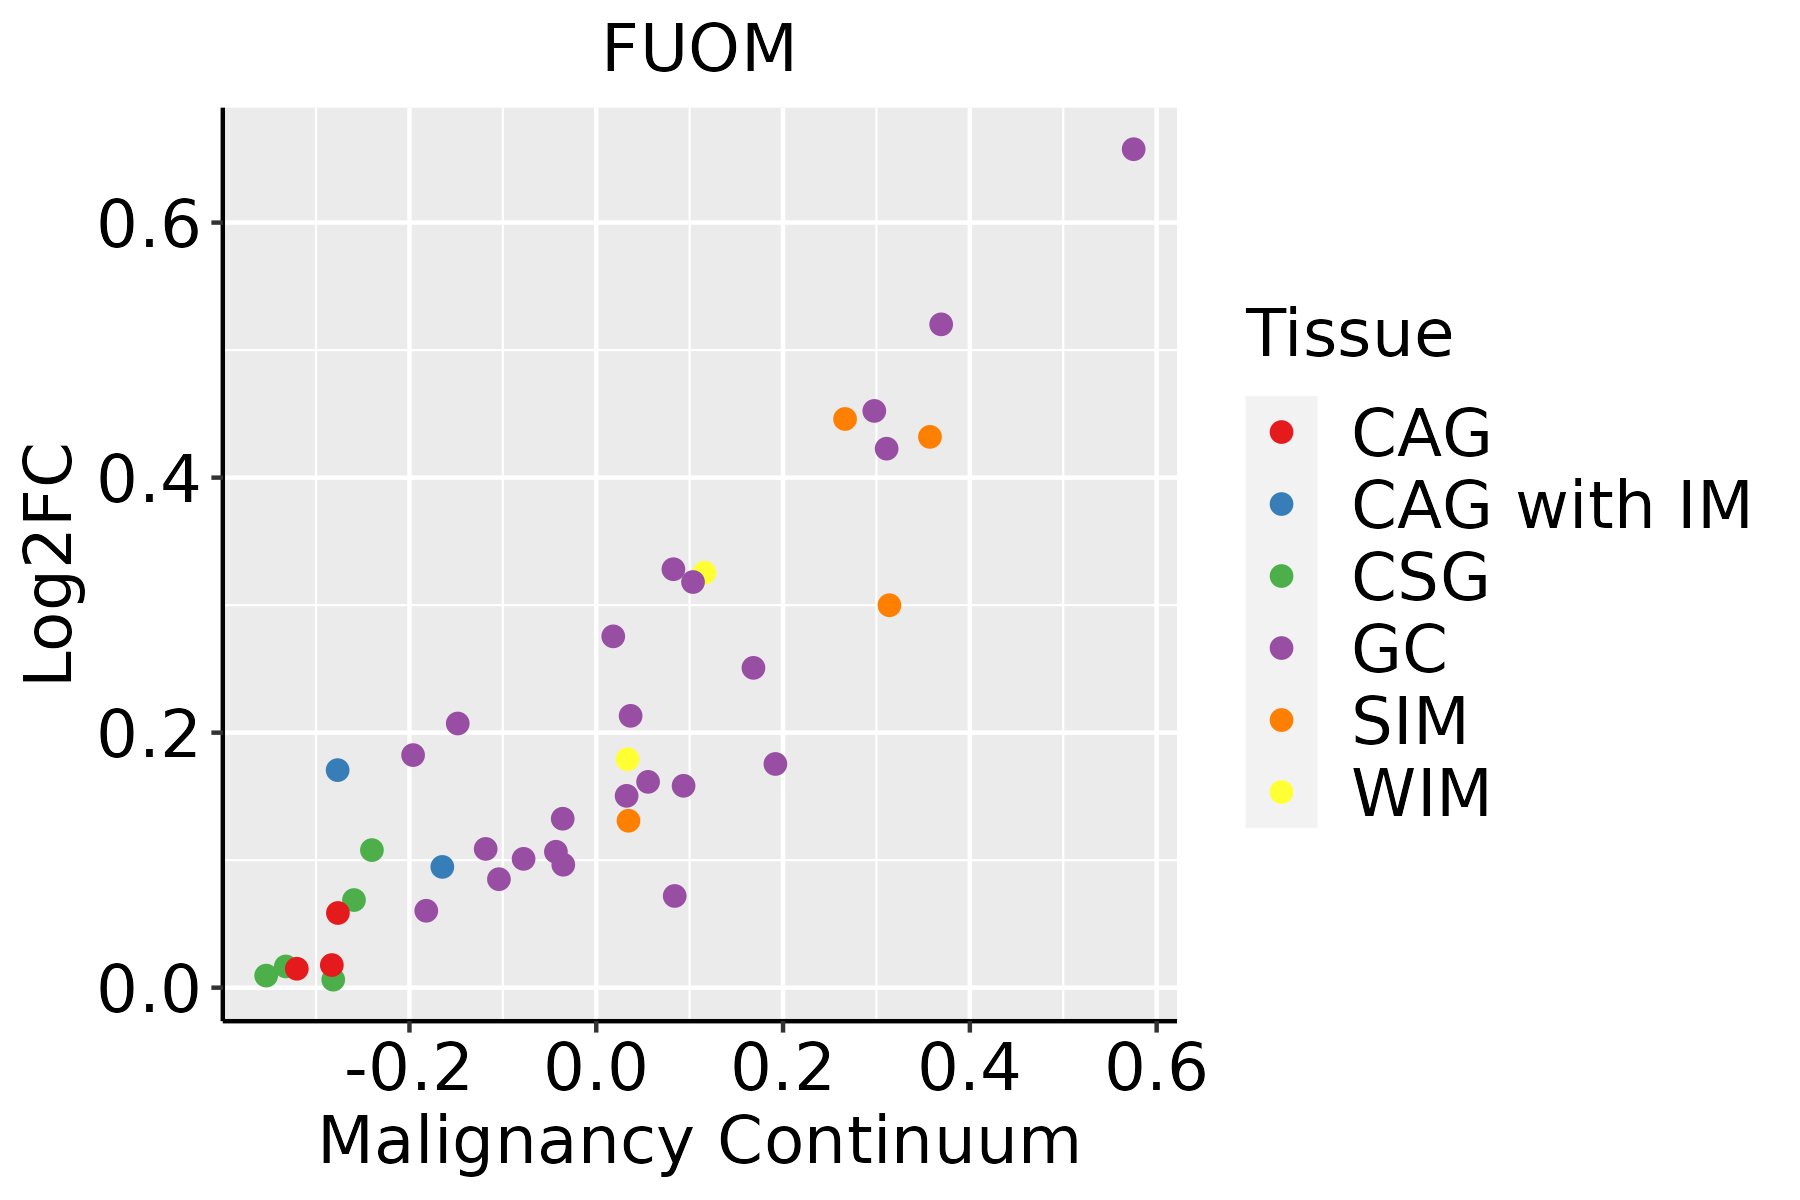 | CAG: Chronic atrophic gastritis |
| CAG with IM: Chronic atrophic gastritis with intestinal metaplasia | ||
| CSG: Chronic superficial gastritis | ||
| GC: Gastric cancer | ||
| SIM: Severe intestinal metaplasia | ||
| WIM: Wild intestinal metaplasia | ||
| Liver | 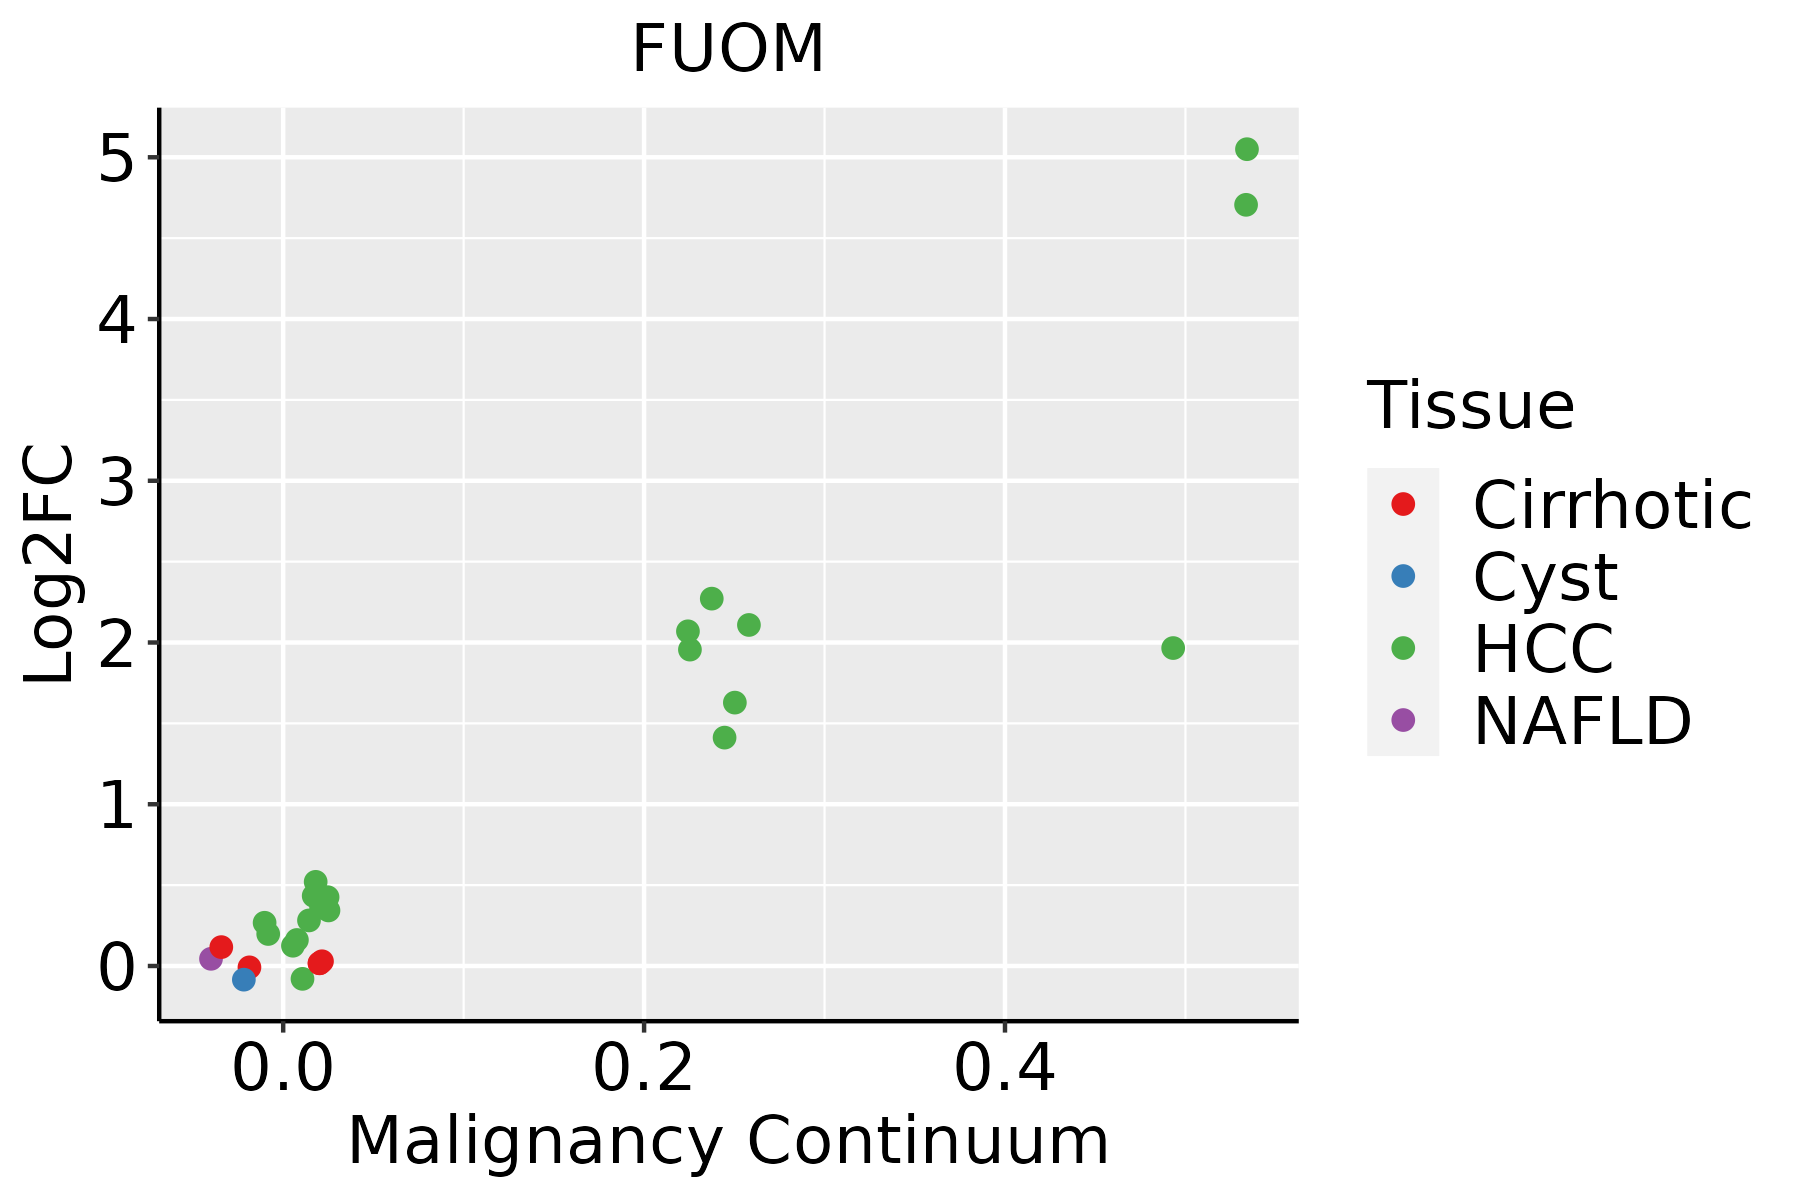 | HCC: Hepatocellular carcinoma |
| NAFLD: Non-alcoholic fatty liver disease | ||
| Oral Cavity | 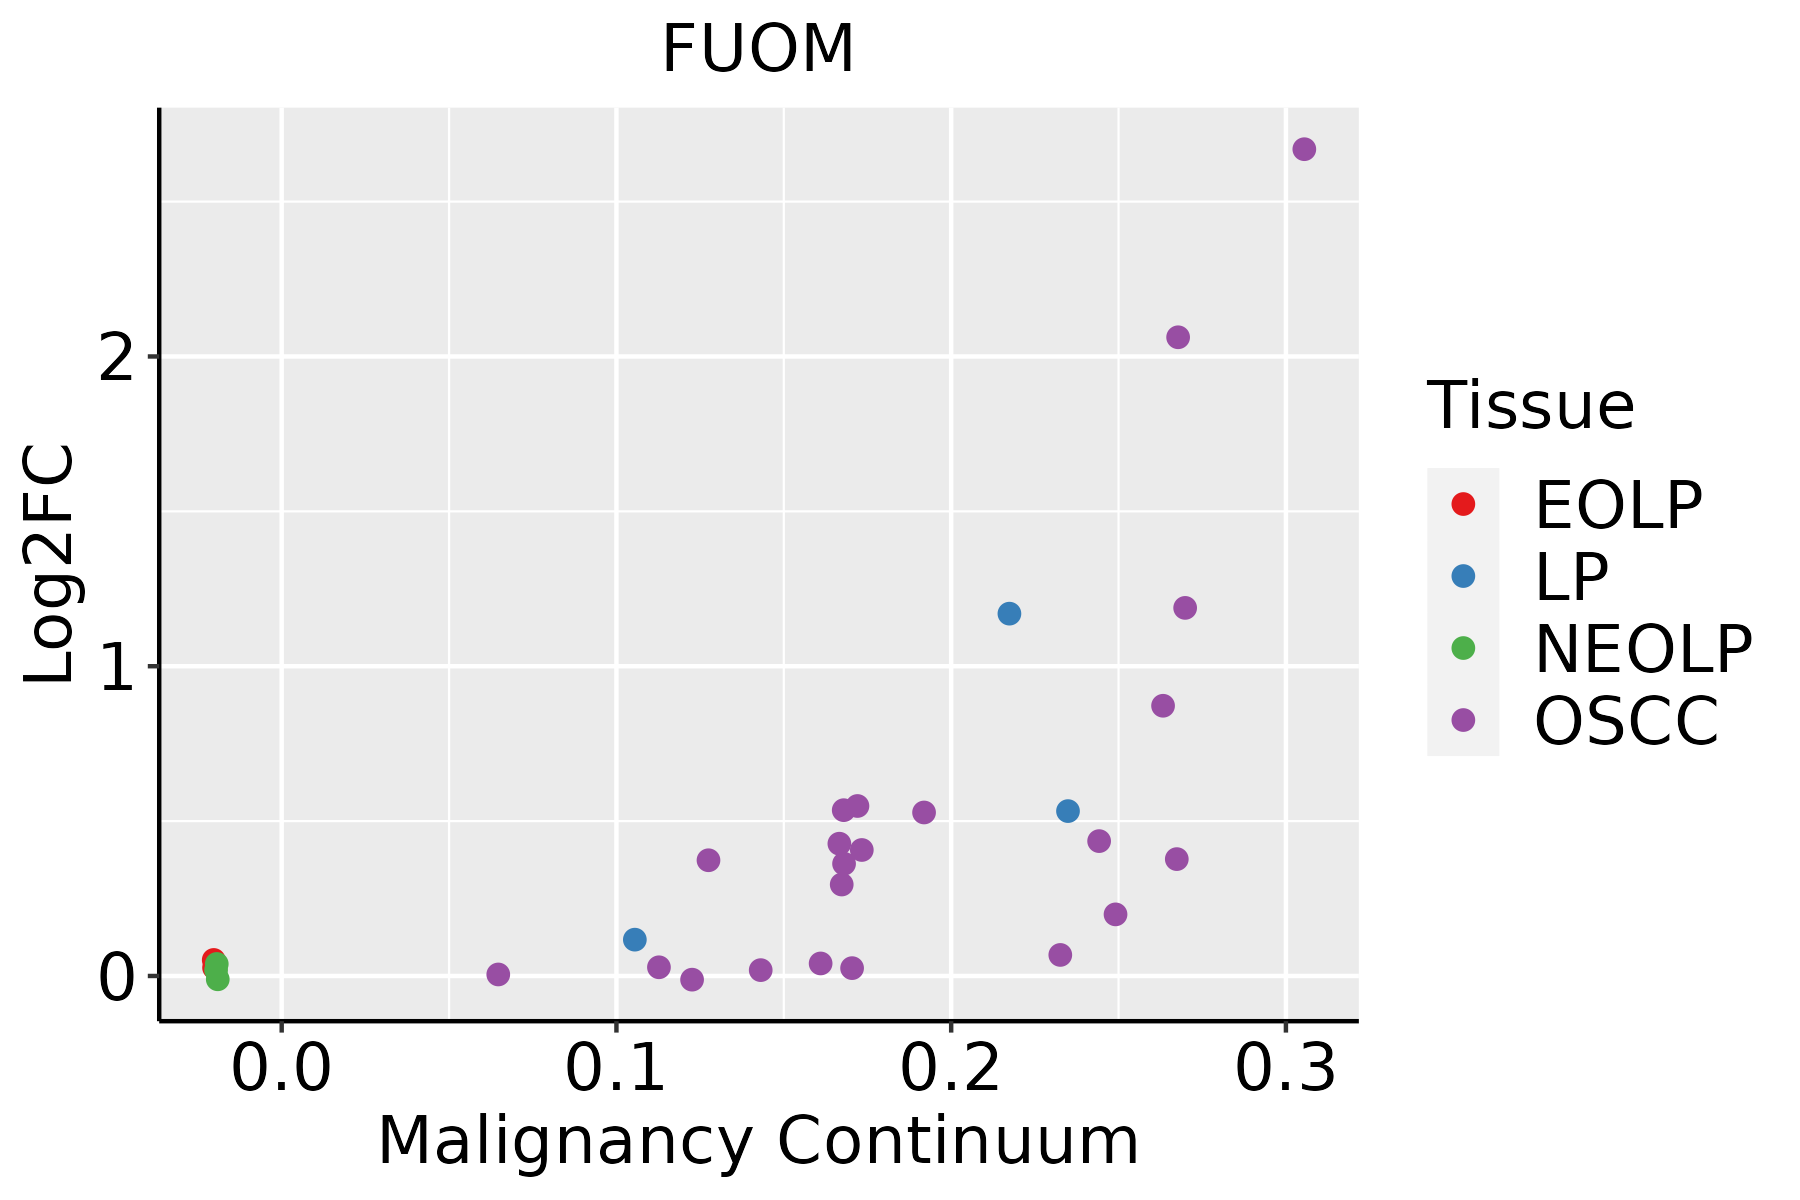 | EOLP: Erosive Oral lichen planus |
| LP: leukoplakia | ||
| NEOLP: Non-erosive oral lichen planus | ||
| OSCC: Oral squamous cell carcinoma |
| ∗log2FC in expression of this searched gene in stem-like cells from each diseased tissue sample relative to stem-like cells in normal samples in each tissue plotted against the malignancy continuum. Samples are colored based on if they are from different disease stage. |
Top |
Malignant transformation related pathway analysis |
| Find out the enriched GO biological processes and KEGG pathways involved in transition from healthy to precancer to cancer |
| Tissue | Disease Stage | Enriched GO biological Processes |
| Colorectum | AD |  |
| Colorectum | SER |  |
| Colorectum | MSS |  |
| Colorectum | MSI-H |  |
| Colorectum | FAP |  |
| ∗Top 15 enriched GO BP terms are showed in the bar plot of each disease state in each tissue. Each row represents a significant GO biological process which is colored according to the -log10(p.adjust). |
| Page: 1 2 3 4 5 6 7 8 9 |
| GO ID | Tissue | Disease Stage | Description | Gene Ratio | Bg Ratio | pvalue | p.adjust | Count |
| GO:00059969 | Esophagus | ESCC | monosaccharide metabolic process | 159/8552 | 257/18723 | 1.11e-07 | 1.81e-06 | 159 |
| GO:00193189 | Esophagus | ESCC | hexose metabolic process | 147/8552 | 237/18723 | 2.63e-07 | 3.94e-06 | 147 |
| GO:00700854 | Esophagus | ESCC | glycosylation | 144/8552 | 240/18723 | 5.12e-06 | 5.38e-05 | 144 |
| GO:000599621 | Liver | HCC | monosaccharide metabolic process | 167/7958 | 257/18723 | 2.31e-13 | 1.25e-11 | 167 |
| GO:001931821 | Liver | HCC | hexose metabolic process | 155/7958 | 237/18723 | 7.63e-13 | 3.90e-11 | 155 |
| GO:00700852 | Liver | HCC | glycosylation | 128/7958 | 240/18723 | 4.35e-04 | 2.92e-03 | 128 |
| GO:00059968 | Oral cavity | OSCC | monosaccharide metabolic process | 129/7305 | 257/18723 | 1.63e-04 | 1.13e-03 | 129 |
| GO:00193188 | Oral cavity | OSCC | hexose metabolic process | 118/7305 | 237/18723 | 4.53e-04 | 2.73e-03 | 118 |
| GO:00700853 | Oral cavity | OSCC | glycosylation | 117/7305 | 240/18723 | 1.29e-03 | 6.42e-03 | 117 |
| GO:000599613 | Oral cavity | LP | monosaccharide metabolic process | 86/4623 | 257/18723 | 9.13e-04 | 7.79e-03 | 86 |
| GO:001931813 | Oral cavity | LP | hexose metabolic process | 78/4623 | 237/18723 | 2.55e-03 | 1.80e-02 | 78 |
| GO:007008511 | Oral cavity | LP | glycosylation | 77/4623 | 240/18723 | 5.60e-03 | 3.38e-02 | 77 |
| GO:00059964 | Stomach | GC | monosaccharide metabolic process | 31/1159 | 257/18723 | 2.90e-04 | 4.67e-03 | 31 |
| GO:00193184 | Stomach | GC | hexose metabolic process | 29/1159 | 237/18723 | 3.53e-04 | 5.54e-03 | 29 |
| Page: 1 |
| Pathway ID | Tissue | Disease Stage | Description | Gene Ratio | Bg Ratio | pvalue | p.adjust | qvalue | Count |
| Page: 1 |
Top |
Cell-cell communication analysis |
| Identification of potential cell-cell interactions between two cell types and their ligand-receptor pairs for different disease states |
| Ligand | Receptor | LRpair | Pathway | Tissue | Disease Stage |
| Page: 1 |
Top |
Single-cell gene regulatory network inference analysis |
| Find out the significant the regulons (TFs) and the target genes of each regulon across cell types for different disease states |
| TF | Cell Type | Tissue | Disease Stage | Target Gene | RSS | Regulon Activity |
| ∗The dot plots of a searched regulon are shown for all cell subpopulations in each disease state of each tissue based on the regulon specific score inferred using pySCENIC and by calculating the average expression. |
| Page: 1 |
Top |
Somatic mutation of malignant transformation related genes |
| Annotation of somatic variants for genes involved in malignant transformation |
| Hugo Symbol | Variant Class | Variant Classification | dbSNP RS | HGVSc | HGVSp | HGVSp Short | SWISSPROT | BIOTYPE | SIFT | PolyPhen | Tumor Sample Barcode | Tissue | Histology | Sex | Age | Stage | Therapy Types | Drugs | Outcome |
| FUOM | SNV | Missense_Mutation | novel | c.119N>C | p.Ile40Thr | p.I40T | A2VDF0 | protein_coding | tolerated(0.09) | benign(0.037) | TCGA-5M-AAT6-01 | Colorectum | colon adenocarcinoma | Female | <65 | III/IV | Unknown | Unknown | PD |
| FUOM | SNV | Missense_Mutation | c.184N>A | p.Val62Met | p.V62M | A2VDF0 | protein_coding | deleterious(0.01) | probably_damaging(0.976) | TCGA-AZ-4615-01 | Colorectum | colon adenocarcinoma | Male | >=65 | III/IV | Chemotherapy | xeloda | PD | |
| FUOM | SNV | Missense_Mutation | c.437N>T | p.Gly146Val | p.G146V | A2VDF0 | protein_coding | deleterious(0) | probably_damaging(1) | TCGA-AH-6897-01 | Colorectum | rectum adenocarcinoma | Male | <65 | I/II | Unknown | Unknown | SD | |
| FUOM | SNV | Missense_Mutation | novel | c.457N>A | p.Leu153Met | p.L153M | A2VDF0 | protein_coding | deleterious_low_confidence(0) | benign(0.022) | TCGA-A5-A1OF-01 | Endometrium | uterine corpus endometrioid carcinoma | Female | <65 | I/II | Unknown | Unknown | SD |
| FUOM | SNV | Missense_Mutation | rs373850137 | c.415N>A | p.Gly139Arg | p.G139R | A2VDF0 | protein_coding | deleterious(0) | probably_damaging(1) | TCGA-AX-A2HD-01 | Endometrium | uterine corpus endometrioid carcinoma | Female | >=65 | III/IV | Unknown | Unknown | SD |
| FUOM | SNV | Missense_Mutation | novel | c.406N>A | p.Ala136Thr | p.A136T | A2VDF0 | protein_coding | deleterious(0) | benign(0.378) | TCGA-FI-A2D0-01 | Endometrium | uterine corpus endometrioid carcinoma | Female | <65 | I/II | Unknown | Unknown | SD |
| FUOM | SNV | Missense_Mutation | rs775562649 | c.316N>A | p.Gly106Ser | p.G106S | A2VDF0 | protein_coding | tolerated(0.17) | benign(0.072) | TCGA-FI-A3PV-01 | Endometrium | uterine corpus endometrioid carcinoma | Female | >=65 | I/II | Unknown | Unknown | PD |
| FUOM | SNV | Missense_Mutation | novel | c.325N>G | p.Arg109Gly | p.R109G | A2VDF0 | protein_coding | tolerated(0.4) | benign(0) | TCGA-DD-AADS-01 | Liver | liver hepatocellular carcinoma | Male | <65 | I/II | Unknown | Unknown | SD |
| FUOM | SNV | Missense_Mutation | c.460N>A | p.Leu154Met | p.L154M | A2VDF0 | protein_coding | tolerated_low_confidence(0.09) | benign(0.11) | TCGA-WQ-A9G7-01 | Liver | liver hepatocellular carcinoma | Female | >=65 | III/IV | Unknown | Unknown | SD | |
| FUOM | SNV | Missense_Mutation | novel | c.410N>A | p.Leu137His | p.L137H | A2VDF0 | protein_coding | deleterious(0) | possibly_damaging(0.849) | TCGA-CV-7435-01 | Oral cavity | head & neck squamous cell carcinoma | Female | <65 | I/II | Unknown | Unknown | SD |
| Page: 1 |
Top |
Related drugs of malignant transformation related genes |
| Identification of chemicals and drugs interact with genes involved in malignant transfromation |
| (DGIdb 4.0) |
| Entrez ID | Symbol | Category | Interaction Types | Drug Claim Name | Drug Name | PMIDs |
| Page: 1 |

Copyright 2023-Present -The University of Texas Health Science Center at Houston |