
|
|||||
|
 | |
| |
| |
| |
| |
| |
|
Gene: FUCA2 |
Gene summary for FUCA2 |
| Gene information | Species | Human | Gene symbol | FUCA2 | Gene ID | 2519 |
| Gene name | alpha-L-fucosidase 2 | |
| Gene Alias | dJ20N2.5 | |
| Cytomap | 6q24.2 | |
| Gene Type | protein-coding | GO ID | GO:0005975 | UniProtAcc | Q9BTY2 |
Top |
Malignant transformation analysis |
| Identification of the aberrant gene expression in precancerous and cancerous lesions by comparing the gene expression of stem-like cells in diseased tissues with normal stem cells |
| Entrez ID | Symbol | Replicates | Species | Organ | Tissue | Adj P-value | Log2FC | Malignancy |
| 2519 | FUCA2 | LZE4T | Human | Esophagus | ESCC | 6.79e-12 | 3.30e-01 | 0.0811 |
| 2519 | FUCA2 | LZE7T | Human | Esophagus | ESCC | 1.22e-07 | 6.31e-01 | 0.0667 |
| 2519 | FUCA2 | LZE8T | Human | Esophagus | ESCC | 4.18e-06 | 2.93e-01 | 0.067 |
| 2519 | FUCA2 | LZE20T | Human | Esophagus | ESCC | 9.92e-06 | 1.36e-01 | 0.0662 |
| 2519 | FUCA2 | LZE22T | Human | Esophagus | ESCC | 8.80e-05 | 5.14e-01 | 0.068 |
| 2519 | FUCA2 | LZE24T | Human | Esophagus | ESCC | 1.84e-09 | 4.30e-01 | 0.0596 |
| 2519 | FUCA2 | LZE21T | Human | Esophagus | ESCC | 1.90e-06 | 2.06e-01 | 0.0655 |
| 2519 | FUCA2 | LZE6T | Human | Esophagus | ESCC | 1.33e-03 | 3.44e-01 | 0.0845 |
| 2519 | FUCA2 | P1T-E | Human | Esophagus | ESCC | 3.89e-03 | 4.47e-01 | 0.0875 |
| 2519 | FUCA2 | P2T-E | Human | Esophagus | ESCC | 7.55e-07 | 1.01e-01 | 0.1177 |
| 2519 | FUCA2 | P4T-E | Human | Esophagus | ESCC | 7.62e-24 | 6.07e-01 | 0.1323 |
| 2519 | FUCA2 | P5T-E | Human | Esophagus | ESCC | 6.08e-19 | 4.59e-01 | 0.1327 |
| 2519 | FUCA2 | P8T-E | Human | Esophagus | ESCC | 3.04e-48 | 9.60e-01 | 0.0889 |
| 2519 | FUCA2 | P9T-E | Human | Esophagus | ESCC | 8.57e-18 | 5.48e-01 | 0.1131 |
| 2519 | FUCA2 | P10T-E | Human | Esophagus | ESCC | 1.85e-43 | 7.56e-01 | 0.116 |
| 2519 | FUCA2 | P11T-E | Human | Esophagus | ESCC | 2.55e-15 | 6.84e-01 | 0.1426 |
| 2519 | FUCA2 | P15T-E | Human | Esophagus | ESCC | 3.18e-16 | 4.72e-01 | 0.1149 |
| 2519 | FUCA2 | P16T-E | Human | Esophagus | ESCC | 8.63e-13 | 2.27e-01 | 0.1153 |
| 2519 | FUCA2 | P17T-E | Human | Esophagus | ESCC | 2.79e-07 | 5.04e-01 | 0.1278 |
| 2519 | FUCA2 | P19T-E | Human | Esophagus | ESCC | 3.45e-11 | 1.11e+00 | 0.1662 |
| Page: 1 2 3 4 5 6 |
| Tissue | Expression Dynamics | Abbreviation |
| Esophagus | 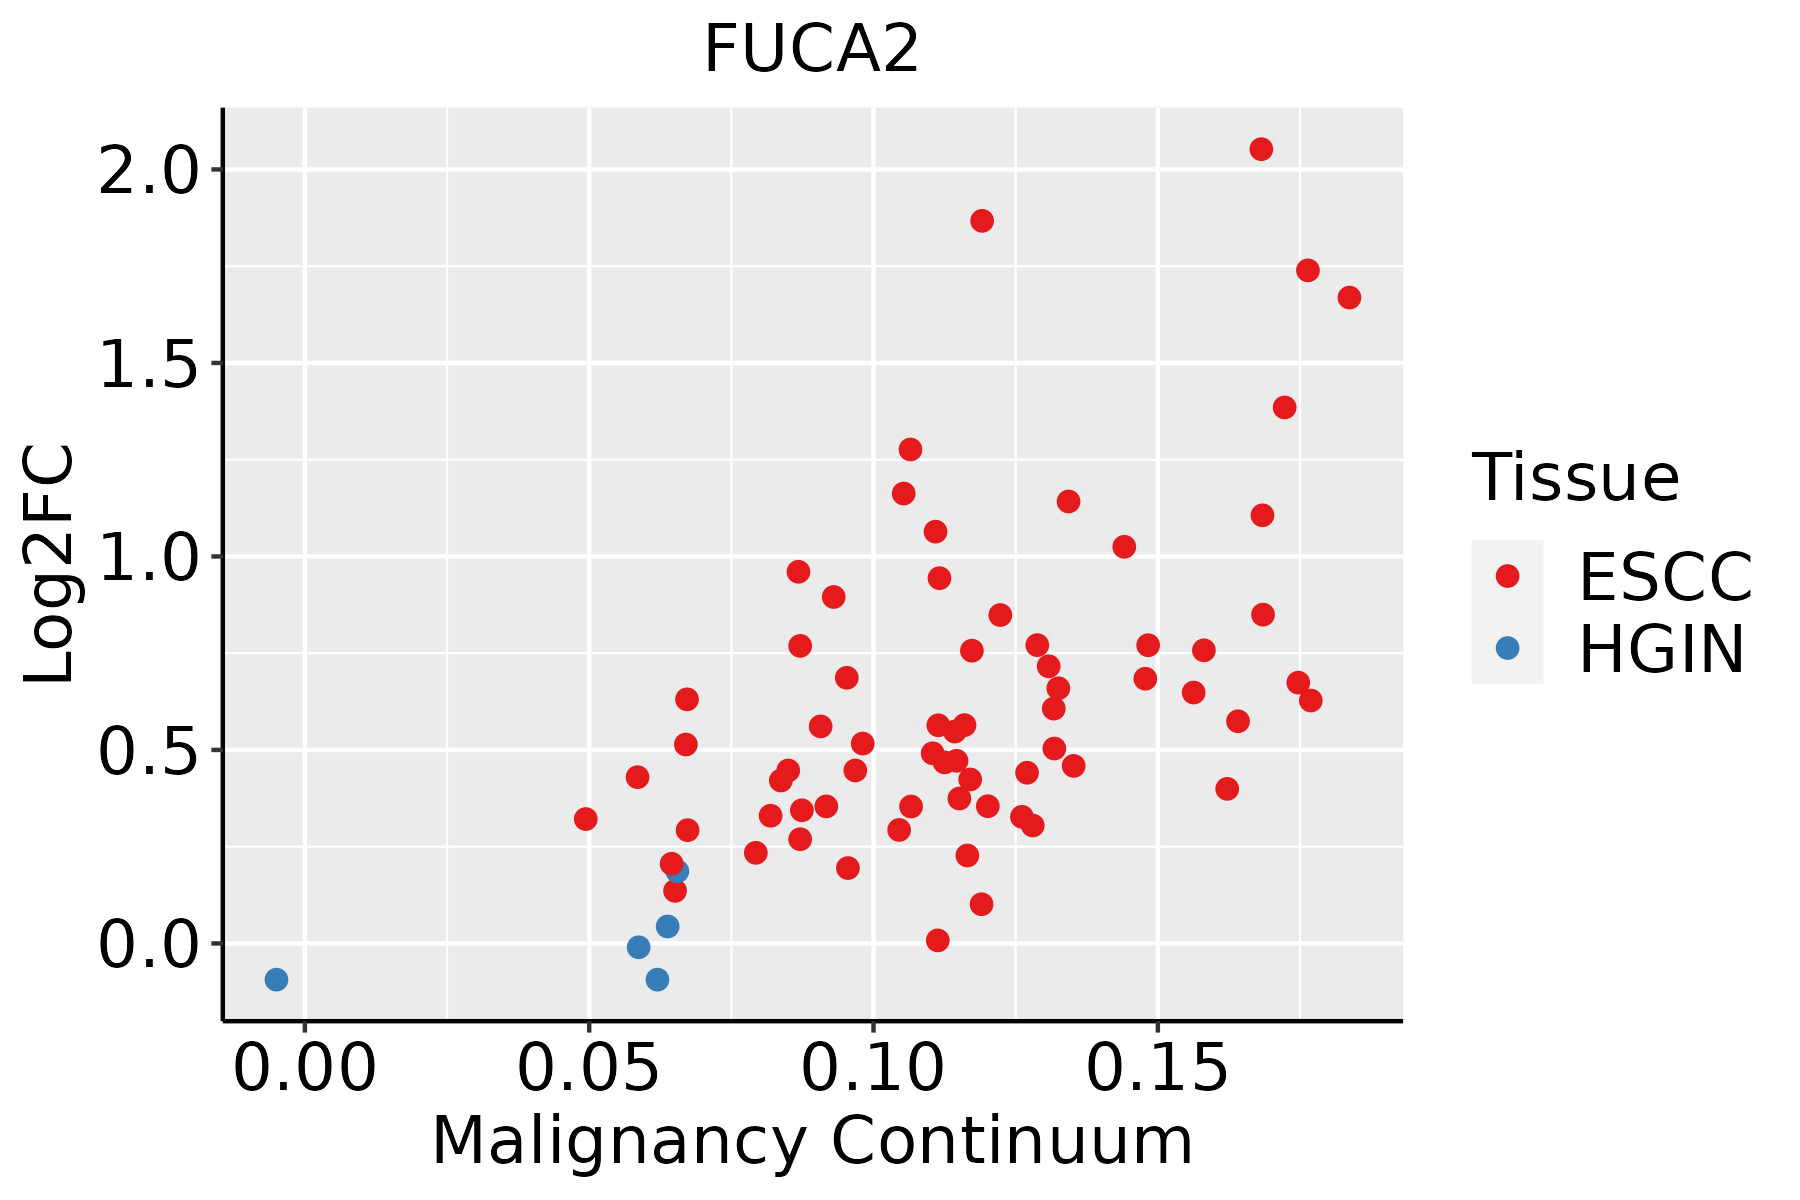 | ESCC: Esophageal squamous cell carcinoma |
| HGIN: High-grade intraepithelial neoplasias | ||
| LGIN: Low-grade intraepithelial neoplasias | ||
| Liver | 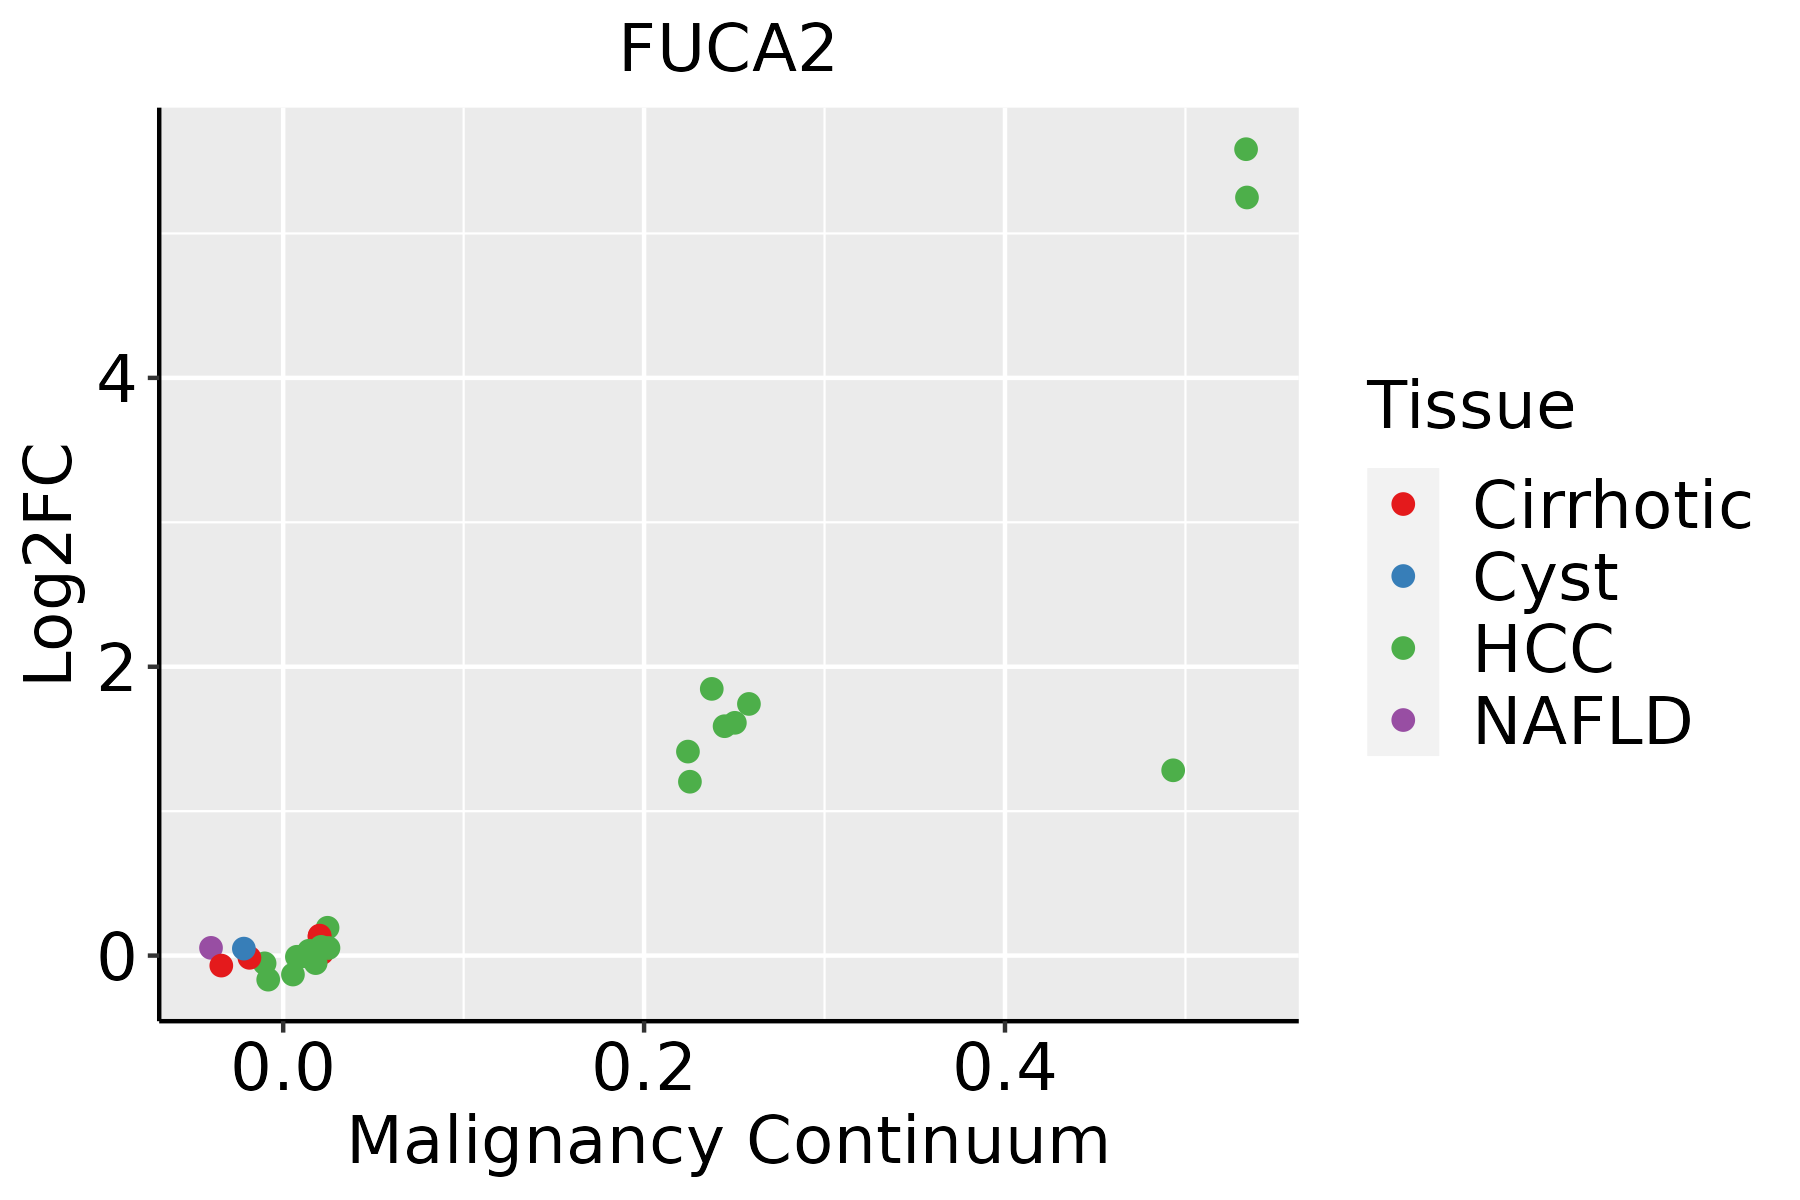 | HCC: Hepatocellular carcinoma |
| NAFLD: Non-alcoholic fatty liver disease | ||
| Oral Cavity | 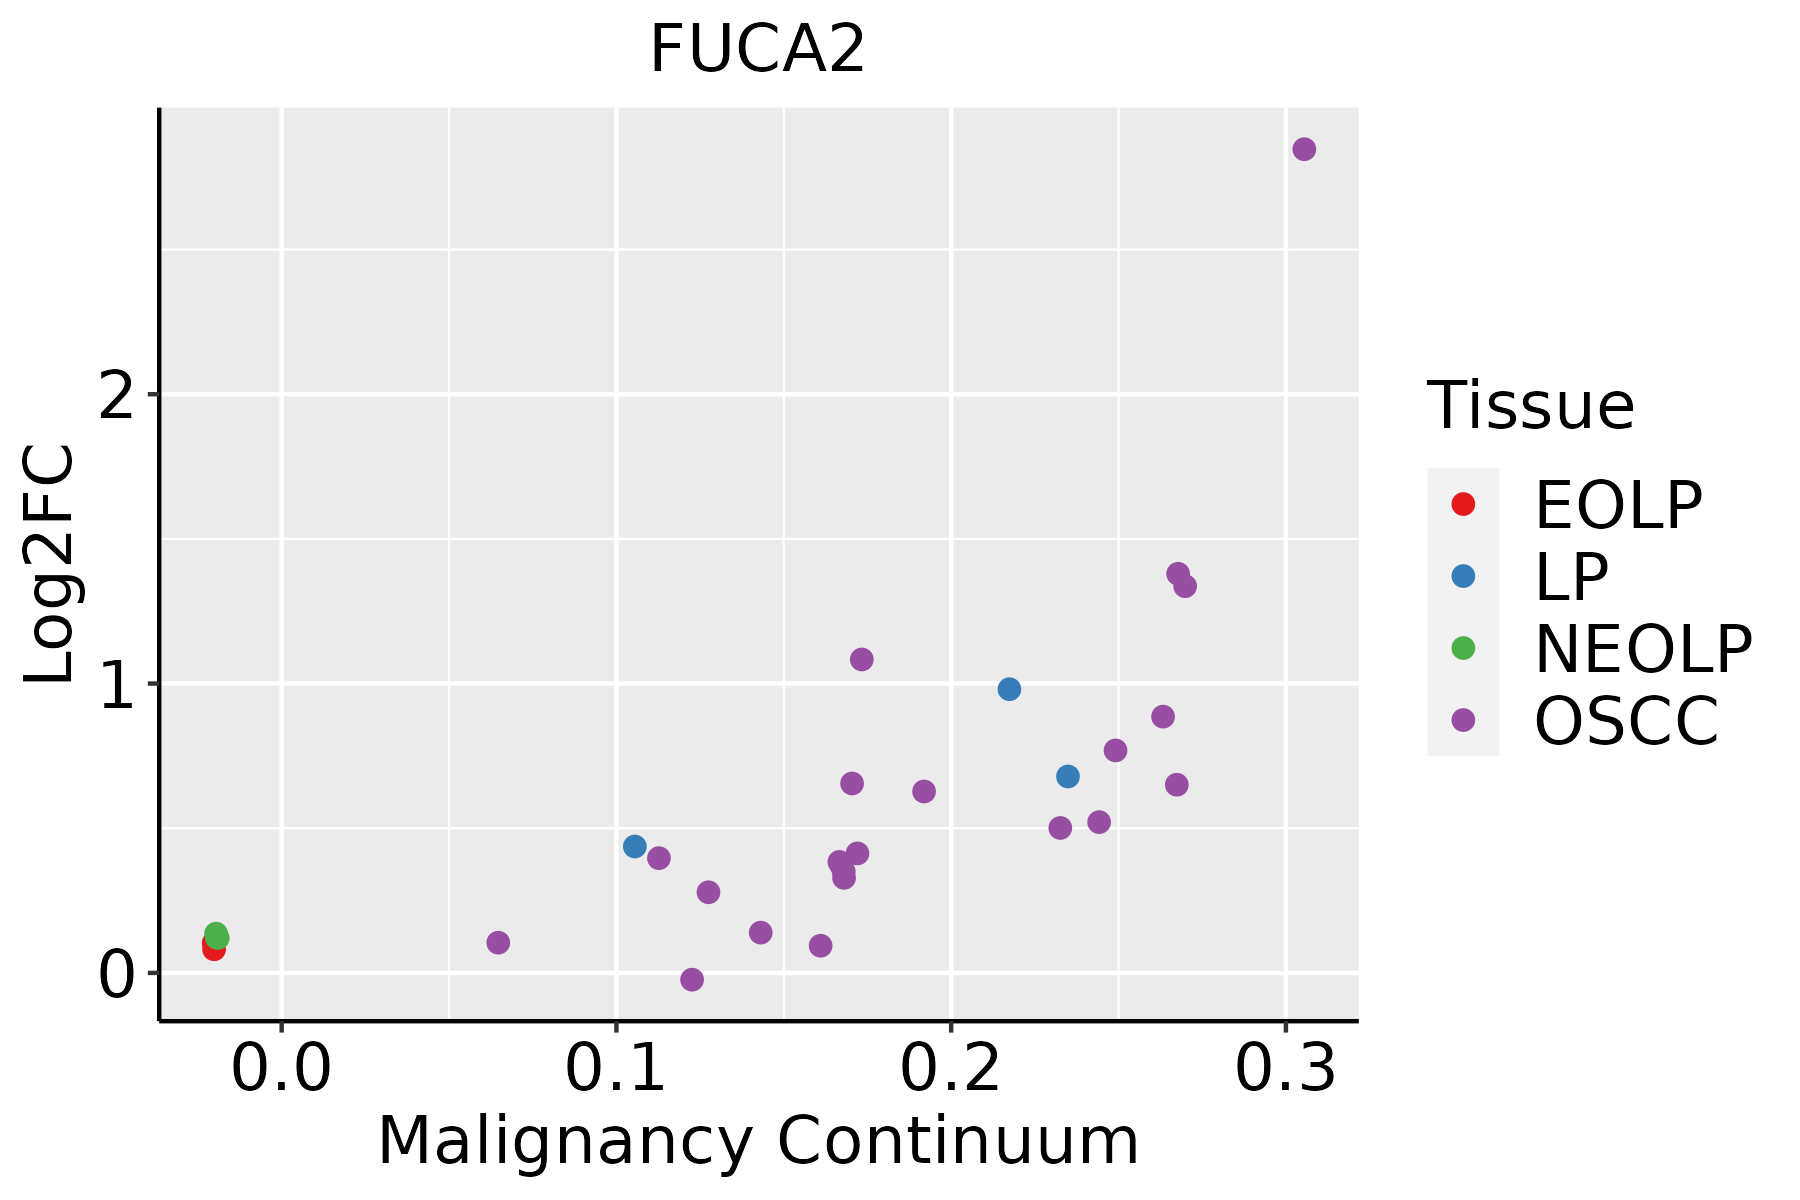 | EOLP: Erosive Oral lichen planus |
| LP: leukoplakia | ||
| NEOLP: Non-erosive oral lichen planus | ||
| OSCC: Oral squamous cell carcinoma | ||
| Prostate |  | BPH: Benign Prostatic Hyperplasia |
| Skin | 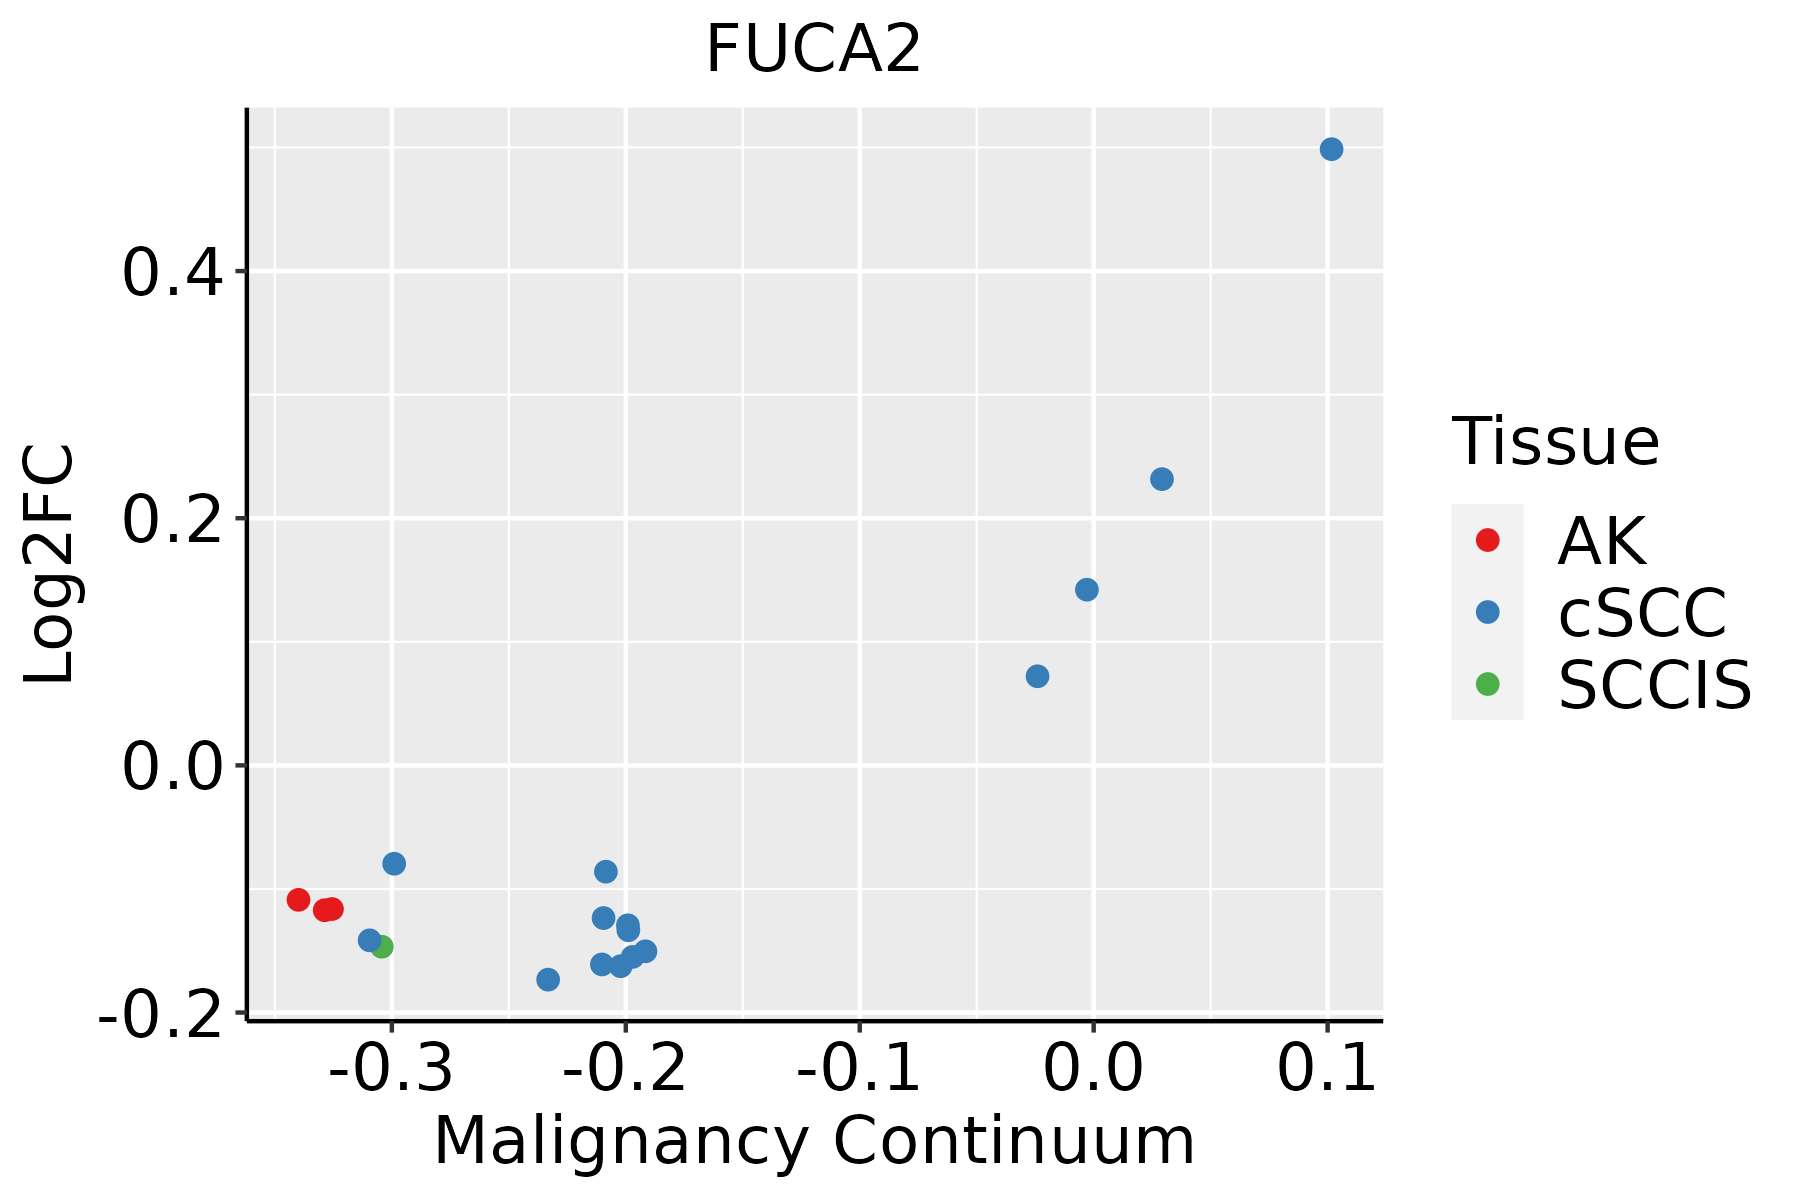 | AK: Actinic keratosis |
| cSCC: Cutaneous squamous cell carcinoma | ||
| SCCIS:squamous cell carcinoma in situ | ||
| Thyroid | 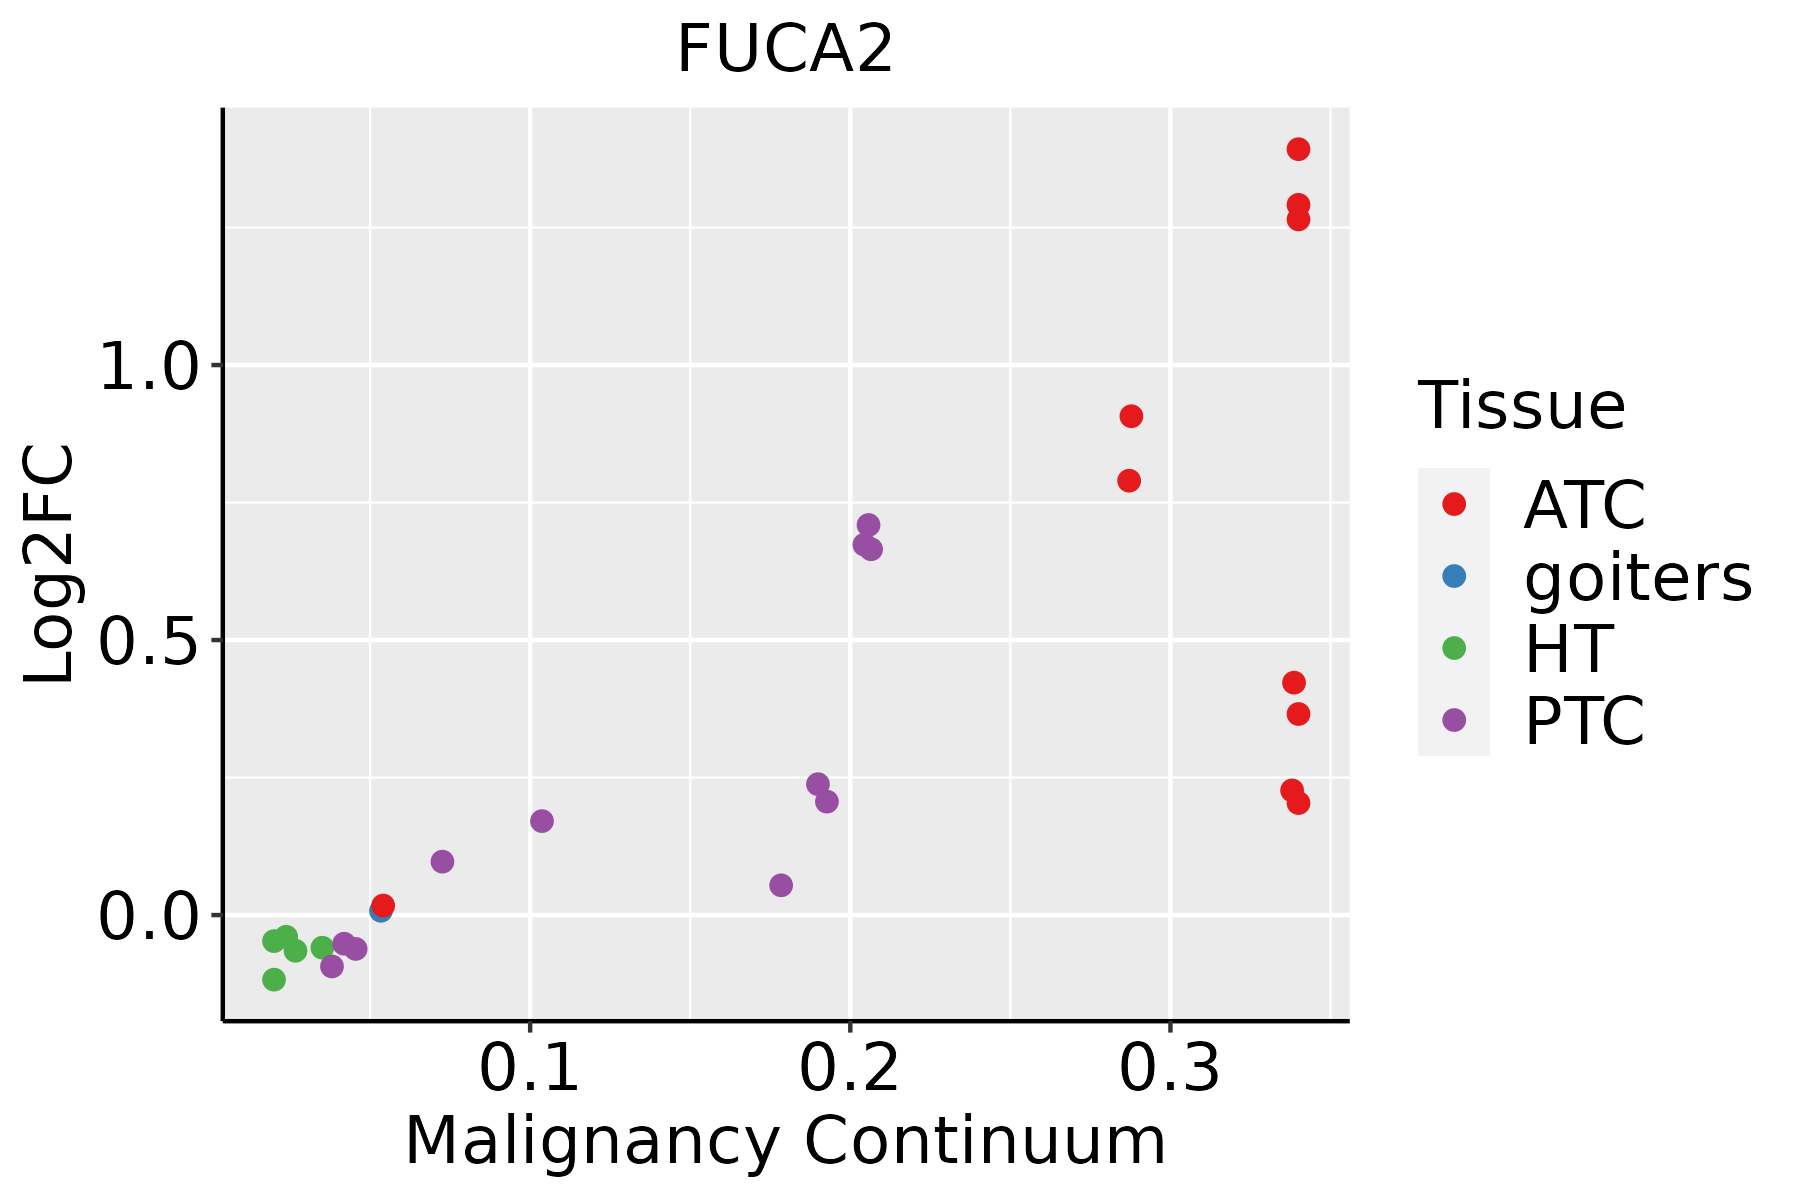 | ATC: Anaplastic thyroid cancer |
| HT: Hashimoto's thyroiditis | ||
| PTC: Papillary thyroid cancer |
| ∗log2FC in expression of this searched gene in stem-like cells from each diseased tissue sample relative to stem-like cells in normal samples in each tissue plotted against the malignancy continuum. Samples are colored based on if they are from different disease stage. |
Top |
Malignant transformation related pathway analysis |
| Find out the enriched GO biological processes and KEGG pathways involved in transition from healthy to precancer to cancer |
| Tissue | Disease Stage | Enriched GO biological Processes |
| Colorectum | AD |  |
| Colorectum | SER |  |
| Colorectum | MSS |  |
| Colorectum | MSI-H |  |
| Colorectum | FAP |  |
| ∗Top 15 enriched GO BP terms are showed in the bar plot of each disease state in each tissue. Each row represents a significant GO biological process which is colored according to the -log10(p.adjust). |
| Page: 1 2 3 4 5 6 7 8 9 |
| GO ID | Tissue | Disease Stage | Description | Gene Ratio | Bg Ratio | pvalue | p.adjust | Count |
| GO:0044403111 | Esophagus | ESCC | biological process involved in symbiotic interaction | 186/8552 | 290/18723 | 1.43e-10 | 4.16e-09 | 186 |
| GO:0051701111 | Esophagus | ESCC | biological process involved in interaction with host | 135/8552 | 203/18723 | 1.49e-09 | 3.49e-08 | 135 |
| GO:0052126111 | Esophagus | ESCC | movement in host environment | 117/8552 | 175/18723 | 1.14e-08 | 2.26e-07 | 117 |
| GO:00059969 | Esophagus | ESCC | monosaccharide metabolic process | 159/8552 | 257/18723 | 1.11e-07 | 1.81e-06 | 159 |
| GO:00193189 | Esophagus | ESCC | hexose metabolic process | 147/8552 | 237/18723 | 2.63e-07 | 3.94e-06 | 147 |
| GO:0044409111 | Esophagus | ESCC | entry into host | 96/8552 | 151/18723 | 6.73e-06 | 6.84e-05 | 96 |
| GO:0043903111 | Esophagus | ESCC | regulation of biological process involved in symbiotic interaction | 49/8552 | 72/18723 | 1.03e-04 | 7.26e-04 | 49 |
| GO:19016574 | Esophagus | ESCC | glycosyl compound metabolic process | 57/8552 | 88/18723 | 2.32e-04 | 1.44e-03 | 57 |
| GO:19011362 | Esophagus | ESCC | carbohydrate derivative catabolic process | 99/8552 | 172/18723 | 1.11e-03 | 5.54e-03 | 99 |
| GO:005237219 | Esophagus | ESCC | modulation by symbiont of entry into host | 32/8552 | 49/18723 | 4.39e-03 | 1.73e-02 | 32 |
| GO:00161373 | Esophagus | ESCC | glycoside metabolic process | 16/8552 | 22/18723 | 9.46e-03 | 3.28e-02 | 16 |
| GO:004440312 | Liver | Cirrhotic | biological process involved in symbiotic interaction | 131/4634 | 290/18723 | 2.00e-14 | 1.84e-12 | 131 |
| GO:005170112 | Liver | Cirrhotic | biological process involved in interaction with host | 88/4634 | 203/18723 | 4.55e-09 | 1.82e-07 | 88 |
| GO:000599612 | Liver | Cirrhotic | monosaccharide metabolic process | 104/4634 | 257/18723 | 1.74e-08 | 6.32e-07 | 104 |
| GO:001931812 | Liver | Cirrhotic | hexose metabolic process | 97/4634 | 237/18723 | 2.67e-08 | 9.16e-07 | 97 |
| GO:00521267 | Liver | Cirrhotic | movement in host environment | 75/4634 | 175/18723 | 1.08e-07 | 3.07e-06 | 75 |
| GO:00439037 | Liver | Cirrhotic | regulation of biological process involved in symbiotic interaction | 34/4634 | 72/18723 | 2.86e-05 | 3.64e-04 | 34 |
| GO:00444097 | Liver | Cirrhotic | entry into host | 58/4634 | 151/18723 | 1.33e-04 | 1.30e-03 | 58 |
| GO:19016572 | Liver | Cirrhotic | glycosyl compound metabolic process | 37/4634 | 88/18723 | 2.70e-04 | 2.40e-03 | 37 |
| GO:0016137 | Liver | Cirrhotic | glycoside metabolic process | 11/4634 | 22/18723 | 9.18e-03 | 4.21e-02 | 11 |
| Page: 1 2 3 4 5 |
| Pathway ID | Tissue | Disease Stage | Description | Gene Ratio | Bg Ratio | pvalue | p.adjust | qvalue | Count |
| hsa0414222 | Esophagus | ESCC | Lysosome | 102/4205 | 132/8465 | 5.11e-11 | 7.13e-10 | 3.65e-10 | 102 |
| hsa0414232 | Esophagus | ESCC | Lysosome | 102/4205 | 132/8465 | 5.11e-11 | 7.13e-10 | 3.65e-10 | 102 |
| hsa041424 | Liver | Cirrhotic | Lysosome | 68/2530 | 132/8465 | 1.34e-07 | 1.97e-06 | 1.21e-06 | 68 |
| hsa0414211 | Liver | Cirrhotic | Lysosome | 68/2530 | 132/8465 | 1.34e-07 | 1.97e-06 | 1.21e-06 | 68 |
| hsa041422 | Liver | HCC | Lysosome | 100/4020 | 132/8465 | 2.32e-11 | 4.31e-10 | 2.40e-10 | 100 |
| hsa00511 | Liver | HCC | Other glycan degradation | 15/4020 | 18/8465 | 1.96e-03 | 6.91e-03 | 3.84e-03 | 15 |
| hsa041423 | Liver | HCC | Lysosome | 100/4020 | 132/8465 | 2.32e-11 | 4.31e-10 | 2.40e-10 | 100 |
| hsa005111 | Liver | HCC | Other glycan degradation | 15/4020 | 18/8465 | 1.96e-03 | 6.91e-03 | 3.84e-03 | 15 |
| hsa041425 | Oral cavity | OSCC | Lysosome | 87/3704 | 132/8465 | 1.97e-07 | 1.35e-06 | 6.86e-07 | 87 |
| hsa0414212 | Oral cavity | OSCC | Lysosome | 87/3704 | 132/8465 | 1.97e-07 | 1.35e-06 | 6.86e-07 | 87 |
| hsa0414221 | Oral cavity | LP | Lysosome | 67/2418 | 132/8465 | 5.13e-08 | 7.77e-07 | 5.01e-07 | 67 |
| hsa0414231 | Oral cavity | LP | Lysosome | 67/2418 | 132/8465 | 5.13e-08 | 7.77e-07 | 5.01e-07 | 67 |
| Page: 1 |
Top |
Cell-cell communication analysis |
| Identification of potential cell-cell interactions between two cell types and their ligand-receptor pairs for different disease states |
| Ligand | Receptor | LRpair | Pathway | Tissue | Disease Stage |
| Page: 1 |
Top |
Single-cell gene regulatory network inference analysis |
| Find out the significant the regulons (TFs) and the target genes of each regulon across cell types for different disease states |
| TF | Cell Type | Tissue | Disease Stage | Target Gene | RSS | Regulon Activity |
| ∗The dot plots of a searched regulon are shown for all cell subpopulations in each disease state of each tissue based on the regulon specific score inferred using pySCENIC and by calculating the average expression. |
| Page: 1 |
Top |
Somatic mutation of malignant transformation related genes |
| Annotation of somatic variants for genes involved in malignant transformation |
| Hugo Symbol | Variant Class | Variant Classification | dbSNP RS | HGVSc | HGVSp | HGVSp Short | SWISSPROT | BIOTYPE | SIFT | PolyPhen | Tumor Sample Barcode | Tissue | Histology | Sex | Age | Stage | Therapy Types | Drugs | Outcome |
| FUCA2 | SNV | Missense_Mutation | novel | c.95N>T | p.Thr32Met | p.T32M | Q9BTY2 | protein_coding | tolerated(0.1) | benign(0.052) | TCGA-AC-A3TM-01 | Breast | breast invasive carcinoma | Female | <65 | III/IV | Chemotherapy | cytoxan | CR |
| FUCA2 | SNV | Missense_Mutation | novel | c.1271T>G | p.Leu424Arg | p.L424R | Q9BTY2 | protein_coding | deleterious(0) | probably_damaging(0.957) | TCGA-AN-A046-01 | Breast | breast invasive carcinoma | Female | >=65 | I/II | Unknown | Unknown | SD |
| FUCA2 | SNV | Missense_Mutation | rs771445547 | c.785N>A | p.Arg262His | p.R262H | Q9BTY2 | protein_coding | deleterious(0) | probably_damaging(0.999) | TCGA-C8-A1HO-01 | Breast | breast invasive carcinoma | Female | <65 | III/IV | Chemotherapy | 5-fluorouracil | CR |
| FUCA2 | SNV | Missense_Mutation | c.355G>A | p.Asp119Asn | p.D119N | Q9BTY2 | protein_coding | tolerated(0.11) | benign(0.178) | TCGA-E9-A1R4-01 | Breast | breast invasive carcinoma | Female | >=65 | I/II | Chemotherapy | 5-fluorouracil | SD | |
| FUCA2 | insertion | Nonsense_Mutation | novel | c.515_516insCCCATGGTTTTGAAGTCA | p.Arg172delinsSerProTrpPheTerSerGln | p.R172delinsSPWF*SQ | Q9BTY2 | protein_coding | TCGA-AR-A0U2-01 | Breast | breast invasive carcinoma | Female | <65 | III/IV | Hormone Therapy | tamoxiphen | PD | ||
| FUCA2 | SNV | Missense_Mutation | rs200632280 | c.1361N>T | p.Pro454Leu | p.P454L | Q9BTY2 | protein_coding | deleterious(0.02) | possibly_damaging(0.573) | TCGA-EA-A3HS-01 | Cervix | cervical & endocervical cancer | Female | <65 | I/II | Unknown | Unknown | SD |
| FUCA2 | SNV | Missense_Mutation | c.433N>C | p.Glu145Gln | p.E145Q | Q9BTY2 | protein_coding | tolerated(0.15) | benign(0.014) | TCGA-EK-A2R8-01 | Cervix | cervical & endocervical cancer | Female | <65 | I/II | Unknown | Unknown | SD | |
| FUCA2 | SNV | Missense_Mutation | novel | c.1005N>A | p.Met335Ile | p.M335I | Q9BTY2 | protein_coding | tolerated(0.61) | benign(0.07) | TCGA-VS-A958-01 | Cervix | cervical & endocervical cancer | Female | <65 | I/II | Chemotherapy | cisplatin | CR |
| FUCA2 | SNV | Missense_Mutation | c.648N>C | p.Leu216Phe | p.L216F | Q9BTY2 | protein_coding | deleterious(0) | probably_damaging(0.976) | TCGA-CA-6718-01 | Colorectum | colon adenocarcinoma | Male | <65 | I/II | Unknown | Unknown | PD | |
| FUCA2 | SNV | Missense_Mutation | c.246N>T | p.Lys82Asn | p.K82N | Q9BTY2 | protein_coding | tolerated(0.24) | benign(0.057) | TCGA-CA-6718-01 | Colorectum | colon adenocarcinoma | Male | <65 | I/II | Unknown | Unknown | PD |
| Page: 1 2 3 4 5 |
Top |
Related drugs of malignant transformation related genes |
| Identification of chemicals and drugs interact with genes involved in malignant transfromation |
| (DGIdb 4.0) |
| Entrez ID | Symbol | Category | Interaction Types | Drug Claim Name | Drug Name | PMIDs |
| Page: 1 |

Copyright 2023-Present -The University of Texas Health Science Center at Houston |