
|
|||||
|
 | |
| |
| |
| |
| |
| |
|
Gene: FUCA1 |
Gene summary for FUCA1 |
| Gene information | Species | Human | Gene symbol | FUCA1 | Gene ID | 2517 |
| Gene name | alpha-L-fucosidase 1 | |
| Gene Alias | FUCA | |
| Cytomap | 1p36.11 | |
| Gene Type | protein-coding | GO ID | GO:0005975 | UniProtAcc | P04066 |
Top |
Malignant transformation analysis |
| Identification of the aberrant gene expression in precancerous and cancerous lesions by comparing the gene expression of stem-like cells in diseased tissues with normal stem cells |
| Entrez ID | Symbol | Replicates | Species | Organ | Tissue | Adj P-value | Log2FC | Malignancy |
| 2517 | FUCA1 | HTA11_3410_2000001011 | Human | Colorectum | AD | 3.16e-04 | 5.22e-02 | 0.0155 |
| 2517 | FUCA1 | HTA11_2487_2000001011 | Human | Colorectum | SER | 9.40e-16 | 5.40e-01 | -0.1808 |
| 2517 | FUCA1 | HTA11_1938_2000001011 | Human | Colorectum | AD | 4.30e-15 | 6.17e-01 | -0.0811 |
| 2517 | FUCA1 | HTA11_78_2000001011 | Human | Colorectum | AD | 1.85e-19 | 6.44e-01 | -0.1088 |
| 2517 | FUCA1 | HTA11_347_2000001011 | Human | Colorectum | AD | 3.70e-41 | 9.19e-01 | -0.1954 |
| 2517 | FUCA1 | HTA11_411_2000001011 | Human | Colorectum | SER | 7.99e-05 | 6.81e-01 | -0.2602 |
| 2517 | FUCA1 | HTA11_3361_2000001011 | Human | Colorectum | AD | 1.59e-02 | 2.14e-01 | -0.1207 |
| 2517 | FUCA1 | HTA11_83_2000001011 | Human | Colorectum | SER | 4.69e-17 | 7.48e-01 | -0.1526 |
| 2517 | FUCA1 | HTA11_696_2000001011 | Human | Colorectum | AD | 1.33e-05 | 3.59e-01 | -0.1464 |
| 2517 | FUCA1 | HTA11_1391_2000001011 | Human | Colorectum | AD | 1.93e-15 | 5.02e-01 | -0.059 |
| 2517 | FUCA1 | HTA11_2992_2000001011 | Human | Colorectum | SER | 7.63e-05 | 5.32e-01 | -0.1706 |
| 2517 | FUCA1 | HTA11_5212_2000001011 | Human | Colorectum | AD | 6.74e-17 | 1.18e+00 | -0.2061 |
| 2517 | FUCA1 | HTA11_5216_2000001011 | Human | Colorectum | SER | 1.94e-05 | 6.32e-01 | -0.1462 |
| 2517 | FUCA1 | HTA11_546_2000001011 | Human | Colorectum | AD | 4.26e-05 | 3.47e-01 | -0.0842 |
| 2517 | FUCA1 | HTA11_866_3004761011 | Human | Colorectum | AD | 8.80e-07 | 2.30e-01 | 0.096 |
| 2517 | FUCA1 | HTA11_10623_2000001011 | Human | Colorectum | AD | 5.50e-05 | 4.01e-01 | -0.0177 |
| 2517 | FUCA1 | HTA11_7469_2000001011 | Human | Colorectum | AD | 4.13e-02 | 3.85e-01 | -0.0124 |
| 2517 | FUCA1 | HTA11_6818_2000001021 | Human | Colorectum | AD | 2.53e-02 | 1.31e-01 | 0.0588 |
| 2517 | FUCA1 | HTA11_99999965104_69814 | Human | Colorectum | MSS | 4.50e-02 | 1.32e-01 | 0.281 |
| 2517 | FUCA1 | HTA11_99999971662_82457 | Human | Colorectum | MSS | 3.75e-03 | 2.89e-01 | 0.3859 |
| Page: 1 2 3 4 5 |
| Tissue | Expression Dynamics | Abbreviation |
| Colorectum (GSE201348) | 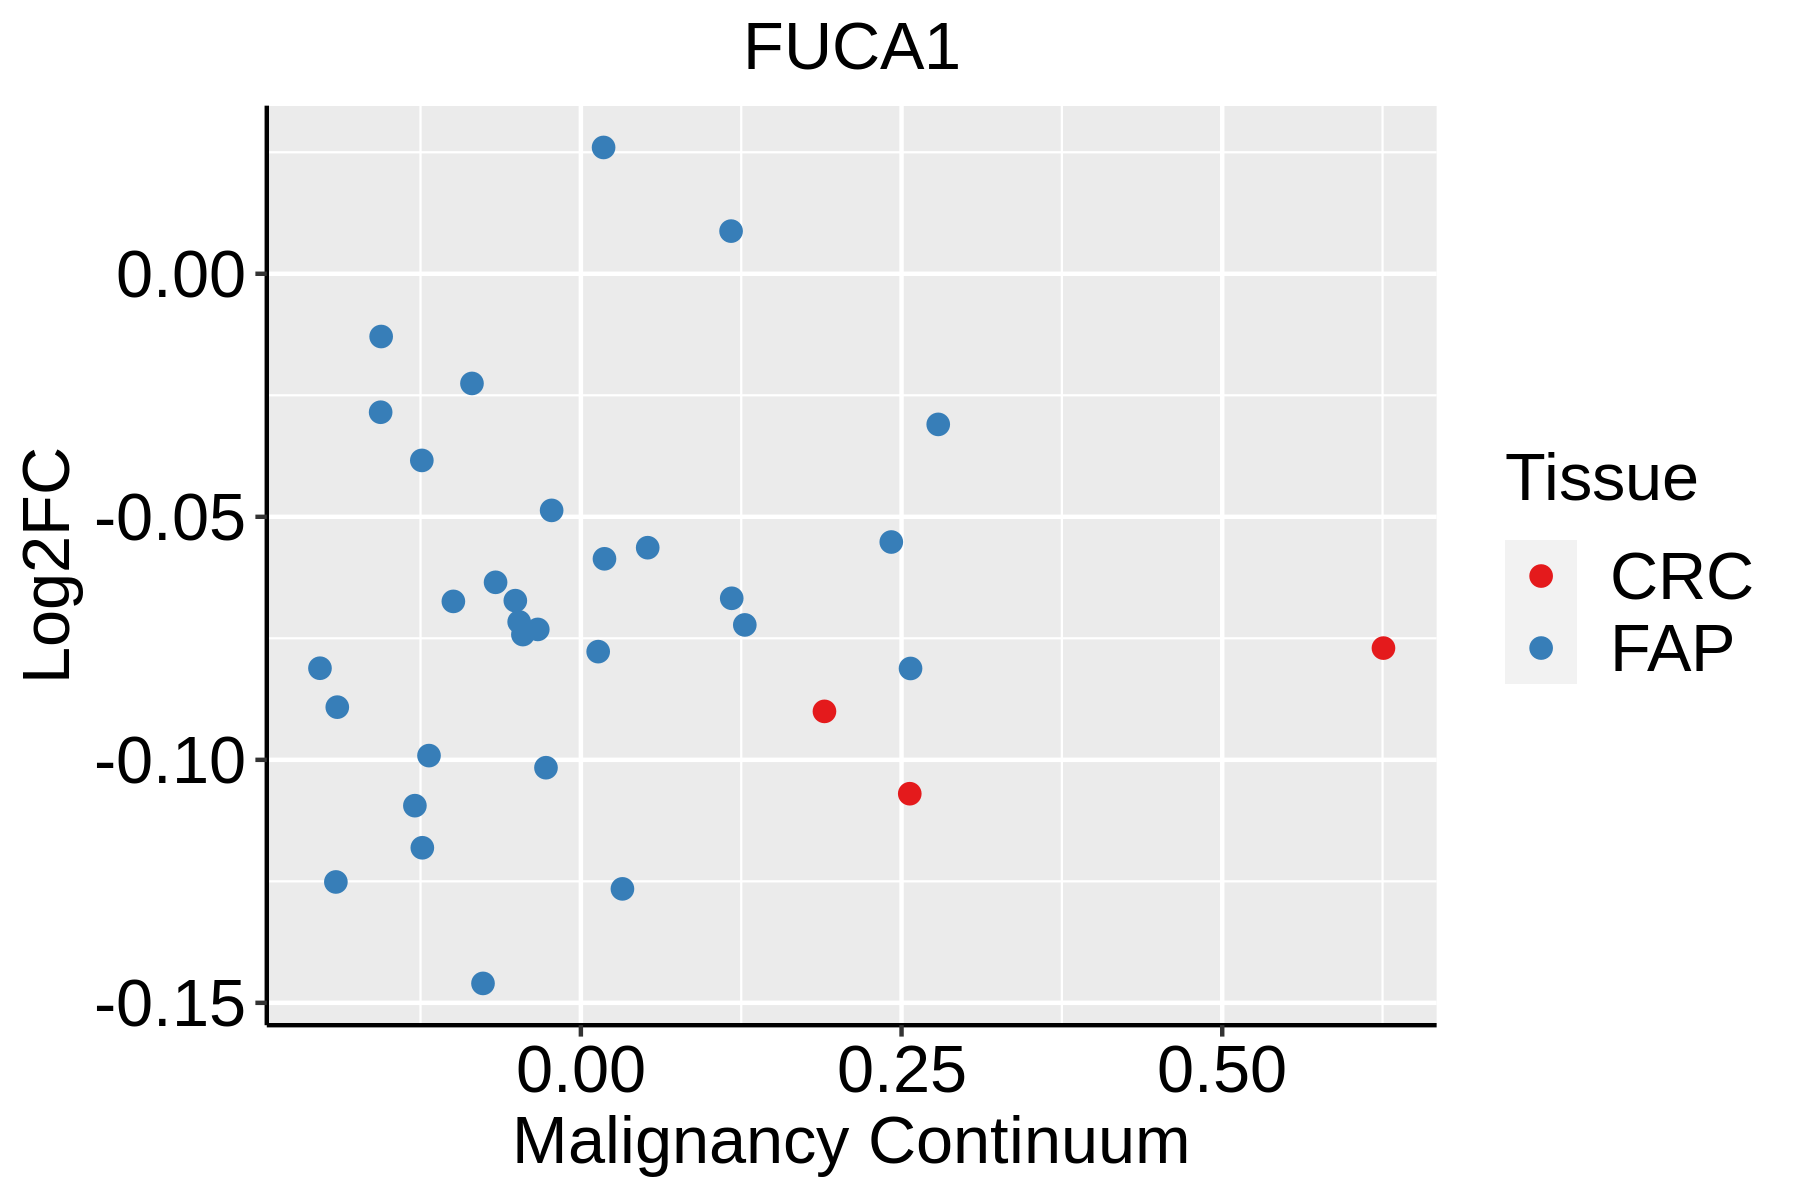 | FAP: Familial adenomatous polyposis |
| CRC: Colorectal cancer | ||
| Colorectum (HTA11) |  | AD: Adenomas |
| SER: Sessile serrated lesions | ||
| MSI-H: Microsatellite-high colorectal cancer | ||
| MSS: Microsatellite stable colorectal cancer | ||
| Esophagus | 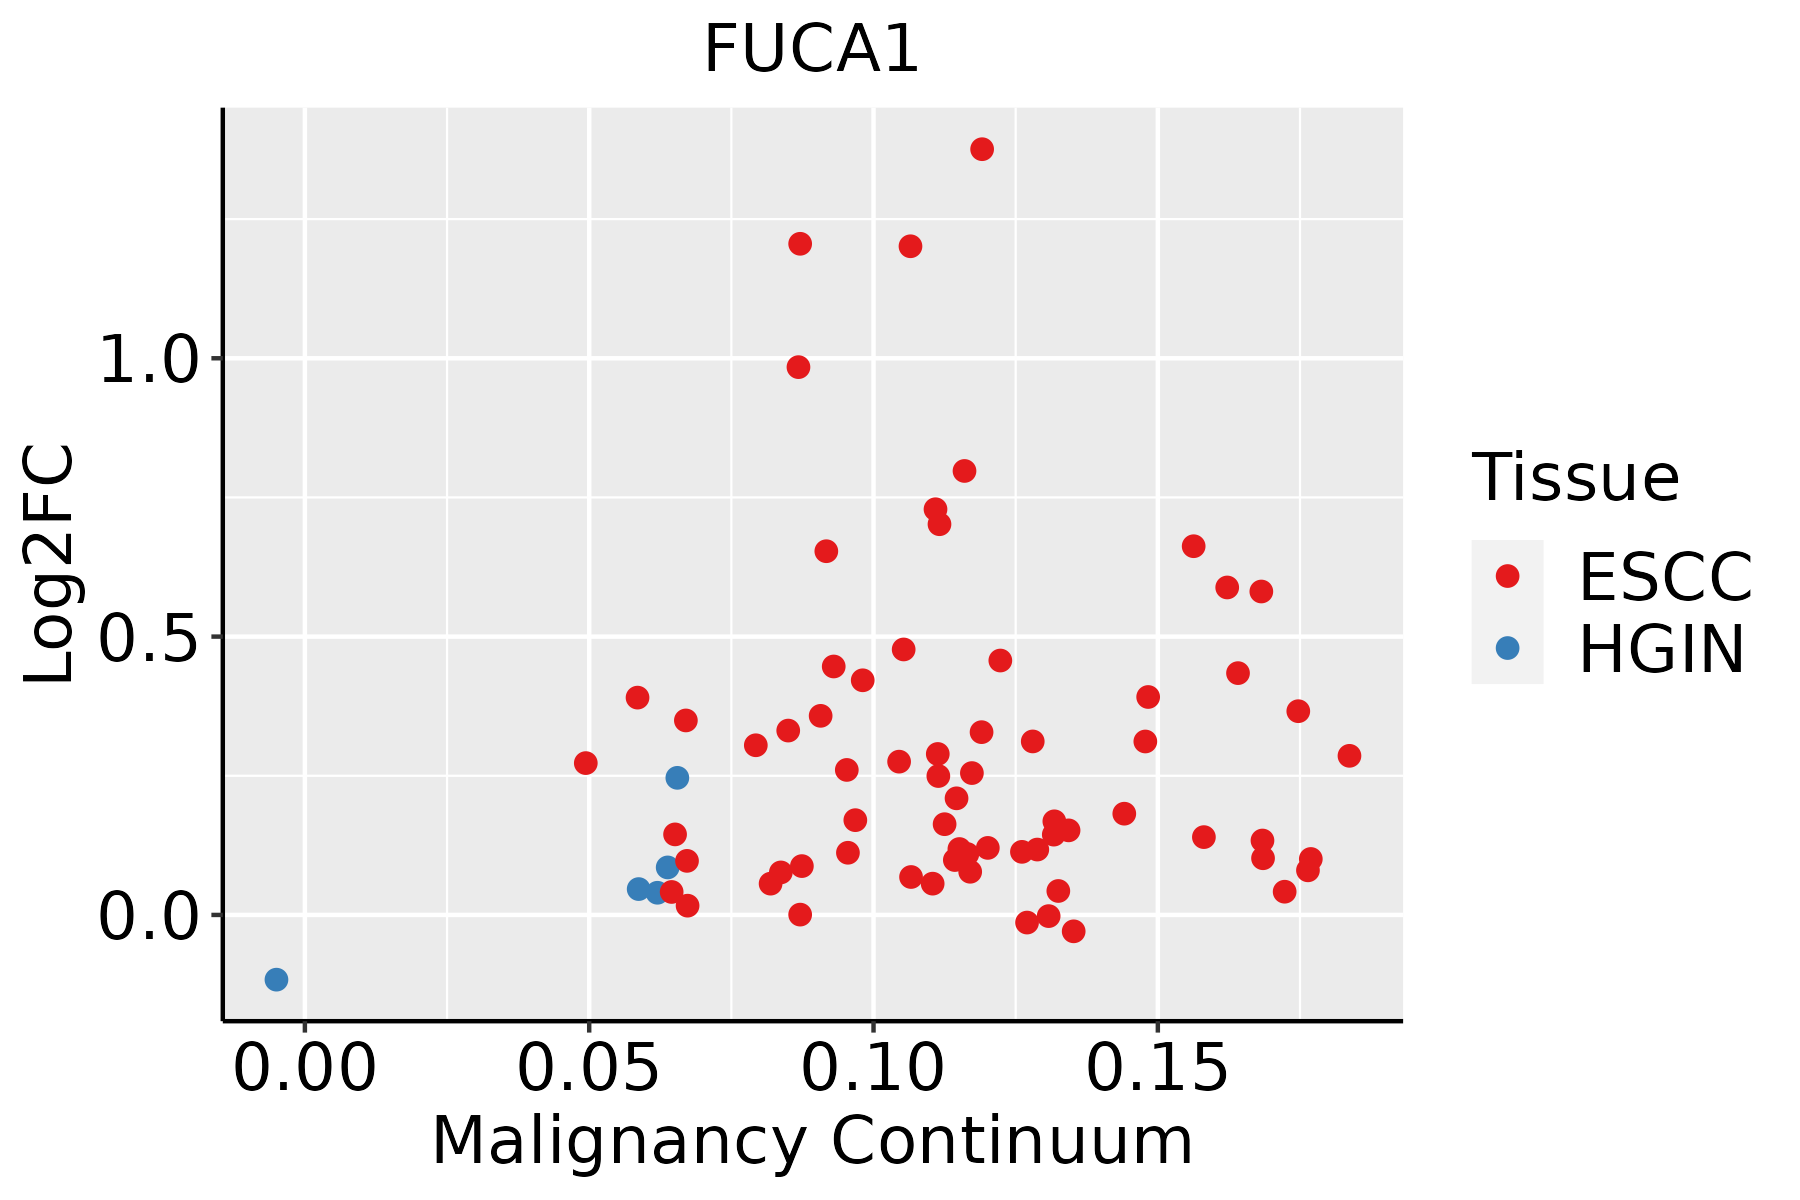 | ESCC: Esophageal squamous cell carcinoma |
| HGIN: High-grade intraepithelial neoplasias | ||
| LGIN: Low-grade intraepithelial neoplasias | ||
| Liver | 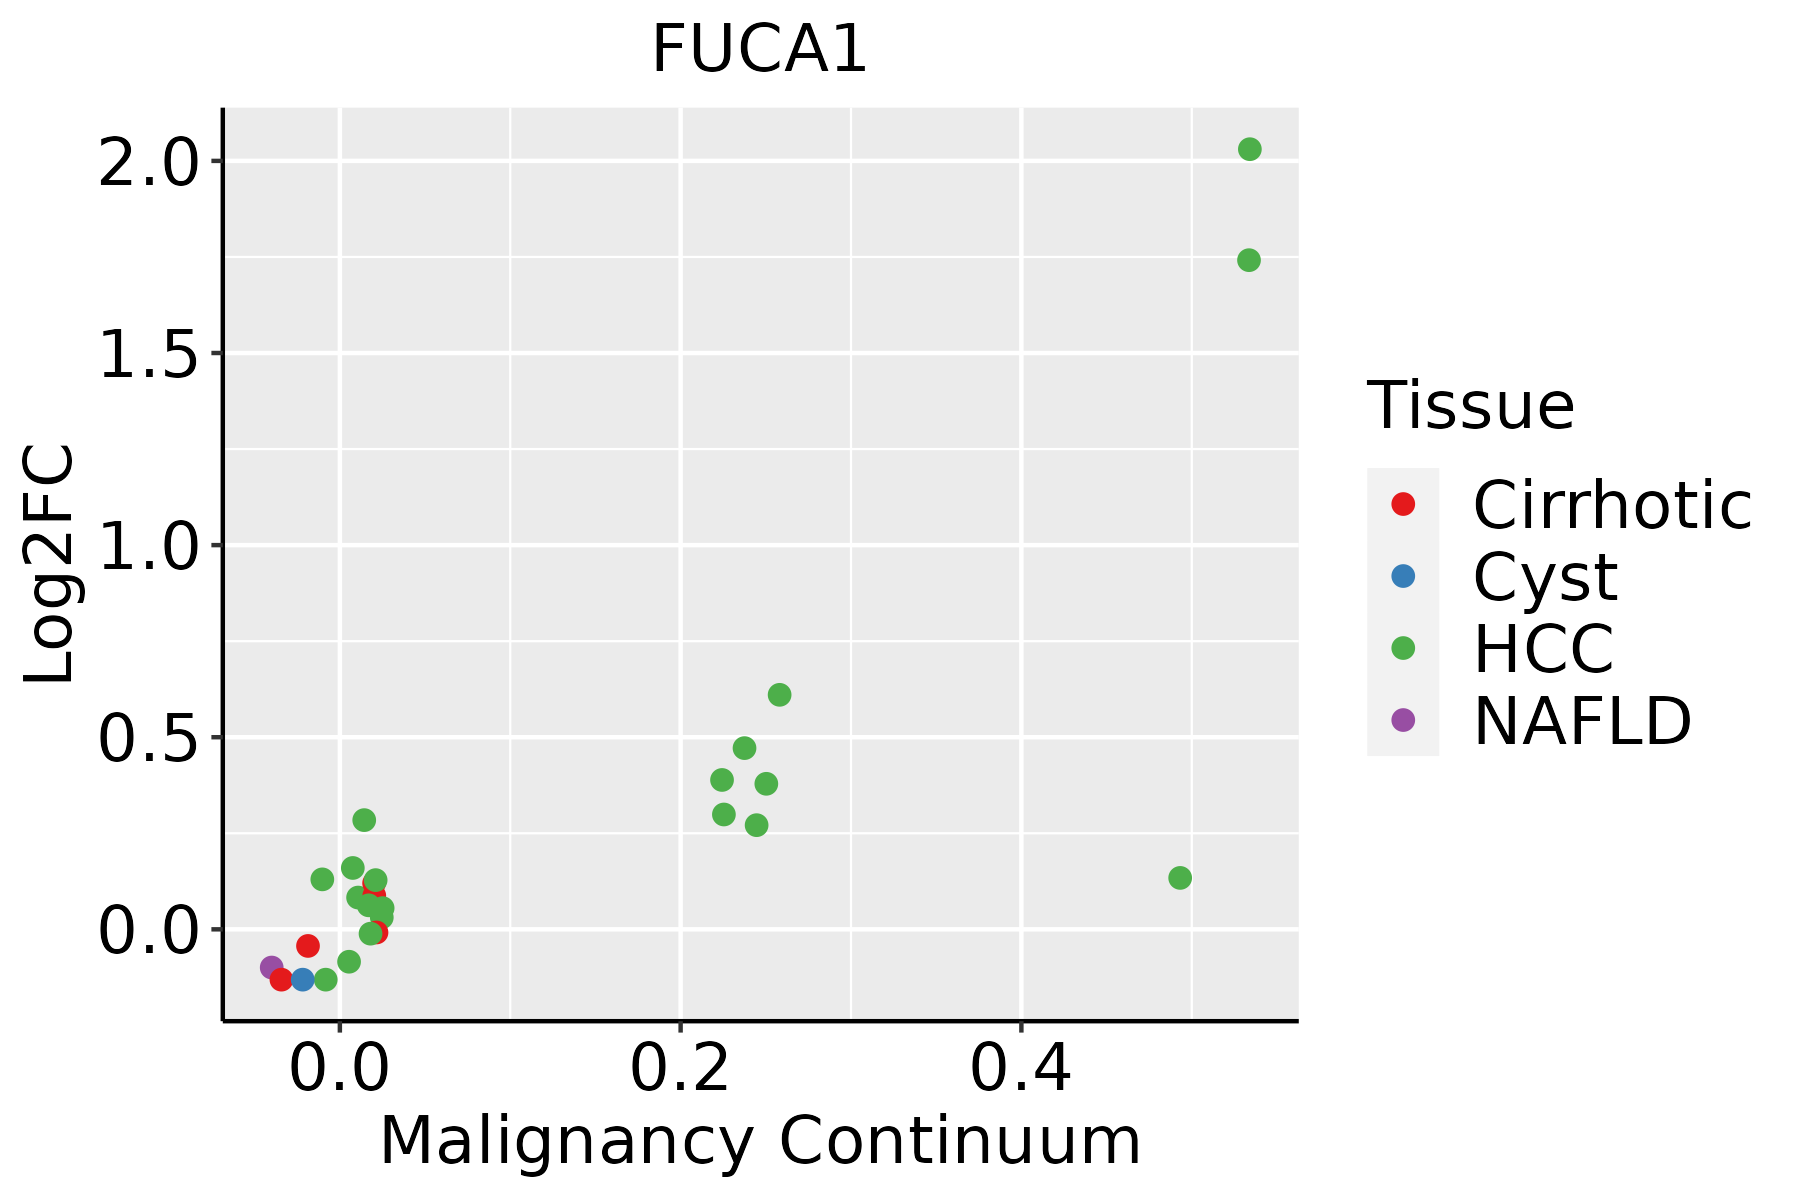 | HCC: Hepatocellular carcinoma |
| NAFLD: Non-alcoholic fatty liver disease | ||
| Thyroid |  | ATC: Anaplastic thyroid cancer |
| HT: Hashimoto's thyroiditis | ||
| PTC: Papillary thyroid cancer |
| ∗log2FC in expression of this searched gene in stem-like cells from each diseased tissue sample relative to stem-like cells in normal samples in each tissue plotted against the malignancy continuum. Samples are colored based on if they are from different disease stage. |
Top |
Malignant transformation related pathway analysis |
| Find out the enriched GO biological processes and KEGG pathways involved in transition from healthy to precancer to cancer |
| Tissue | Disease Stage | Enriched GO biological Processes |
| Colorectum | AD |  |
| Colorectum | SER |  |
| Colorectum | MSS |  |
| Colorectum | MSI-H |  |
| Colorectum | FAP |  |
| ∗Top 15 enriched GO BP terms are showed in the bar plot of each disease state in each tissue. Each row represents a significant GO biological process which is colored according to the -log10(p.adjust). |
| Page: 1 2 3 4 5 6 7 8 9 |
| GO ID | Tissue | Disease Stage | Description | Gene Ratio | Bg Ratio | pvalue | p.adjust | Count |
| GO:0019318 | Colorectum | AD | hexose metabolic process | 77/3918 | 237/18723 | 1.96e-05 | 4.01e-04 | 77 |
| GO:0016042 | Colorectum | AD | lipid catabolic process | 97/3918 | 320/18723 | 4.31e-05 | 7.56e-04 | 97 |
| GO:0005996 | Colorectum | AD | monosaccharide metabolic process | 80/3918 | 257/18723 | 7.31e-05 | 1.17e-03 | 80 |
| GO:0044242 | Colorectum | AD | cellular lipid catabolic process | 66/3918 | 214/18723 | 3.96e-04 | 4.50e-03 | 66 |
| GO:00160421 | Colorectum | SER | lipid catabolic process | 77/2897 | 320/18723 | 3.52e-05 | 9.18e-04 | 77 |
| GO:00193181 | Colorectum | SER | hexose metabolic process | 56/2897 | 237/18723 | 6.19e-04 | 8.42e-03 | 56 |
| GO:00442421 | Colorectum | SER | cellular lipid catabolic process | 51/2897 | 214/18723 | 8.60e-04 | 1.05e-02 | 51 |
| GO:00059961 | Colorectum | SER | monosaccharide metabolic process | 59/2897 | 257/18723 | 9.65e-04 | 1.15e-02 | 59 |
| GO:00193182 | Colorectum | MSS | hexose metabolic process | 63/3467 | 237/18723 | 1.32e-03 | 1.25e-02 | 63 |
| GO:00059962 | Colorectum | MSS | monosaccharide metabolic process | 66/3467 | 257/18723 | 2.61e-03 | 2.06e-02 | 66 |
| GO:00160422 | Colorectum | MSS | lipid catabolic process | 77/3467 | 320/18723 | 7.43e-03 | 4.71e-02 | 77 |
| GO:00193183 | Colorectum | FAP | hexose metabolic process | 58/2622 | 237/18723 | 1.09e-05 | 3.08e-04 | 58 |
| GO:00059963 | Colorectum | FAP | monosaccharide metabolic process | 59/2622 | 257/18723 | 6.79e-05 | 1.28e-03 | 59 |
| GO:00442422 | Colorectum | FAP | cellular lipid catabolic process | 49/2622 | 214/18723 | 2.87e-04 | 3.77e-03 | 49 |
| GO:00160423 | Colorectum | FAP | lipid catabolic process | 65/2622 | 320/18723 | 1.13e-03 | 1.08e-02 | 65 |
| GO:00066433 | Esophagus | ESCC | membrane lipid metabolic process | 130/8552 | 203/18723 | 9.29e-08 | 1.54e-06 | 130 |
| GO:00059969 | Esophagus | ESCC | monosaccharide metabolic process | 159/8552 | 257/18723 | 1.11e-07 | 1.81e-06 | 159 |
| GO:00193189 | Esophagus | ESCC | hexose metabolic process | 147/8552 | 237/18723 | 2.63e-07 | 3.94e-06 | 147 |
| GO:19016574 | Esophagus | ESCC | glycosyl compound metabolic process | 57/8552 | 88/18723 | 2.32e-04 | 1.44e-03 | 57 |
| GO:00066642 | Esophagus | ESCC | glycolipid metabolic process | 63/8552 | 100/18723 | 3.55e-04 | 2.06e-03 | 63 |
| Page: 1 2 3 |
| Pathway ID | Tissue | Disease Stage | Description | Gene Ratio | Bg Ratio | pvalue | p.adjust | qvalue | Count |
| hsa04142 | Colorectum | SER | Lysosome | 38/1580 | 132/8465 | 2.87e-03 | 2.03e-02 | 1.47e-02 | 38 |
| hsa041421 | Colorectum | SER | Lysosome | 38/1580 | 132/8465 | 2.87e-03 | 2.03e-02 | 1.47e-02 | 38 |
| hsa0414222 | Esophagus | ESCC | Lysosome | 102/4205 | 132/8465 | 5.11e-11 | 7.13e-10 | 3.65e-10 | 102 |
| hsa0414232 | Esophagus | ESCC | Lysosome | 102/4205 | 132/8465 | 5.11e-11 | 7.13e-10 | 3.65e-10 | 102 |
| hsa041424 | Liver | Cirrhotic | Lysosome | 68/2530 | 132/8465 | 1.34e-07 | 1.97e-06 | 1.21e-06 | 68 |
| hsa0414211 | Liver | Cirrhotic | Lysosome | 68/2530 | 132/8465 | 1.34e-07 | 1.97e-06 | 1.21e-06 | 68 |
| hsa041422 | Liver | HCC | Lysosome | 100/4020 | 132/8465 | 2.32e-11 | 4.31e-10 | 2.40e-10 | 100 |
| hsa00511 | Liver | HCC | Other glycan degradation | 15/4020 | 18/8465 | 1.96e-03 | 6.91e-03 | 3.84e-03 | 15 |
| hsa041423 | Liver | HCC | Lysosome | 100/4020 | 132/8465 | 2.32e-11 | 4.31e-10 | 2.40e-10 | 100 |
| hsa005111 | Liver | HCC | Other glycan degradation | 15/4020 | 18/8465 | 1.96e-03 | 6.91e-03 | 3.84e-03 | 15 |
| Page: 1 |
Top |
Cell-cell communication analysis |
| Identification of potential cell-cell interactions between two cell types and their ligand-receptor pairs for different disease states |
| Ligand | Receptor | LRpair | Pathway | Tissue | Disease Stage |
| Page: 1 |
Top |
Single-cell gene regulatory network inference analysis |
| Find out the significant the regulons (TFs) and the target genes of each regulon across cell types for different disease states |
| TF | Cell Type | Tissue | Disease Stage | Target Gene | RSS | Regulon Activity |
| ∗The dot plots of a searched regulon are shown for all cell subpopulations in each disease state of each tissue based on the regulon specific score inferred using pySCENIC and by calculating the average expression. |
| Page: 1 |
Top |
Somatic mutation of malignant transformation related genes |
| Annotation of somatic variants for genes involved in malignant transformation |
| Hugo Symbol | Variant Class | Variant Classification | dbSNP RS | HGVSc | HGVSp | HGVSp Short | SWISSPROT | BIOTYPE | SIFT | PolyPhen | Tumor Sample Barcode | Tissue | Histology | Sex | Age | Stage | Therapy Types | Drugs | Outcome |
| FUCA1 | SNV | Missense_Mutation | novel | c.1231N>C | p.Glu411Gln | p.E411Q | P04066 | protein_coding | tolerated(0.21) | benign(0) | TCGA-5L-AAT1-01 | Breast | breast invasive carcinoma | Female | <65 | III/IV | Hormone Therapy | letrozol | SD |
| FUCA1 | SNV | Missense_Mutation | novel | c.566T>C | p.Phe189Ser | p.F189S | P04066 | protein_coding | deleterious(0.01) | possibly_damaging(0.596) | TCGA-A2-A25A-01 | Breast | breast invasive carcinoma | Female | <65 | I/II | Unspecific | Cytoxan | SD |
| FUCA1 | SNV | Missense_Mutation | c.456C>A | p.Asn152Lys | p.N152K | P04066 | protein_coding | deleterious(0) | possibly_damaging(0.665) | TCGA-A2-A25A-01 | Breast | breast invasive carcinoma | Female | <65 | I/II | Unspecific | Cytoxan | SD | |
| FUCA1 | SNV | Missense_Mutation | c.1318C>G | p.Leu440Val | p.L440V | P04066 | protein_coding | tolerated(0.21) | benign(0.011) | TCGA-AC-A23H-01 | Breast | breast invasive carcinoma | Female | >=65 | I/II | Unknown | Unknown | PD | |
| FUCA1 | SNV | Missense_Mutation | novel | c.566T>C | p.Phe189Ser | p.F189S | P04066 | protein_coding | deleterious(0.01) | possibly_damaging(0.596) | TCGA-AO-A1KP-01 | Breast | breast invasive carcinoma | Female | >=65 | I/II | Chemotherapy | fluorouracil | SD |
| FUCA1 | SNV | Missense_Mutation | novel | c.566N>C | p.Phe189Ser | p.F189S | P04066 | protein_coding | deleterious(0.01) | possibly_damaging(0.596) | TCGA-C8-A1HO-01 | Breast | breast invasive carcinoma | Female | <65 | III/IV | Chemotherapy | 5-fluorouracil | CR |
| FUCA1 | SNV | Missense_Mutation | novel | c.449N>G | p.Ser150Cys | p.S150C | P04066 | protein_coding | deleterious(0) | probably_damaging(0.936) | TCGA-C5-A8XJ-01 | Cervix | cervical & endocervical cancer | Female | >=65 | I/II | Chemotherapy | cisplatin | SD |
| FUCA1 | SNV | Missense_Mutation | c.490T>A | p.Leu164Met | p.L164M | P04066 | protein_coding | deleterious(0.01) | probably_damaging(0.983) | TCGA-AA-3977-01 | Colorectum | colon adenocarcinoma | Male | >=65 | I/II | Unknown | Unknown | SD | |
| FUCA1 | SNV | Missense_Mutation | c.871N>T | p.His291Tyr | p.H291Y | P04066 | protein_coding | deleterious(0) | possibly_damaging(0.836) | TCGA-F4-6570-01 | Colorectum | colon adenocarcinoma | Female | >=65 | I/II | Unknown | Unknown | SD | |
| FUCA1 | SNV | Missense_Mutation | c.1267N>T | p.Met423Leu | p.M423L | P04066 | protein_coding | tolerated(1) | benign(0) | TCGA-G4-6323-01 | Colorectum | colon adenocarcinoma | Male | <65 | I/II | Unknown | Unknown | SD |
| Page: 1 2 3 |
Top |
Related drugs of malignant transformation related genes |
| Identification of chemicals and drugs interact with genes involved in malignant transfromation |
| (DGIdb 4.0) |
| Entrez ID | Symbol | Category | Interaction Types | Drug Claim Name | Drug Name | PMIDs |
| Page: 1 |

Copyright 2023-Present -The University of Texas Health Science Center at Houston |