
|
|||||
|
 | |
| |
| |
| |
| |
| |
|
Gene: FUBP1 |
Gene summary for FUBP1 |
| Gene information | Species | Human | Gene symbol | FUBP1 | Gene ID | 8880 |
| Gene name | far upstream element binding protein 1 | |
| Gene Alias | FBP | |
| Cytomap | 1p31.1 | |
| Gene Type | protein-coding | GO ID | GO:0008150 | UniProtAcc | B4DT31 |
Top |
Malignant transformation analysis |
| Identification of the aberrant gene expression in precancerous and cancerous lesions by comparing the gene expression of stem-like cells in diseased tissues with normal stem cells |
| Entrez ID | Symbol | Replicates | Species | Organ | Tissue | Adj P-value | Log2FC | Malignancy |
| 8880 | FUBP1 | HTA11_3410_2000001011 | Human | Colorectum | AD | 9.02e-19 | -5.62e-01 | 0.0155 |
| 8880 | FUBP1 | HTA11_2487_2000001011 | Human | Colorectum | SER | 2.74e-04 | -4.07e-01 | -0.1808 |
| 8880 | FUBP1 | HTA11_3361_2000001011 | Human | Colorectum | AD | 2.59e-05 | -4.99e-01 | -0.1207 |
| 8880 | FUBP1 | HTA11_696_2000001011 | Human | Colorectum | AD | 1.45e-04 | -3.46e-01 | -0.1464 |
| 8880 | FUBP1 | HTA11_866_2000001011 | Human | Colorectum | AD | 3.22e-07 | -4.08e-01 | -0.1001 |
| 8880 | FUBP1 | HTA11_5212_2000001011 | Human | Colorectum | AD | 4.14e-04 | -6.15e-01 | -0.2061 |
| 8880 | FUBP1 | HTA11_866_3004761011 | Human | Colorectum | AD | 2.79e-05 | -3.35e-01 | 0.096 |
| 8880 | FUBP1 | HTA11_10711_2000001011 | Human | Colorectum | AD | 1.19e-05 | -4.69e-01 | 0.0338 |
| 8880 | FUBP1 | HTA11_7696_3000711011 | Human | Colorectum | AD | 2.16e-06 | -4.05e-01 | 0.0674 |
| 8880 | FUBP1 | HTA11_99999974143_84620 | Human | Colorectum | MSS | 4.89e-13 | -4.69e-01 | 0.3005 |
| 8880 | FUBP1 | F007 | Human | Colorectum | FAP | 5.48e-04 | -2.72e-01 | 0.1176 |
| 8880 | FUBP1 | A001-C-207 | Human | Colorectum | FAP | 9.12e-06 | -2.65e-01 | 0.1278 |
| 8880 | FUBP1 | A015-C-203 | Human | Colorectum | FAP | 9.95e-26 | -3.95e-01 | -0.1294 |
| 8880 | FUBP1 | A015-C-204 | Human | Colorectum | FAP | 4.72e-14 | -4.23e-01 | -0.0228 |
| 8880 | FUBP1 | A014-C-040 | Human | Colorectum | FAP | 1.08e-05 | -3.23e-01 | -0.1184 |
| 8880 | FUBP1 | A002-C-201 | Human | Colorectum | FAP | 3.44e-21 | -3.79e-01 | 0.0324 |
| 8880 | FUBP1 | A002-C-203 | Human | Colorectum | FAP | 4.00e-04 | -1.82e-01 | 0.2786 |
| 8880 | FUBP1 | A001-C-119 | Human | Colorectum | FAP | 1.77e-10 | -3.65e-01 | -0.1557 |
| 8880 | FUBP1 | A001-C-108 | Human | Colorectum | FAP | 2.95e-16 | -2.01e-01 | -0.0272 |
| 8880 | FUBP1 | A002-C-205 | Human | Colorectum | FAP | 4.09e-26 | -3.28e-01 | -0.1236 |
| Page: 1 2 3 4 5 6 7 8 9 |
| Tissue | Expression Dynamics | Abbreviation |
| Colorectum (GSE201348) | 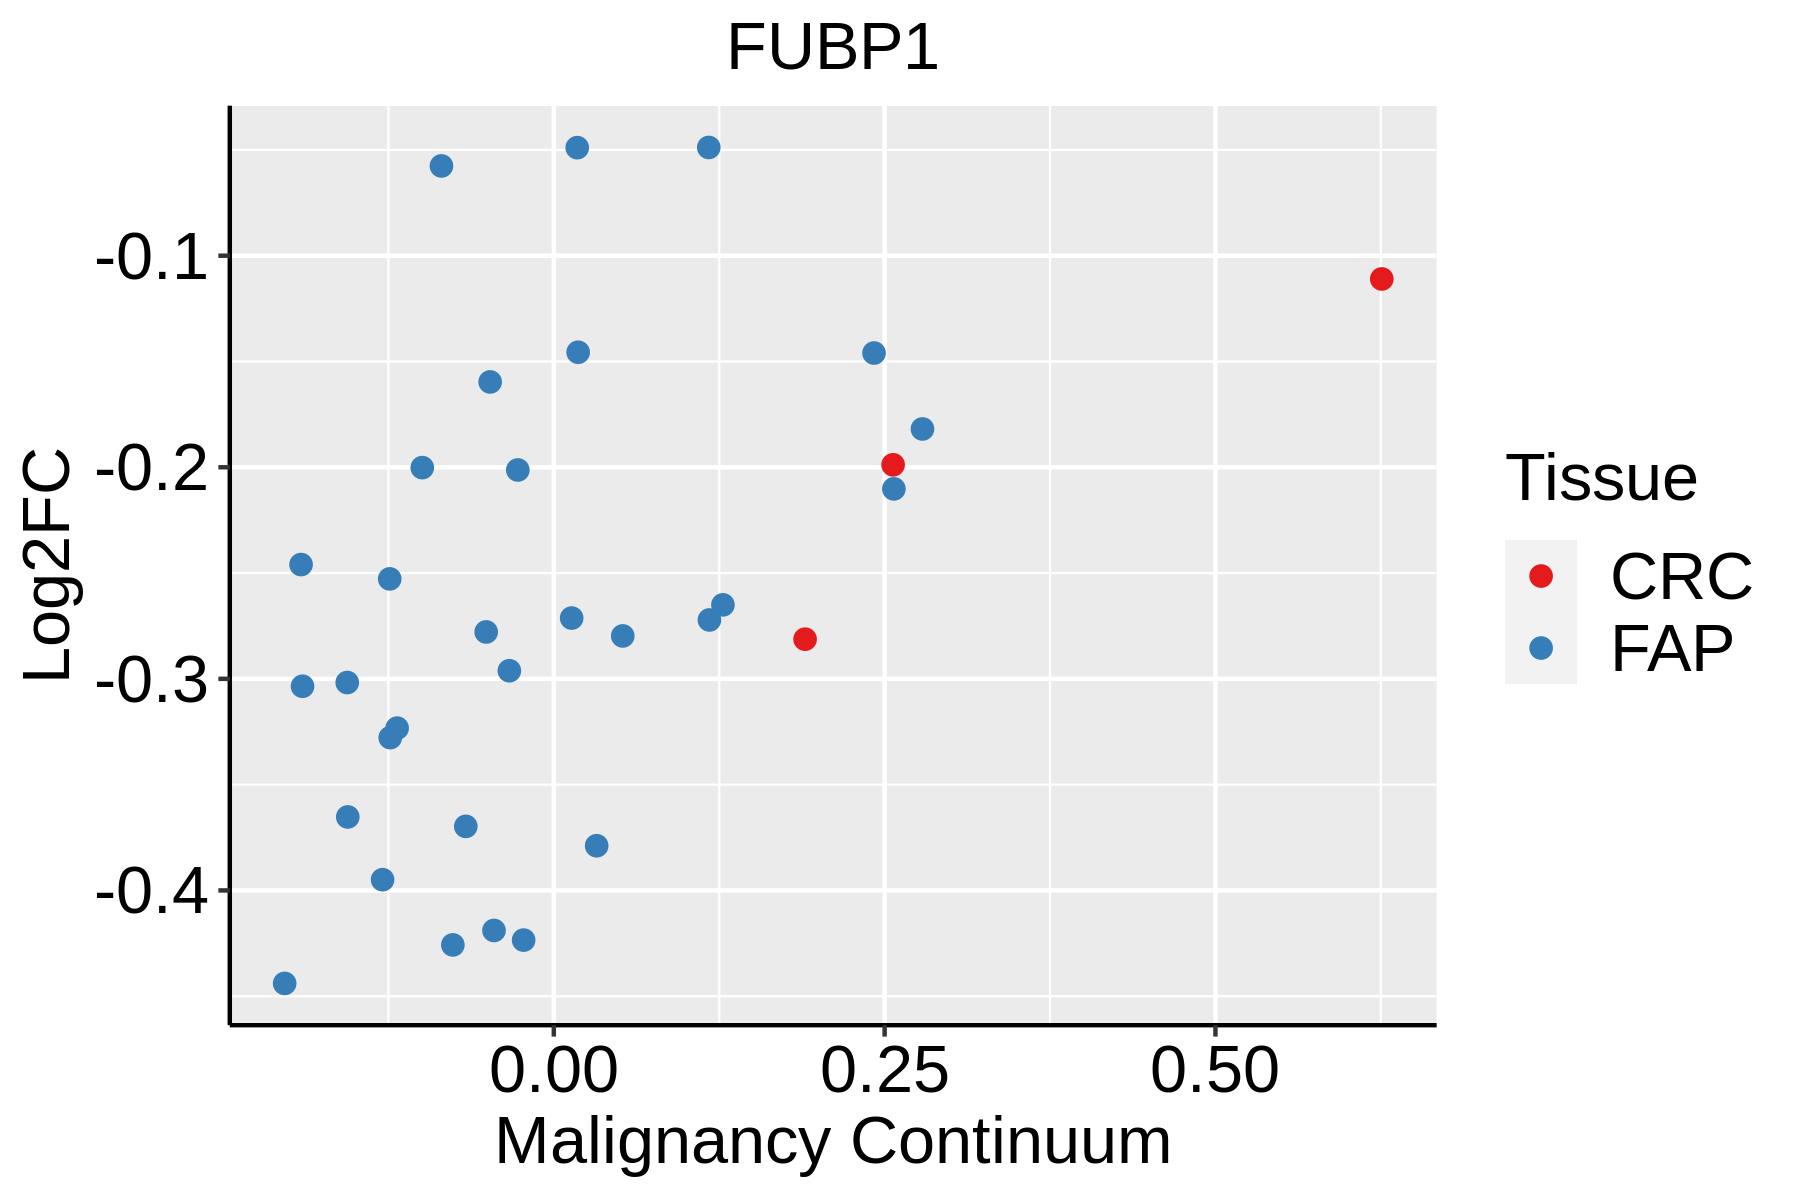 | FAP: Familial adenomatous polyposis |
| CRC: Colorectal cancer | ||
| Colorectum (HTA11) | 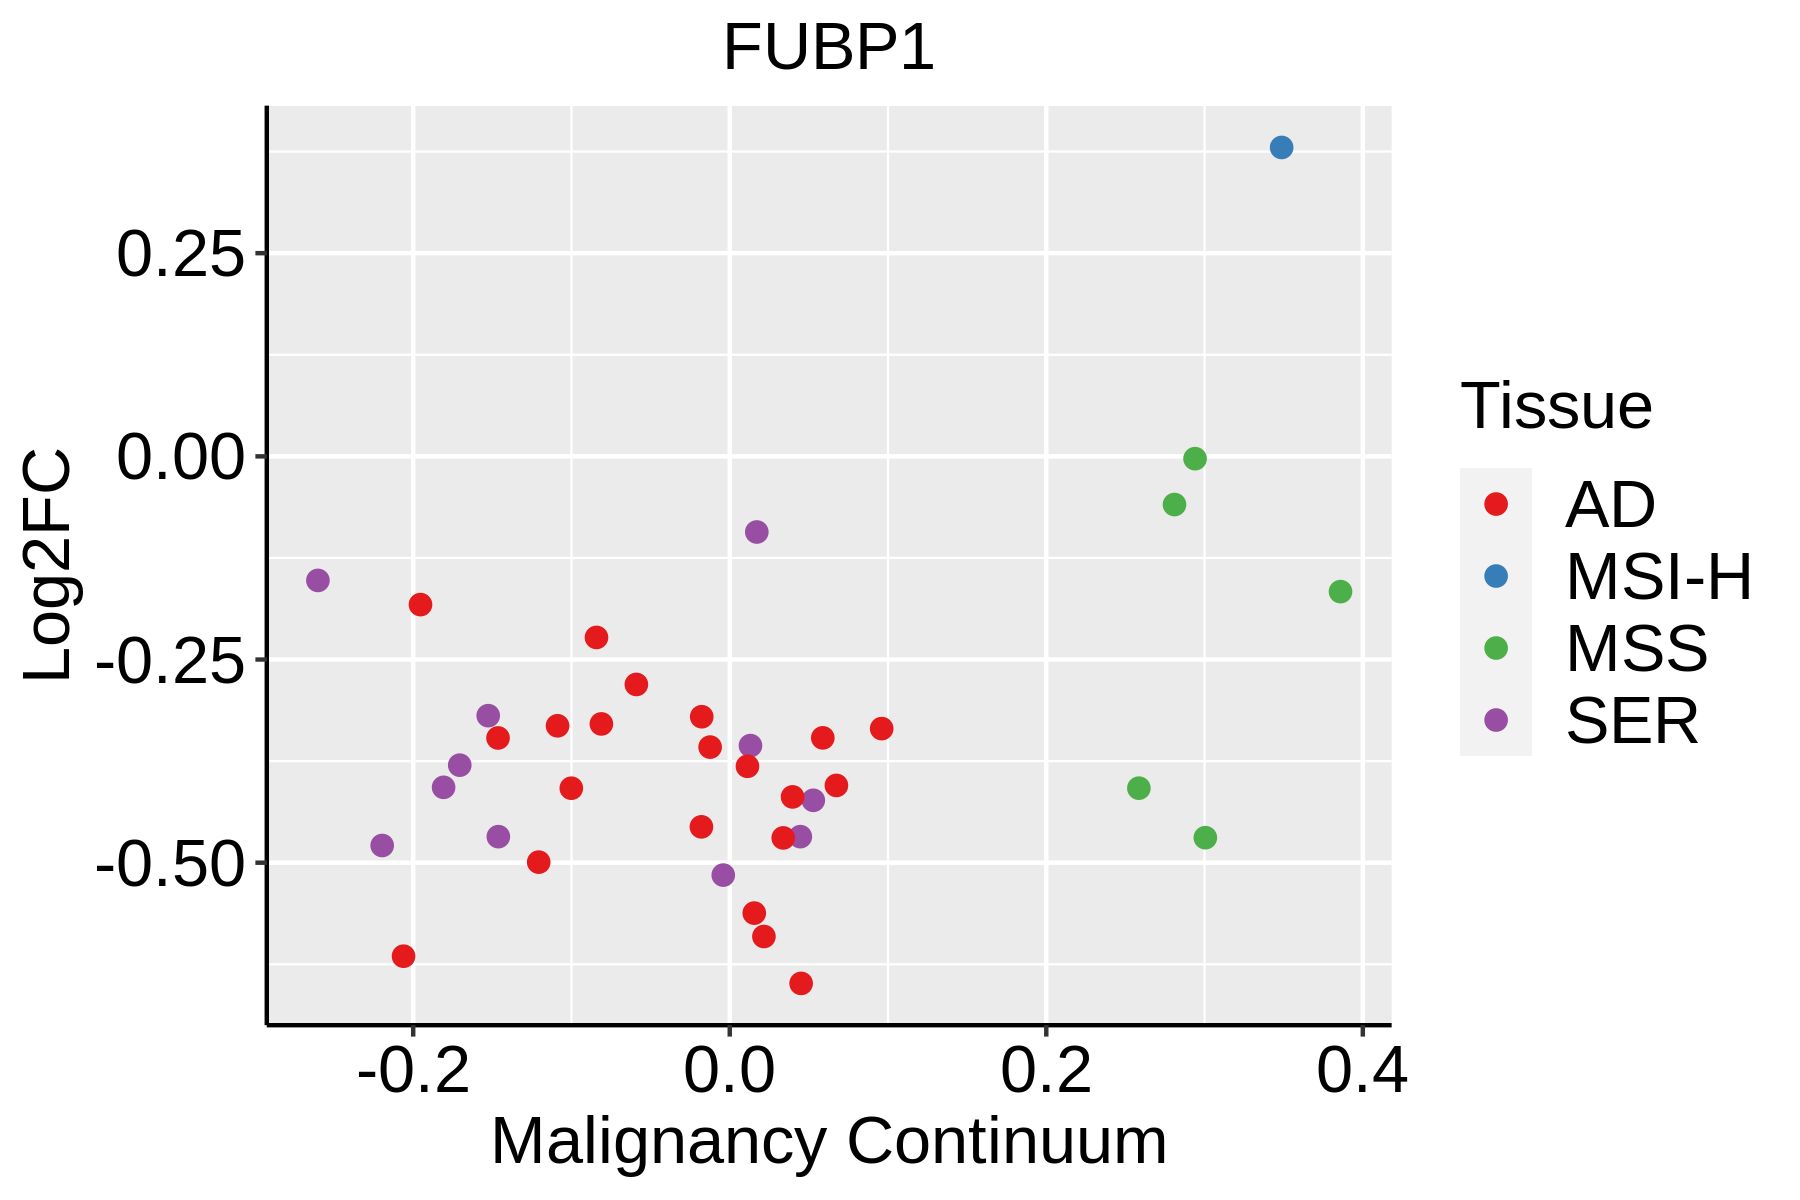 | AD: Adenomas |
| SER: Sessile serrated lesions | ||
| MSI-H: Microsatellite-high colorectal cancer | ||
| MSS: Microsatellite stable colorectal cancer | ||
| Esophagus | 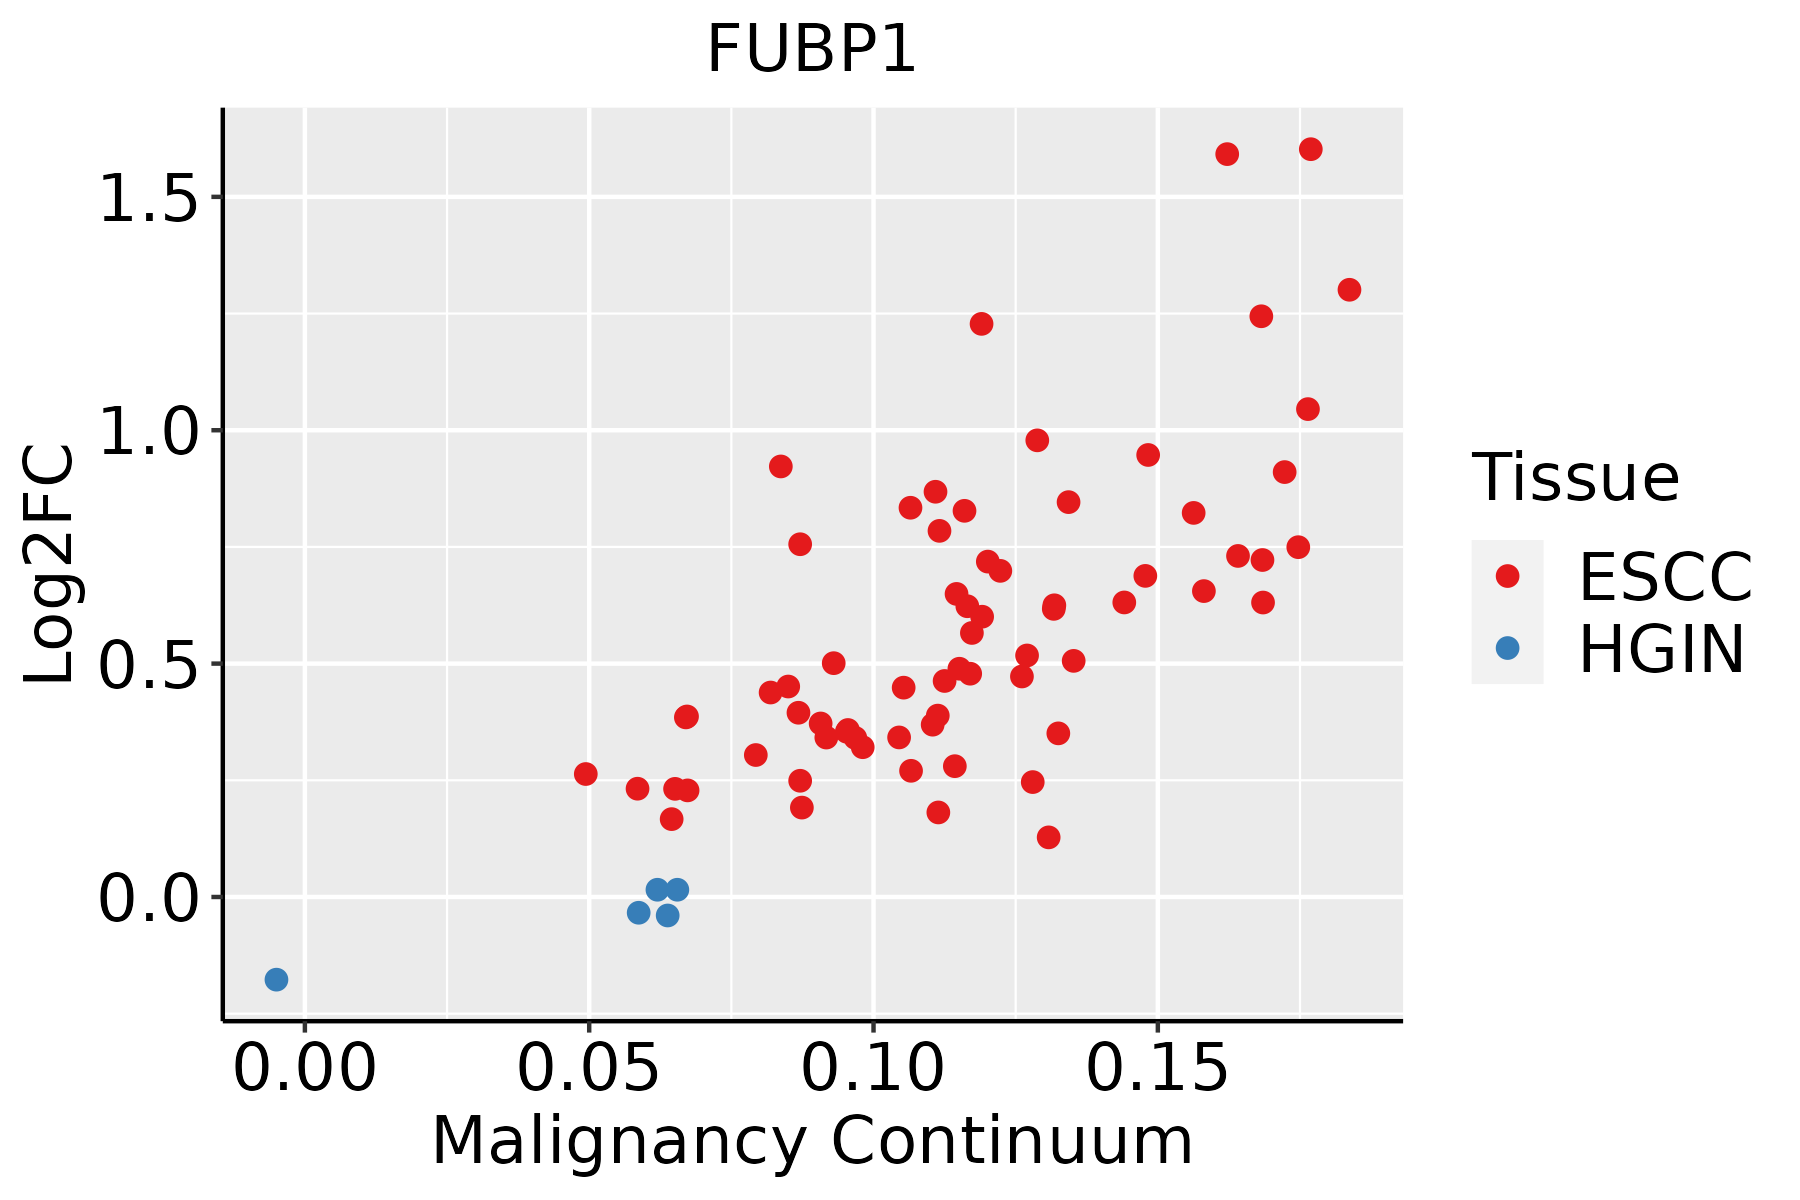 | ESCC: Esophageal squamous cell carcinoma |
| HGIN: High-grade intraepithelial neoplasias | ||
| LGIN: Low-grade intraepithelial neoplasias | ||
| Liver | 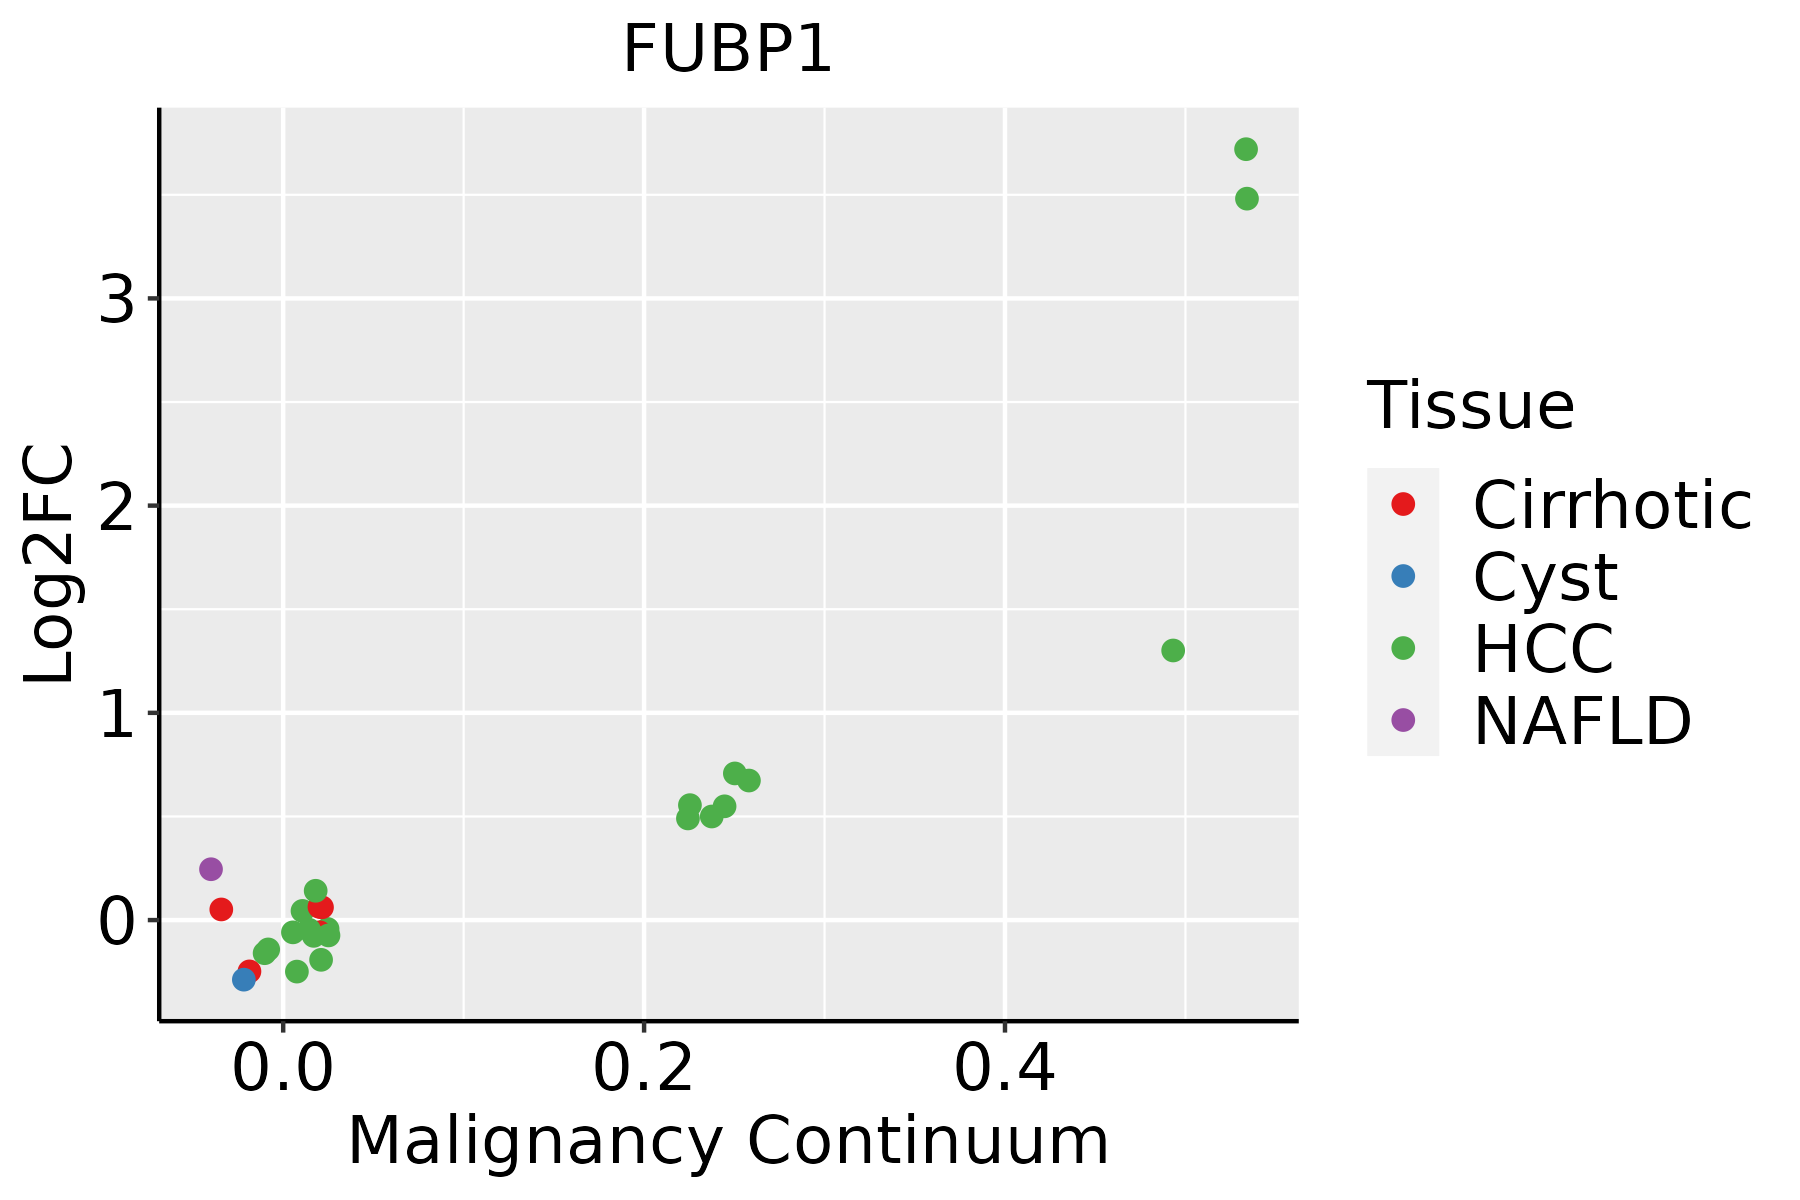 | HCC: Hepatocellular carcinoma |
| NAFLD: Non-alcoholic fatty liver disease | ||
| Lung | 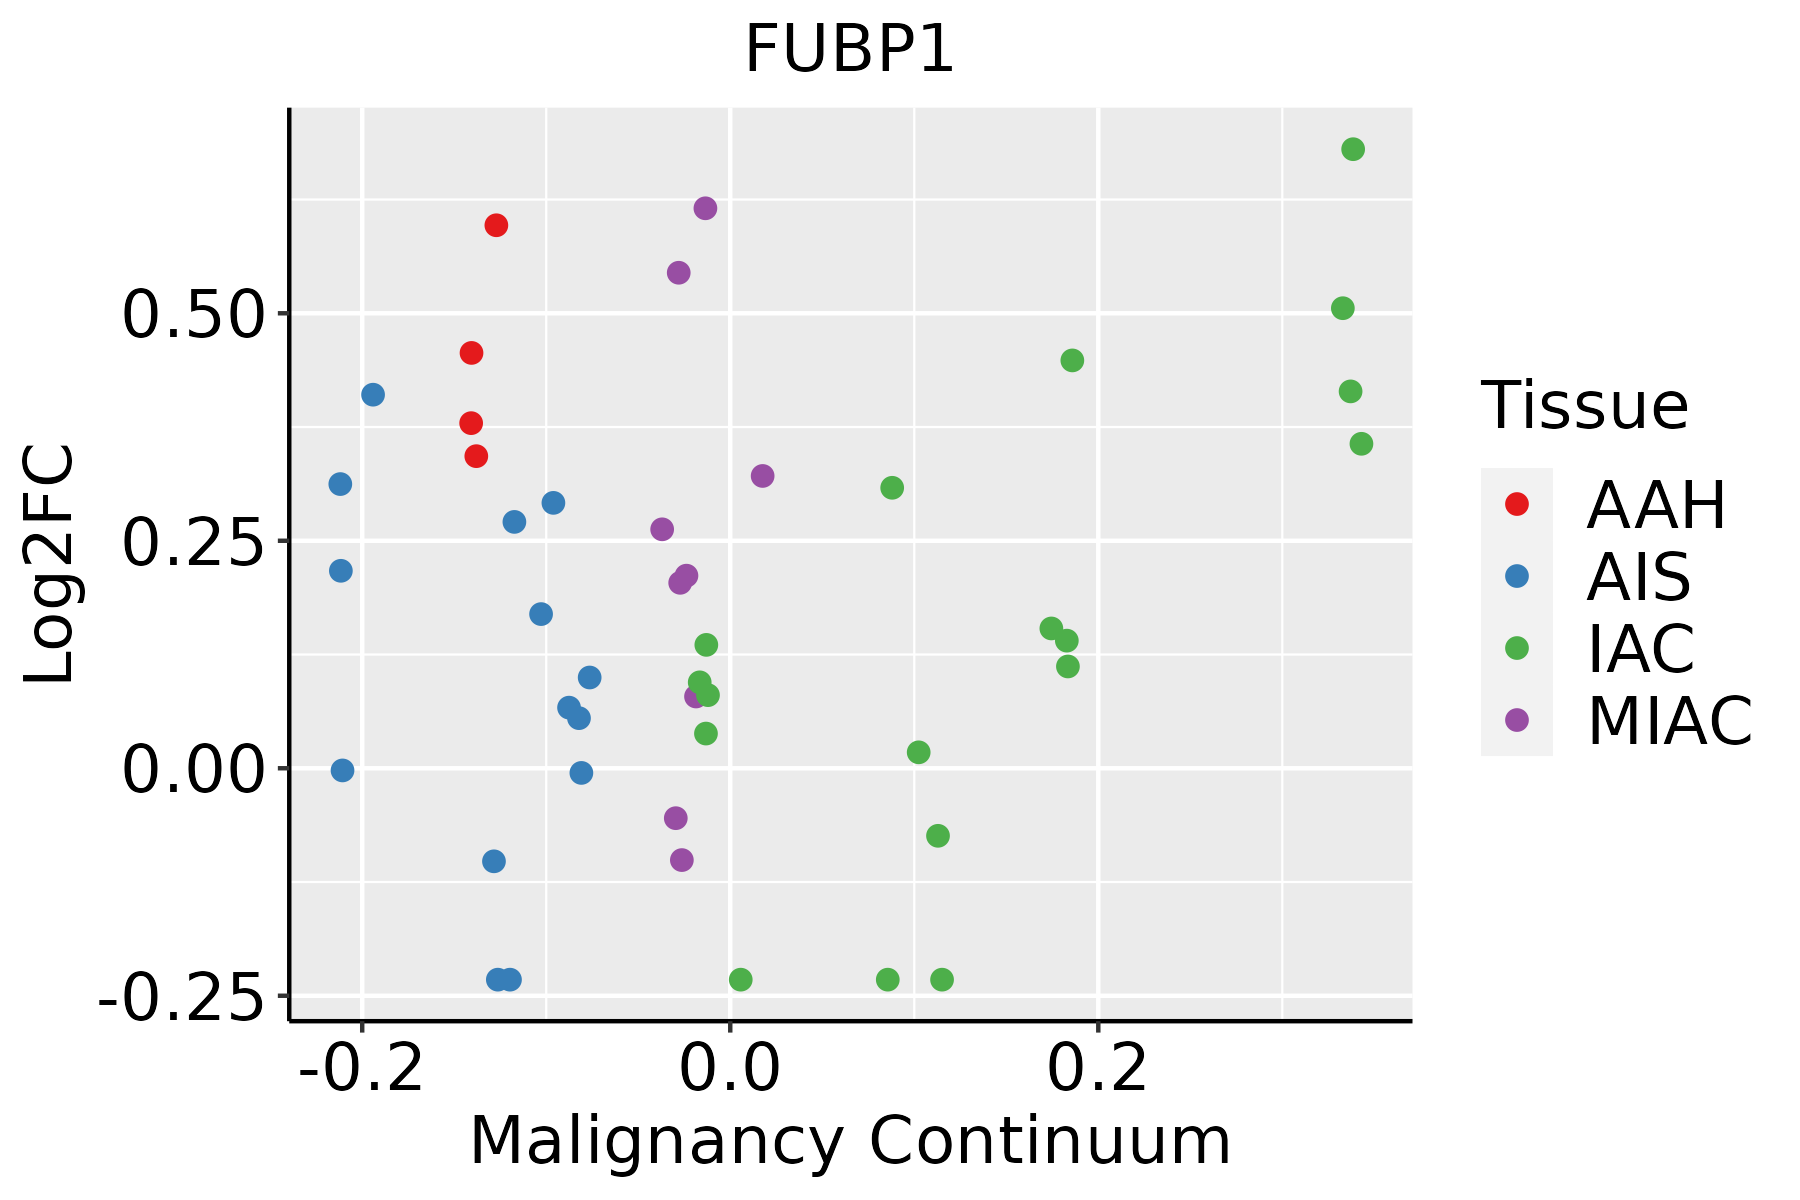 | AAH: Atypical adenomatous hyperplasia |
| AIS: Adenocarcinoma in situ | ||
| IAC: Invasive lung adenocarcinoma | ||
| MIA: Minimally invasive adenocarcinoma | ||
| Oral Cavity |  | EOLP: Erosive Oral lichen planus |
| LP: leukoplakia | ||
| NEOLP: Non-erosive oral lichen planus | ||
| OSCC: Oral squamous cell carcinoma | ||
| Skin | 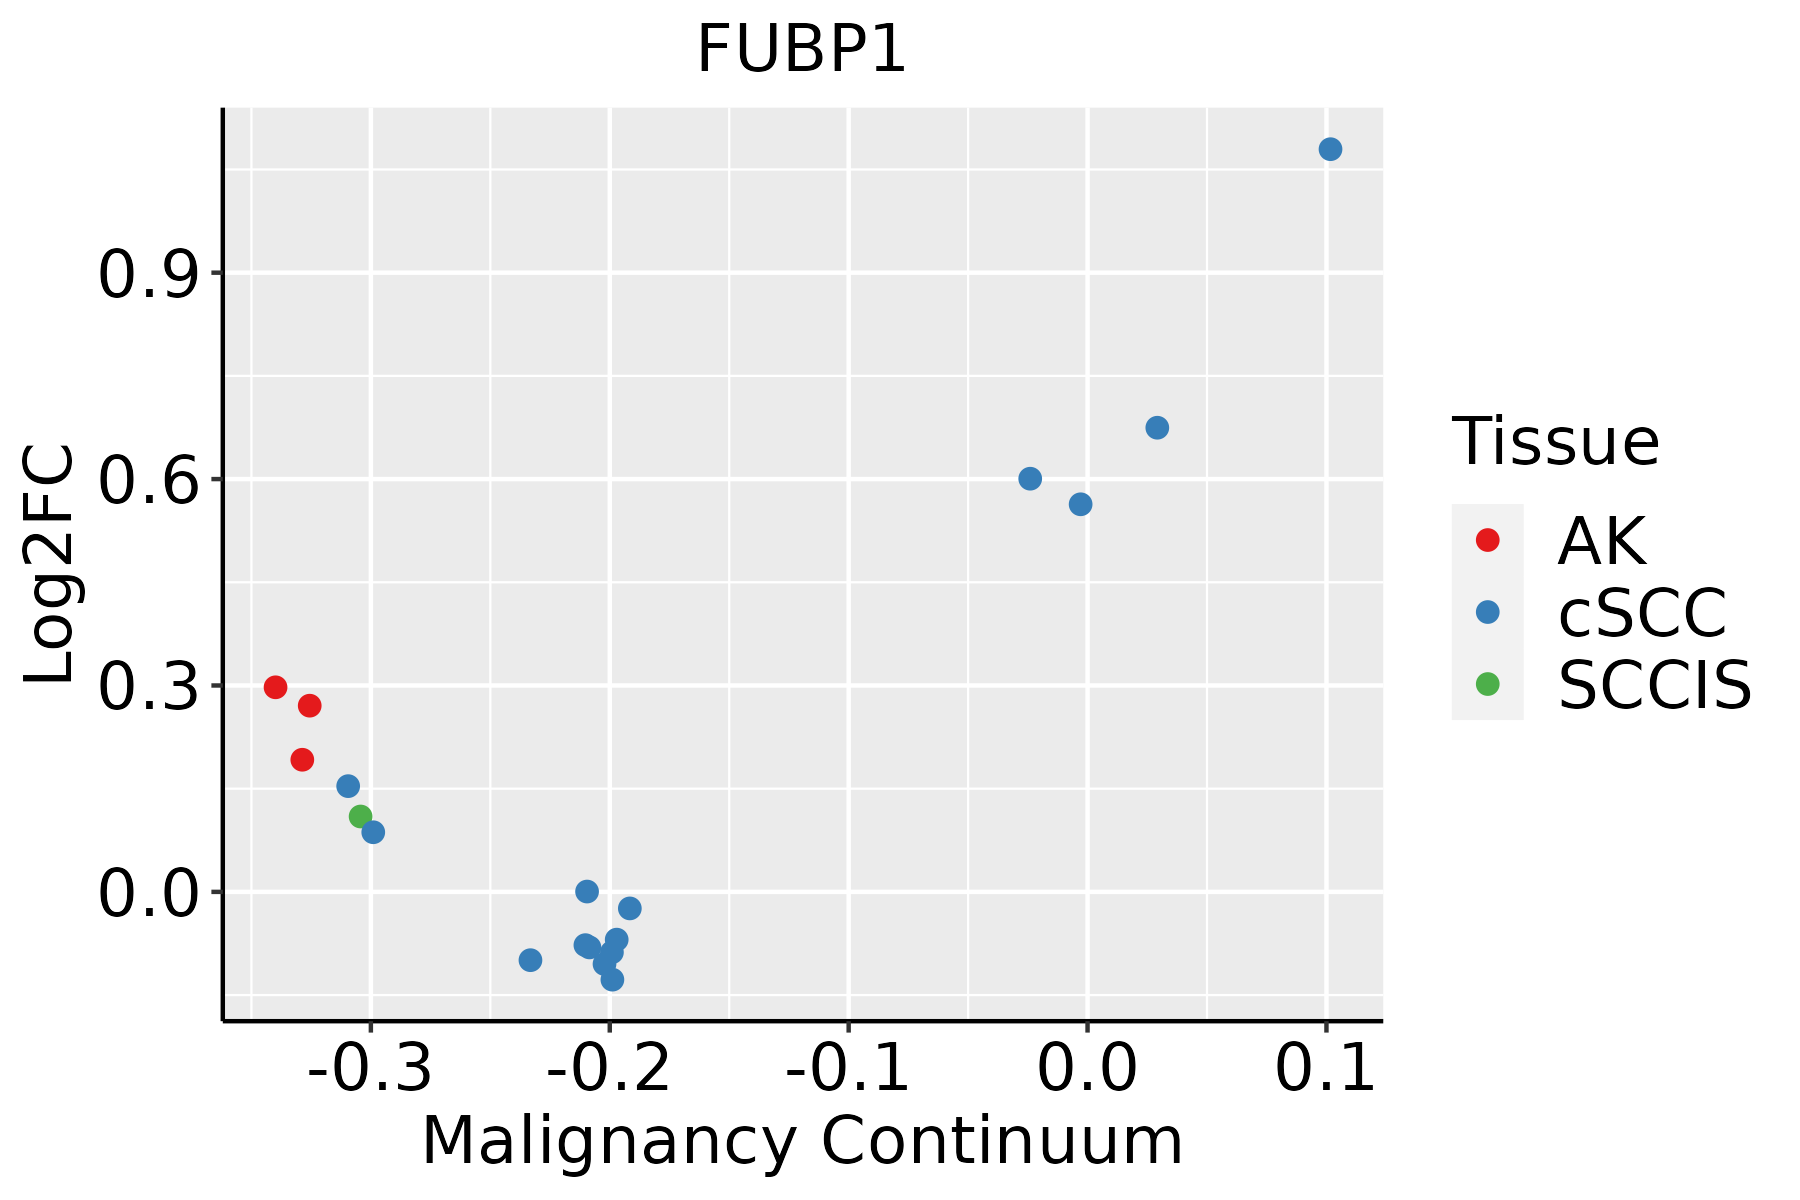 | AK: Actinic keratosis |
| cSCC: Cutaneous squamous cell carcinoma | ||
| SCCIS:squamous cell carcinoma in situ | ||
| Thyroid | 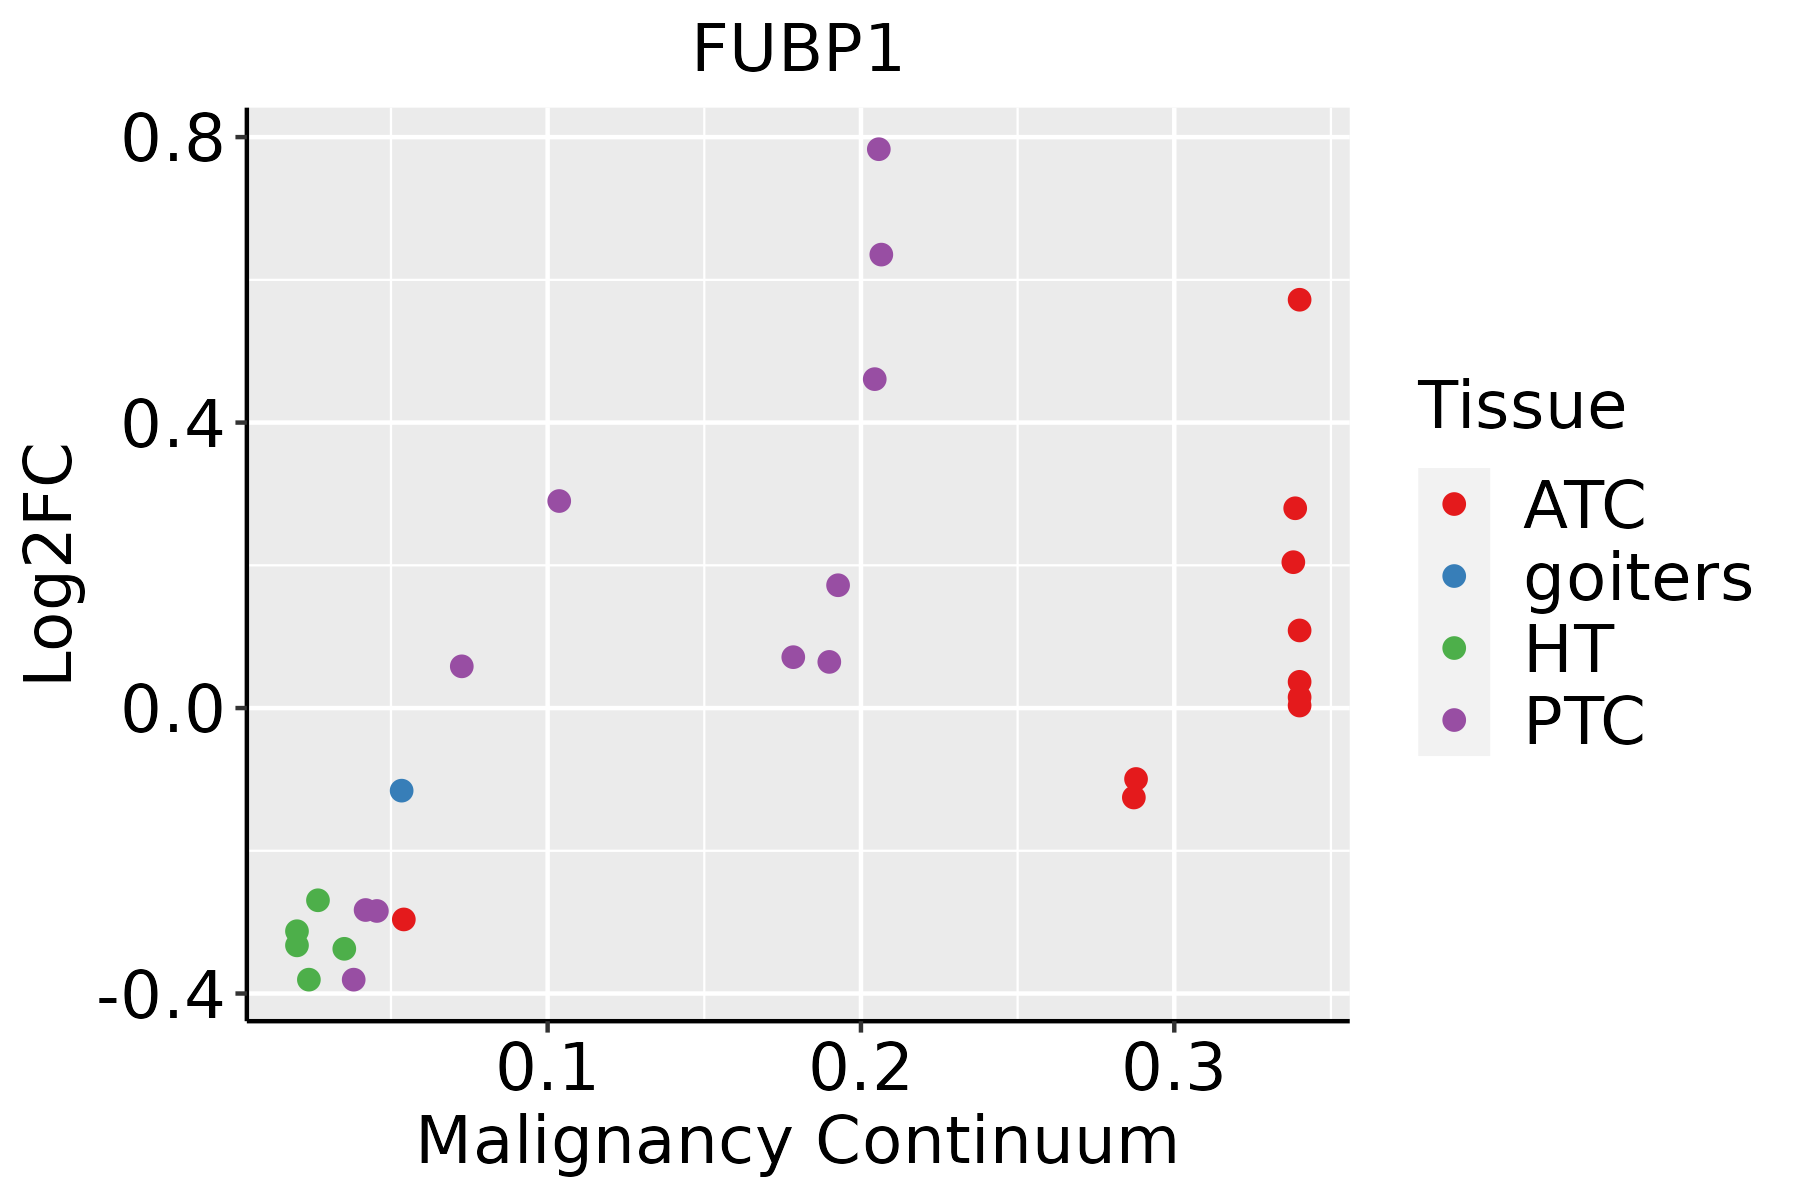 | ATC: Anaplastic thyroid cancer |
| HT: Hashimoto's thyroiditis | ||
| PTC: Papillary thyroid cancer |
| ∗log2FC in expression of this searched gene in stem-like cells from each diseased tissue sample relative to stem-like cells in normal samples in each tissue plotted against the malignancy continuum. Samples are colored based on if they are from different disease stage. |
Top |
Malignant transformation related pathway analysis |
| Find out the enriched GO biological processes and KEGG pathways involved in transition from healthy to precancer to cancer |
| Tissue | Disease Stage | Enriched GO biological Processes |
| Colorectum | AD |  |
| Colorectum | SER |  |
| Colorectum | MSS |  |
| Colorectum | MSI-H |  |
| Colorectum | FAP |  |
| ∗Top 15 enriched GO BP terms are showed in the bar plot of each disease state in each tissue. Each row represents a significant GO biological process which is colored according to the -log10(p.adjust). |
| Page: 1 2 3 4 5 6 7 8 9 |
| GO ID | Tissue | Disease Stage | Description | Gene Ratio | Bg Ratio | pvalue | p.adjust | Count |
| Page: 1 |
| Pathway ID | Tissue | Disease Stage | Description | Gene Ratio | Bg Ratio | pvalue | p.adjust | qvalue | Count |
| Page: 1 |
Top |
Cell-cell communication analysis |
| Identification of potential cell-cell interactions between two cell types and their ligand-receptor pairs for different disease states |
| Ligand | Receptor | LRpair | Pathway | Tissue | Disease Stage |
| Page: 1 |
Top |
Single-cell gene regulatory network inference analysis |
| Find out the significant the regulons (TFs) and the target genes of each regulon across cell types for different disease states |
| TF | Cell Type | Tissue | Disease Stage | Target Gene | RSS | Regulon Activity |
| ∗The dot plots of a searched regulon are shown for all cell subpopulations in each disease state of each tissue based on the regulon specific score inferred using pySCENIC and by calculating the average expression. |
| Page: 1 |
Top |
Somatic mutation of malignant transformation related genes |
| Annotation of somatic variants for genes involved in malignant transformation |
| Hugo Symbol | Variant Class | Variant Classification | dbSNP RS | HGVSc | HGVSp | HGVSp Short | SWISSPROT | BIOTYPE | SIFT | PolyPhen | Tumor Sample Barcode | Tissue | Histology | Sex | Age | Stage | Therapy Types | Drugs | Outcome |
| FUBP1 | SNV | Missense_Mutation | novel | c.997N>G | p.Gln333Glu | p.Q333E | Q96AE4 | protein_coding | tolerated(0.54) | benign(0.055) | TCGA-5L-AAT1-01 | Breast | breast invasive carcinoma | Female | <65 | III/IV | Hormone Therapy | letrozol | SD |
| FUBP1 | SNV | Missense_Mutation | c.32N>A | p.Ser11Tyr | p.S11Y | Q96AE4 | protein_coding | deleterious(0.01) | possibly_damaging(0.496) | TCGA-A2-A0YD-01 | Breast | breast invasive carcinoma | Female | <65 | I/II | Chemotherapy | cytoxan | SD | |
| FUBP1 | SNV | Missense_Mutation | c.1849G>C | p.Glu617Gln | p.E617Q | Q96AE4 | protein_coding | deleterious(0) | probably_damaging(0.982) | TCGA-AC-A23H-01 | Breast | breast invasive carcinoma | Female | >=65 | I/II | Unknown | Unknown | PD | |
| FUBP1 | SNV | Missense_Mutation | c.1902N>A | p.Met634Ile | p.M634I | Q96AE4 | protein_coding | tolerated_low_confidence(0.4) | benign(0) | TCGA-AN-A0AR-01 | Breast | breast invasive carcinoma | Female | <65 | I/II | Unknown | Unknown | SD | |
| FUBP1 | SNV | Missense_Mutation | novel | c.1741G>A | p.Asp581Asn | p.D581N | Q96AE4 | protein_coding | deleterious(0.03) | probably_damaging(0.989) | TCGA-PE-A5DE-01 | Breast | breast invasive carcinoma | Female | <65 | I/II | Chemotherapy | taxotere | CR |
| FUBP1 | insertion | Frame_Shift_Ins | novel | c.88_89insT | p.Ala30ValfsTer19 | p.A30Vfs*19 | Q96AE4 | protein_coding | TCGA-A7-A0CJ-01 | Breast | breast invasive carcinoma | Female | <65 | I/II | Chemotherapy | cytoxan | SD | ||
| FUBP1 | insertion | Frame_Shift_Ins | novel | c.87_88insATTGCTGTTCTTCTATACACAATAAG | p.Ala30IlefsTer33 | p.A30Ifs*33 | Q96AE4 | protein_coding | TCGA-A7-A0CJ-01 | Breast | breast invasive carcinoma | Female | <65 | I/II | Chemotherapy | cytoxan | SD | ||
| FUBP1 | deletion | Frame_Shift_Del | novel | c.660delT | p.Met221Ter | p.M221* | Q96AE4 | protein_coding | TCGA-EW-A2FV-01 | Breast | breast invasive carcinoma | Female | <65 | III/IV | Chemotherapy | docetaxel | SD | ||
| FUBP1 | SNV | Missense_Mutation | c.32N>T | p.Ser11Phe | p.S11F | Q96AE4 | protein_coding | deleterious(0.01) | benign(0.4) | TCGA-C5-A2LZ-01 | Cervix | cervical & endocervical cancer | Female | >=65 | III/IV | Unknown | Unknown | PD | |
| FUBP1 | SNV | Missense_Mutation | novel | c.801N>C | p.Glu267Asp | p.E267D | Q96AE4 | protein_coding | tolerated(0.83) | benign(0.003) | TCGA-EA-A43B-01 | Cervix | cervical & endocervical cancer | Female | <65 | I/II | Chemotherapy | cisplatin | CR |
| Page: 1 2 3 4 5 6 7 8 |
Top |
Related drugs of malignant transformation related genes |
| Identification of chemicals and drugs interact with genes involved in malignant transfromation |
| (DGIdb 4.0) |
| Entrez ID | Symbol | Category | Interaction Types | Drug Claim Name | Drug Name | PMIDs |
| Page: 1 |

Copyright 2023-Present -The University of Texas Health Science Center at Houston |