
|
|||||
|
 | |
| |
| |
| |
| |
| |
|
Gene: FTHL17 |
Gene summary for FTHL17 |
| Gene information | Species | Human | Gene symbol | FTHL17 | Gene ID | 53940 |
| Gene name | ferritin heavy chain like 17 | |
| Gene Alias | CT38 | |
| Cytomap | Xp21.2 | |
| Gene Type | protein-coding | GO ID | GO:0000041 | UniProtAcc | Q9BXU8 |
Top |
Malignant transformation analysis |
| Identification of the aberrant gene expression in precancerous and cancerous lesions by comparing the gene expression of stem-like cells in diseased tissues with normal stem cells |
| Entrez ID | Symbol | Replicates | Species | Organ | Tissue | Adj P-value | Log2FC | Malignancy |
| 53940 | FTHL17 | S014 | Human | Liver | HCC | 1.02e-48 | 1.37e+00 | 0.2254 |
| 53940 | FTHL17 | S015 | Human | Liver | HCC | 3.28e-44 | 1.55e+00 | 0.2375 |
| 53940 | FTHL17 | S016 | Human | Liver | HCC | 1.08e-64 | 1.59e+00 | 0.2243 |
| Page: 1 |
| Tissue | Expression Dynamics | Abbreviation |
| Liver | 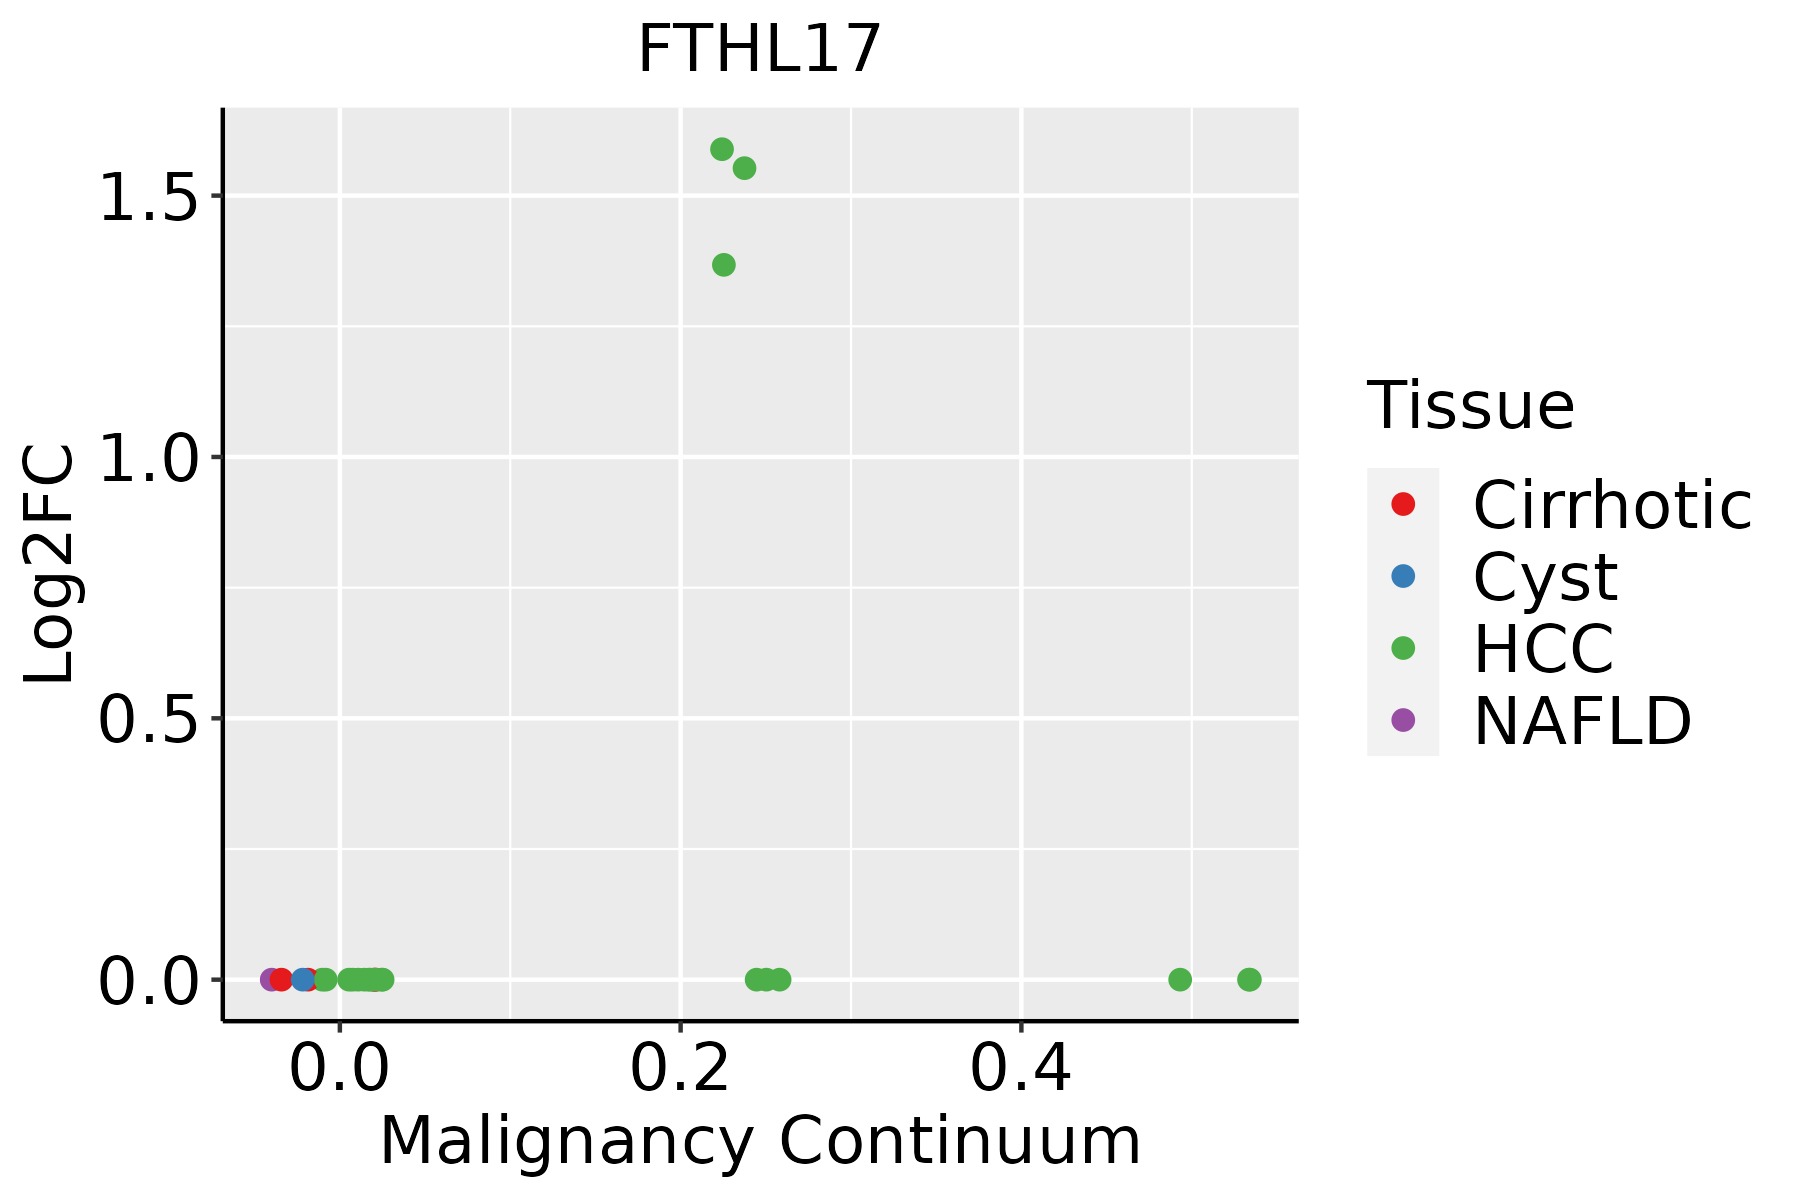 | HCC: Hepatocellular carcinoma |
| NAFLD: Non-alcoholic fatty liver disease |
| ∗log2FC in expression of this searched gene in stem-like cells from each diseased tissue sample relative to stem-like cells in normal samples in each tissue plotted against the malignancy continuum. Samples are colored based on if they are from different disease stage. |
Top |
Malignant transformation related pathway analysis |
| Find out the enriched GO biological processes and KEGG pathways involved in transition from healthy to precancer to cancer |
| Tissue | Disease Stage | Enriched GO biological Processes |
| Colorectum | AD |  |
| Colorectum | SER |  |
| Colorectum | MSS |  |
| Colorectum | MSI-H |  |
| Colorectum | FAP |  |
| ∗Top 15 enriched GO BP terms are showed in the bar plot of each disease state in each tissue. Each row represents a significant GO biological process which is colored according to the -log10(p.adjust). |
| Page: 1 2 3 4 5 6 7 8 9 |
| GO ID | Tissue | Disease Stage | Description | Gene Ratio | Bg Ratio | pvalue | p.adjust | Count |
| GO:005123521 | Liver | HCC | maintenance of location | 185/7958 | 327/18723 | 1.70e-07 | 3.12e-06 | 185 |
| GO:005165112 | Liver | HCC | maintenance of location in cell | 119/7958 | 214/18723 | 7.11e-05 | 6.39e-04 | 119 |
| GO:005507612 | Liver | HCC | transition metal ion homeostasis | 81/7958 | 138/18723 | 8.87e-05 | 7.72e-04 | 81 |
| GO:004691611 | Liver | HCC | cellular transition metal ion homeostasis | 67/7958 | 115/18723 | 4.64e-04 | 3.08e-03 | 67 |
| GO:00000411 | Liver | HCC | transition metal ion transport | 59/7958 | 105/18723 | 3.18e-03 | 1.47e-02 | 59 |
| GO:00068261 | Liver | HCC | iron ion transport | 34/7958 | 58/18723 | 9.66e-03 | 3.63e-02 | 34 |
| GO:005507211 | Liver | HCC | iron ion homeostasis | 47/7958 | 85/18723 | 1.17e-02 | 4.28e-02 | 47 |
| Page: 1 |
| Pathway ID | Tissue | Disease Stage | Description | Gene Ratio | Bg Ratio | pvalue | p.adjust | qvalue | Count |
| Page: 1 |
Top |
Cell-cell communication analysis |
| Identification of potential cell-cell interactions between two cell types and their ligand-receptor pairs for different disease states |
| Ligand | Receptor | LRpair | Pathway | Tissue | Disease Stage |
| Page: 1 |
Top |
Single-cell gene regulatory network inference analysis |
| Find out the significant the regulons (TFs) and the target genes of each regulon across cell types for different disease states |
| TF | Cell Type | Tissue | Disease Stage | Target Gene | RSS | Regulon Activity |
| ∗The dot plots of a searched regulon are shown for all cell subpopulations in each disease state of each tissue based on the regulon specific score inferred using pySCENIC and by calculating the average expression. |
| Page: 1 |
Top |
Somatic mutation of malignant transformation related genes |
| Annotation of somatic variants for genes involved in malignant transformation |
| Hugo Symbol | Variant Class | Variant Classification | dbSNP RS | HGVSc | HGVSp | HGVSp Short | SWISSPROT | BIOTYPE | SIFT | PolyPhen | Tumor Sample Barcode | Tissue | Histology | Sex | Age | Stage | Therapy Types | Drugs | Outcome |
| FTHL17 | SNV | Missense_Mutation | c.310N>T | p.Ala104Ser | p.A104S | Q9BXU8 | protein_coding | deleterious(0.03) | possibly_damaging(0.902) | TCGA-AC-A23E-01 | Breast | breast invasive carcinoma | Female | <65 | I/II | Hormone Therapy | tamoxiphen | SD | |
| FTHL17 | SNV | Missense_Mutation | novel | c.173N>A | p.Arg58His | p.R58H | Q9BXU8 | protein_coding | tolerated(1) | benign(0.117) | TCGA-AC-A3QQ-01 | Breast | breast invasive carcinoma | Female | <65 | I/II | Unknown | Unknown | SD |
| FTHL17 | SNV | Missense_Mutation | c.470N>A | p.Arg157His | p.R157H | Q9BXU8 | protein_coding | tolerated(0.16) | benign(0.108) | TCGA-EA-A5O9-01 | Cervix | cervical & endocervical cancer | Female | <65 | I/II | Unknown | Unknown | SD | |
| FTHL17 | SNV | Missense_Mutation | c.161G>A | p.Arg54His | p.R54H | Q9BXU8 | protein_coding | tolerated(0.22) | benign(0.013) | TCGA-LP-A5U3-01 | Cervix | cervical & endocervical cancer | Female | <65 | I/II | Unknown | Unknown | SD | |
| FTHL17 | SNV | Missense_Mutation | c.136N>T | p.Asp46Tyr | p.D46Y | Q9BXU8 | protein_coding | deleterious(0.01) | probably_damaging(0.998) | TCGA-MA-AA42-01 | Cervix | cervical & endocervical cancer | Female | >=65 | I/II | Unknown | Unknown | SD | |
| FTHL17 | SNV | Missense_Mutation | rs745659539 | c.142N>A | p.Ala48Thr | p.A48T | Q9BXU8 | protein_coding | deleterious(0.01) | possibly_damaging(0.759) | TCGA-VS-A94Z-01 | Cervix | cervical & endocervical cancer | Female | <65 | I/II | Chemotherapy | cisplatin | CR |
| FTHL17 | SNV | Missense_Mutation | rs748357093 | c.29G>A | p.Arg10His | p.R10H | Q9BXU8 | protein_coding | tolerated(0.09) | benign(0.031) | TCGA-AA-3966-01 | Colorectum | colon adenocarcinoma | Female | >=65 | I/II | Unknown | Unknown | SD |
| FTHL17 | SNV | Missense_Mutation | c.199N>A | p.Ala67Thr | p.A67T | Q9BXU8 | protein_coding | deleterious(0.05) | possibly_damaging(0.679) | TCGA-AA-A022-01 | Colorectum | colon adenocarcinoma | Female | >=65 | I/II | Unknown | Unknown | SD | |
| FTHL17 | SNV | Missense_Mutation | c.44N>T | p.Thr15Ile | p.T15I | Q9BXU8 | protein_coding | tolerated(0.07) | benign(0.065) | TCGA-CK-4951-01 | Colorectum | colon adenocarcinoma | Female | >=65 | I/II | Unknown | Unknown | PD | |
| FTHL17 | SNV | Missense_Mutation | c.514N>T | p.Asp172Tyr | p.D172Y | Q9BXU8 | protein_coding | deleterious(0) | possibly_damaging(0.698) | TCGA-CM-5341-01 | Colorectum | colon adenocarcinoma | Female | >=65 | III/IV | Chemotherapy | fluorouracil | SD |
| Page: 1 2 3 4 5 6 |
Top |
Related drugs of malignant transformation related genes |
| Identification of chemicals and drugs interact with genes involved in malignant transfromation |
| (DGIdb 4.0) |
| Entrez ID | Symbol | Category | Interaction Types | Drug Claim Name | Drug Name | PMIDs |
| Page: 1 |

Copyright 2023-Present -The University of Texas Health Science Center at Houston |