
|
|||||
|
 | |
| |
| |
| |
| |
| |
|
Gene: FTCD |
Gene summary for FTCD |
| Gene information | Species | Human | Gene symbol | FTCD | Gene ID | 10841 |
| Gene name | formimidoyltransferase cyclodeaminase | |
| Gene Alias | LCHC1 | |
| Cytomap | 21q22.3 | |
| Gene Type | protein-coding | GO ID | GO:0006082 | UniProtAcc | O95954 |
Top |
Malignant transformation analysis |
| Identification of the aberrant gene expression in precancerous and cancerous lesions by comparing the gene expression of stem-like cells in diseased tissues with normal stem cells |
| Entrez ID | Symbol | Replicates | Species | Organ | Tissue | Adj P-value | Log2FC | Malignancy |
| 10841 | FTCD | S43 | Human | Liver | Cirrhotic | 3.78e-24 | -6.52e-01 | -0.0187 |
| 10841 | FTCD | HCC1_Meng | Human | Liver | HCC | 1.10e-83 | -5.08e-01 | 0.0246 |
| 10841 | FTCD | HCC2_Meng | Human | Liver | HCC | 1.83e-30 | -7.49e-01 | 0.0107 |
| 10841 | FTCD | cirrhotic1 | Human | Liver | Cirrhotic | 9.30e-11 | -2.55e-01 | 0.0202 |
| 10841 | FTCD | cirrhotic2 | Human | Liver | Cirrhotic | 2.27e-22 | -6.20e-01 | 0.0201 |
| 10841 | FTCD | cirrhotic3 | Human | Liver | Cirrhotic | 5.71e-08 | -4.91e-01 | 0.0215 |
| 10841 | FTCD | p6 | Human | Liver | Cyst | 1.79e-04 | -7.52e-01 | -0.0218 |
| 10841 | FTCD | HCC2 | Human | Liver | HCC | 3.25e-09 | 3.68e+00 | 0.5341 |
| 10841 | FTCD | HCC5 | Human | Liver | HCC | 4.00e-04 | 5.62e-01 | 0.4932 |
| 10841 | FTCD | Pt13.a | Human | Liver | HCC | 4.24e-13 | -4.75e-01 | 0.021 |
| 10841 | FTCD | Pt13.b | Human | Liver | HCC | 1.85e-21 | -3.39e-01 | 0.0251 |
| 10841 | FTCD | Pt13.c | Human | Liver | HCC | 1.92e-07 | -6.41e-01 | 0.0076 |
| 10841 | FTCD | Pt14.d | Human | Liver | HCC | 1.13e-11 | -4.90e-01 | 0.0143 |
| 10841 | FTCD | S027 | Human | Liver | HCC | 1.69e-02 | 6.41e-01 | 0.2446 |
| 10841 | FTCD | S028 | Human | Liver | HCC | 2.24e-10 | 7.88e-01 | 0.2503 |
| 10841 | FTCD | S029 | Human | Liver | HCC | 5.70e-07 | 8.51e-01 | 0.2581 |
| Page: 1 |
| Tissue | Expression Dynamics | Abbreviation |
| Liver | 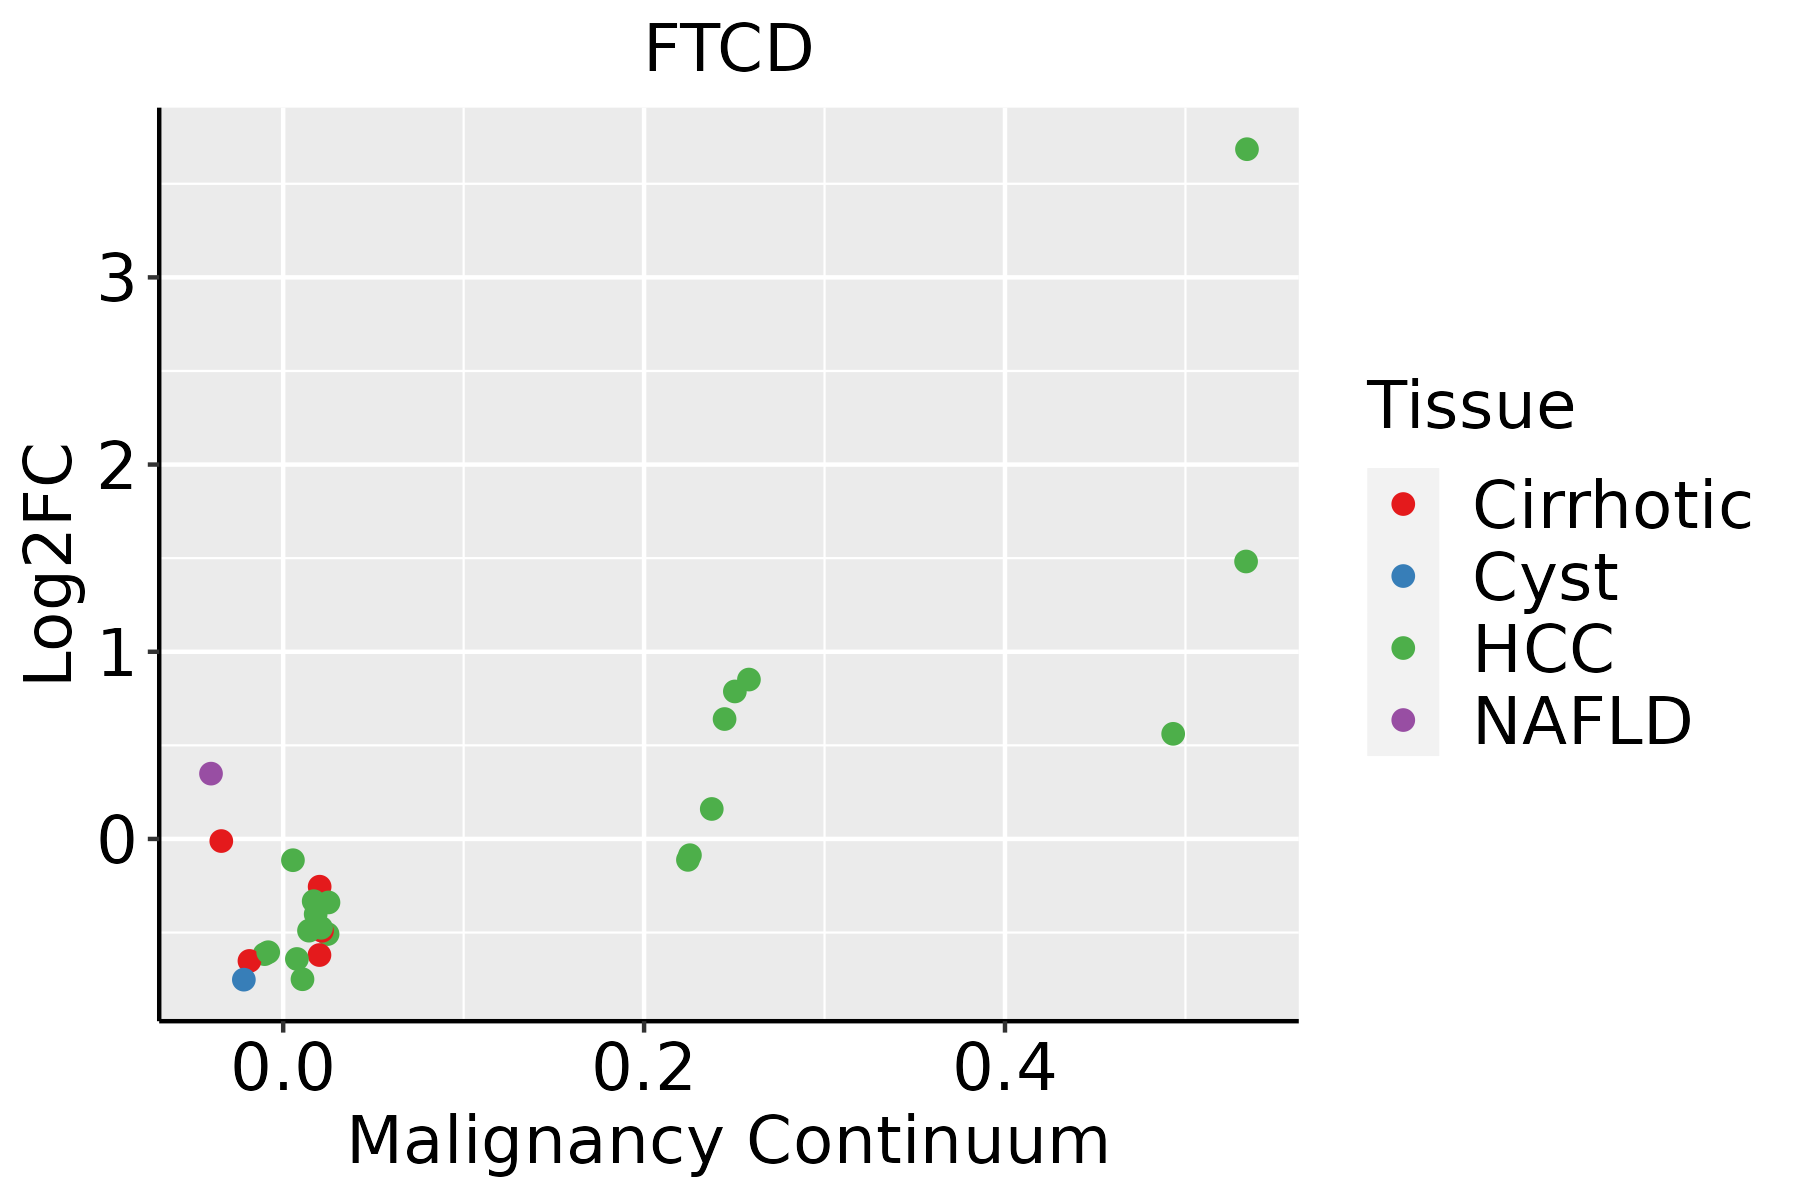 | HCC: Hepatocellular carcinoma |
| NAFLD: Non-alcoholic fatty liver disease |
| ∗log2FC in expression of this searched gene in stem-like cells from each diseased tissue sample relative to stem-like cells in normal samples in each tissue plotted against the malignancy continuum. Samples are colored based on if they are from different disease stage. |
Top |
Malignant transformation related pathway analysis |
| Find out the enriched GO biological processes and KEGG pathways involved in transition from healthy to precancer to cancer |
| Tissue | Disease Stage | Enriched GO biological Processes |
| Colorectum | AD |  |
| Colorectum | SER |  |
| Colorectum | MSS |  |
| Colorectum | MSI-H |  |
| Colorectum | FAP |  |
| ∗Top 15 enriched GO BP terms are showed in the bar plot of each disease state in each tissue. Each row represents a significant GO biological process which is colored according to the -log10(p.adjust). |
| Page: 1 2 3 4 5 6 7 8 9 |
| GO ID | Tissue | Disease Stage | Description | Gene Ratio | Bg Ratio | pvalue | p.adjust | Count |
| GO:004428211 | Liver | Cirrhotic | small molecule catabolic process | 151/4634 | 376/18723 | 2.20e-11 | 1.34e-09 | 151 |
| GO:001605411 | Liver | Cirrhotic | organic acid catabolic process | 104/4634 | 240/18723 | 1.91e-10 | 9.53e-09 | 104 |
| GO:004639511 | Liver | Cirrhotic | carboxylic acid catabolic process | 102/4634 | 236/18723 | 3.41e-10 | 1.63e-08 | 102 |
| GO:19016051 | Liver | Cirrhotic | alpha-amino acid metabolic process | 82/4634 | 195/18723 | 7.72e-08 | 2.30e-06 | 82 |
| GO:00090631 | Liver | Cirrhotic | cellular amino acid catabolic process | 49/4634 | 110/18723 | 4.47e-06 | 7.42e-05 | 49 |
| GO:000652011 | Liver | Cirrhotic | cellular amino acid metabolic process | 103/4634 | 284/18723 | 8.88e-06 | 1.30e-04 | 103 |
| GO:004364811 | Liver | Cirrhotic | dicarboxylic acid metabolic process | 43/4634 | 96/18723 | 1.42e-05 | 1.97e-04 | 43 |
| GO:000657511 | Liver | Cirrhotic | cellular modified amino acid metabolic process | 70/4634 | 188/18723 | 9.04e-05 | 9.69e-04 | 70 |
| GO:00067303 | Liver | Cirrhotic | one-carbon metabolic process | 17/4634 | 40/18723 | 1.04e-02 | 4.61e-02 | 17 |
| GO:004428221 | Liver | HCC | small molecule catabolic process | 225/7958 | 376/18723 | 6.50e-12 | 2.80e-10 | 225 |
| GO:001605421 | Liver | HCC | organic acid catabolic process | 152/7958 | 240/18723 | 5.11e-11 | 1.92e-09 | 152 |
| GO:00463952 | Liver | HCC | carboxylic acid catabolic process | 149/7958 | 236/18723 | 1.11e-10 | 3.87e-09 | 149 |
| GO:19016052 | Liver | HCC | alpha-amino acid metabolic process | 124/7958 | 195/18723 | 2.07e-09 | 5.79e-08 | 124 |
| GO:000657521 | Liver | HCC | cellular modified amino acid metabolic process | 119/7958 | 188/18723 | 6.47e-09 | 1.67e-07 | 119 |
| GO:00436482 | Liver | HCC | dicarboxylic acid metabolic process | 68/7958 | 96/18723 | 1.73e-08 | 4.14e-07 | 68 |
| GO:00065202 | Liver | HCC | cellular amino acid metabolic process | 167/7958 | 284/18723 | 1.91e-08 | 4.56e-07 | 167 |
| GO:00425581 | Liver | HCC | pteridine-containing compound metabolic process | 28/7958 | 33/18723 | 6.57e-07 | 1.03e-05 | 28 |
| GO:00090632 | Liver | HCC | cellular amino acid catabolic process | 70/7958 | 110/18723 | 6.12e-06 | 7.52e-05 | 70 |
| GO:00067601 | Liver | HCC | folic acid-containing compound metabolic process | 22/7958 | 26/18723 | 1.23e-05 | 1.39e-04 | 22 |
| GO:00359991 | Liver | HCC | tetrahydrofolate interconversion | 10/7958 | 10/18723 | 1.92e-04 | 1.49e-03 | 10 |
| Page: 1 2 |
| Pathway ID | Tissue | Disease Stage | Description | Gene Ratio | Bg Ratio | pvalue | p.adjust | qvalue | Count |
| hsa006702 | Liver | HCC | One carbon pool by folate | 17/4020 | 20/8465 | 6.04e-04 | 2.50e-03 | 1.39e-03 | 17 |
| hsa0067011 | Liver | HCC | One carbon pool by folate | 17/4020 | 20/8465 | 6.04e-04 | 2.50e-03 | 1.39e-03 | 17 |
| Page: 1 |
Top |
Cell-cell communication analysis |
| Identification of potential cell-cell interactions between two cell types and their ligand-receptor pairs for different disease states |
| Ligand | Receptor | LRpair | Pathway | Tissue | Disease Stage |
| Page: 1 |
Top |
Single-cell gene regulatory network inference analysis |
| Find out the significant the regulons (TFs) and the target genes of each regulon across cell types for different disease states |
| TF | Cell Type | Tissue | Disease Stage | Target Gene | RSS | Regulon Activity |
| ∗The dot plots of a searched regulon are shown for all cell subpopulations in each disease state of each tissue based on the regulon specific score inferred using pySCENIC and by calculating the average expression. |
| Page: 1 |
Top |
Somatic mutation of malignant transformation related genes |
| Annotation of somatic variants for genes involved in malignant transformation |
| Hugo Symbol | Variant Class | Variant Classification | dbSNP RS | HGVSc | HGVSp | HGVSp Short | SWISSPROT | BIOTYPE | SIFT | PolyPhen | Tumor Sample Barcode | Tissue | Histology | Sex | Age | Stage | Therapy Types | Drugs | Outcome |
| FTCD | SNV | Missense_Mutation | rs776937841 | c.1678N>A | p.Glu560Lys | p.E560K | O95954 | protein_coding | deleterious_low_confidence(0) | possibly_damaging(0.502) | TCGA-D8-A27G-01 | Breast | breast invasive carcinoma | Female | >=65 | I/II | Unknown | Unknown | SD |
| FTCD | SNV | Missense_Mutation | rs752941882 | c.842N>T | p.Ala281Val | p.A281V | O95954 | protein_coding | tolerated(0.09) | possibly_damaging(0.585) | TCGA-2W-A8YY-01 | Cervix | cervical & endocervical cancer | Female | <65 | I/II | Chemotherapy | cisplatin | CR |
| FTCD | SNV | Missense_Mutation | novel | c.227N>A | p.Ser76Asn | p.S76N | O95954 | protein_coding | tolerated(0.17) | benign(0.073) | TCGA-EA-A410-01 | Cervix | cervical & endocervical cancer | Female | <65 | I/II | Unknown | Unknown | SD |
| FTCD | SNV | Missense_Mutation | novel | c.940N>T | p.Pro314Ser | p.P314S | O95954 | protein_coding | deleterious(0.04) | benign(0.048) | TCGA-EX-A1H6-01 | Cervix | cervical & endocervical cancer | Female | <65 | I/II | Unknown | Unknown | SD |
| FTCD | SNV | Missense_Mutation | rs762030809 | c.751G>A | p.Glu251Lys | p.E251K | O95954 | protein_coding | deleterious(0.03) | probably_damaging(0.968) | TCGA-MA-AA41-01 | Cervix | cervical & endocervical cancer | Female | <65 | I/II | Unknown | Unknown | SD |
| FTCD | SNV | Missense_Mutation | rs776462116 | c.481N>A | p.Asp161Asn | p.D161N | O95954 | protein_coding | deleterious(0) | probably_damaging(0.987) | TCGA-AA-3984-01 | Colorectum | colon adenocarcinoma | Female | <65 | I/II | Unknown | Unknown | SD |
| FTCD | SNV | Missense_Mutation | rs149792963 | c.1252N>A | p.Ala418Thr | p.A418T | O95954 | protein_coding | tolerated(0.39) | benign(0.015) | TCGA-CM-4747-01 | Colorectum | colon adenocarcinoma | Male | <65 | I/II | Chemotherapy | fluorouracil | SD |
| FTCD | SNV | Missense_Mutation | rs754530912 | c.599N>T | p.Ala200Val | p.A200V | O95954 | protein_coding | deleterious(0) | probably_damaging(0.994) | TCGA-DM-A1HB-01 | Colorectum | colon adenocarcinoma | Male | >=65 | III/IV | Unknown | Unknown | SD |
| FTCD | SNV | Missense_Mutation | rs749659966 | c.172G>A | p.Val58Met | p.V58M | O95954 | protein_coding | deleterious(0.02) | probably_damaging(0.971) | TCGA-G4-6298-01 | Colorectum | colon adenocarcinoma | Male | >=65 | III/IV | Chemotherapy | irinotecan | PD |
| FTCD | SNV | Missense_Mutation | rs147140166 | c.644N>A | p.Arg215His | p.R215H | O95954 | protein_coding | tolerated(0.05) | possibly_damaging(0.708) | TCGA-G4-6586-01 | Colorectum | colon adenocarcinoma | Female | >=65 | I/II | Unknown | Unknown | SD |
| Page: 1 2 3 4 5 6 7 |
Top |
Related drugs of malignant transformation related genes |
| Identification of chemicals and drugs interact with genes involved in malignant transfromation |
| (DGIdb 4.0) |
| Entrez ID | Symbol | Category | Interaction Types | Drug Claim Name | Drug Name | PMIDs |
| Page: 1 |

Copyright 2023-Present -The University of Texas Health Science Center at Houston |