Schematic overview of the cellular and molecular mechanisms involved in the cancer progression, including the proposed cellular and molecular mechanisms in cancer cells trajectory. AT1: alveolar type 1 cells; AT2: alveolar type 2 cells; AAH: atypical adenomatous hyperplasia; AIS: adenocarcinoma in situ; MIA: minimally invasive adenocarcinoma; IA: invasive adenocarcinoma; EMT: epithelial-mesenchymal transition

Home

Download

Statistics

Help

Contact

Center for Computational Systems Medicine
leaf

Gene summary

leaf

Malignant transformation analysis

leaf

Malignant transformation related pathway analysis

leaf

Cell-cell communication analysis

leaf

Single-cell gene regulatory network inference analysis

leaf

Somatic mutation of malignant transformation related genes

leaf

Related drugs of malignant transformation related genes

Gene: FSTL3

Gene summary for FSTL3

check button Gene summary.

Gene informationSpeciesHuman
Gene symbol

FSTL3

Gene ID

10272

Gene namefollistatin like 3
Gene AliasFLRG
Cytomap19p13.3
Gene Typeprotein-coding
GO ID

GO:0000003

UniProtAcc

A0A024R1Y8


Top

Malignant transformation analysis

check button Identification of the aberrant gene expression in precancerous and cancerous lesions by comparing the gene expression of stem-like cells in diseased tissues with normal stem cells
check button Malignant transformation involving gene list.
Entrez IDSymbolReplicatesSpeciesOrganTissueAdj P-valueLog2FCMalignancy
10272FSTL3LZE24THumanEsophagusESCC1.11e-126.66e-010.0596
10272FSTL3P4T-EHumanEsophagusESCC4.08e-083.66e-010.1323
10272FSTL3P5T-EHumanEsophagusESCC1.27e-224.86e-010.1327
10272FSTL3P8T-EHumanEsophagusESCC4.14e-032.10e-010.0889
10272FSTL3P9T-EHumanEsophagusESCC7.10e-043.75e-010.1131
10272FSTL3P10T-EHumanEsophagusESCC1.35e-103.63e-010.116
10272FSTL3P11T-EHumanEsophagusESCC9.86e-492.27e+000.1426
10272FSTL3P12T-EHumanEsophagusESCC1.56e-022.51e-010.1122
10272FSTL3P16T-EHumanEsophagusESCC1.98e-022.20e-020.1153
10272FSTL3P17T-EHumanEsophagusESCC5.47e-161.12e+000.1278
10272FSTL3P19T-EHumanEsophagusESCC9.67e-202.07e+000.1662
10272FSTL3P20T-EHumanEsophagusESCC4.76e-033.04e-010.1124
10272FSTL3P21T-EHumanEsophagusESCC1.02e-207.16e-010.1617
10272FSTL3P22T-EHumanEsophagusESCC1.89e-061.41e-010.1236
10272FSTL3P23T-EHumanEsophagusESCC3.75e-022.17e-010.108
10272FSTL3P24T-EHumanEsophagusESCC4.41e-209.62e-010.1287
10272FSTL3P26T-EHumanEsophagusESCC5.25e-042.24e-010.1276
10272FSTL3P28T-EHumanEsophagusESCC1.30e-164.04e-010.1149
10272FSTL3P30T-EHumanEsophagusESCC1.57e-022.74e-010.137
10272FSTL3P31T-EHumanEsophagusESCC1.05e-032.07e-010.1251
Page: 1 2 3 4 

check button Transcriptomic changes along malignancy continuum.
TissueExpression DynamicsAbbreviation
EsophagusThe image shows the transcriptomic changes along malignancy continuum.log2FC in expression of this searched gene in stem-like cells from each diseased tissue sample relative to stem-like cells in normal samples in each tissue plotted against the malignancy continuum. Samples are colored based on if they are from different disease stage.ESCC: Esophageal squamous cell carcinoma
HGIN: High-grade intraepithelial neoplasias
LGIN: Low-grade intraepithelial neoplasias
LiverThe image shows the transcriptomic changes along malignancy continuum.log2FC in expression of this searched gene in stem-like cells from each diseased tissue sample relative to stem-like cells in normal samples in each tissue plotted against the malignancy continuum. Samples are colored based on if they are from different disease stage.HCC: Hepatocellular carcinoma
NAFLD: Non-alcoholic fatty liver disease
Oral CavityThe image shows the transcriptomic changes along malignancy continuum.log2FC in expression of this searched gene in stem-like cells from each diseased tissue sample relative to stem-like cells in normal samples in each tissue plotted against the malignancy continuum. Samples are colored based on if they are from different disease stage.
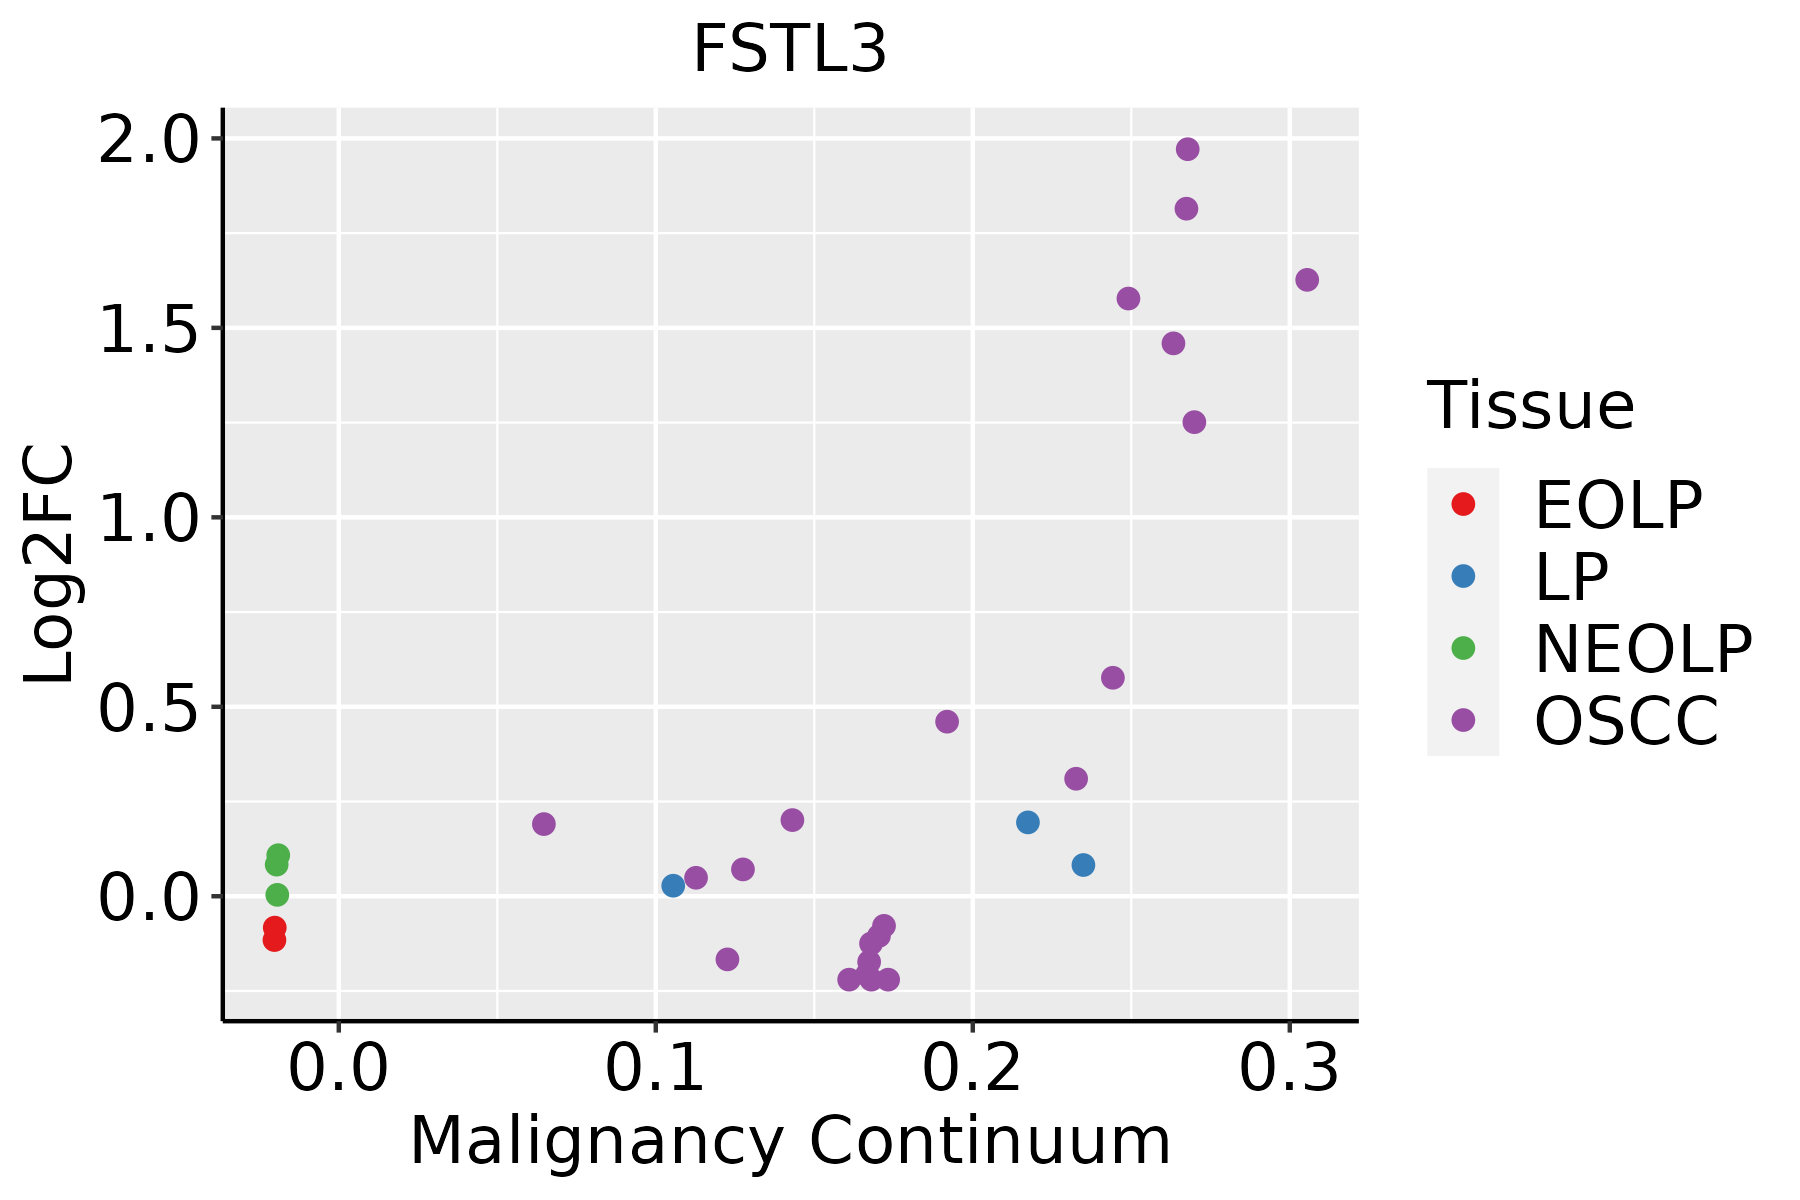
EOLP: Erosive Oral lichen planus
LP: leukoplakia
NEOLP: Non-erosive oral lichen planus
OSCC: Oral squamous cell carcinoma
SkinThe image shows the transcriptomic changes along malignancy continuum.log2FC in expression of this searched gene in stem-like cells from each diseased tissue sample relative to stem-like cells in normal samples in each tissue plotted against the malignancy continuum. Samples are colored based on if they are from different disease stage.
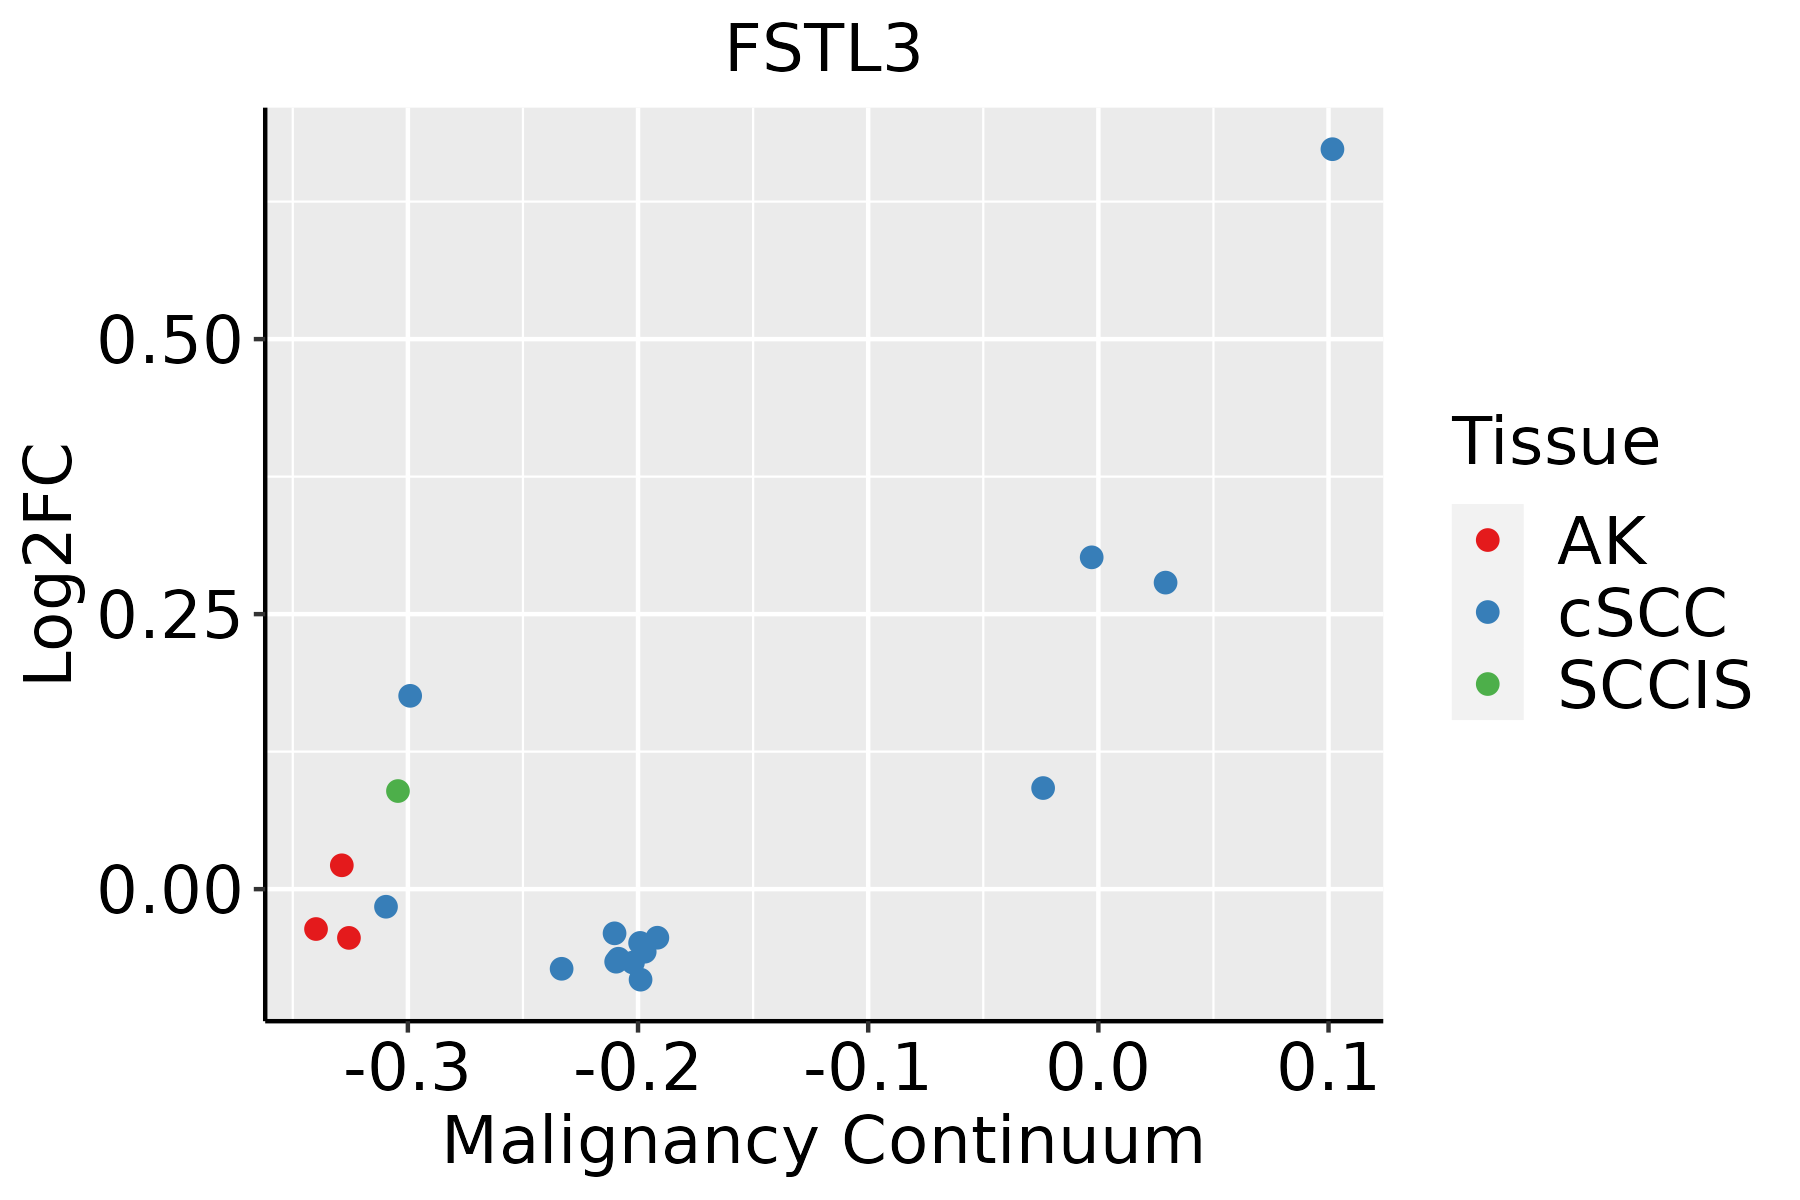
AK: Actinic keratosis
cSCC: Cutaneous squamous cell carcinoma
SCCIS:squamous cell carcinoma in situ
ThyroidThe image shows the transcriptomic changes along malignancy continuum.log2FC in expression of this searched gene in stem-like cells from each diseased tissue sample relative to stem-like cells in normal samples in each tissue plotted against the malignancy continuum. Samples are colored based on if they are from different disease stage.
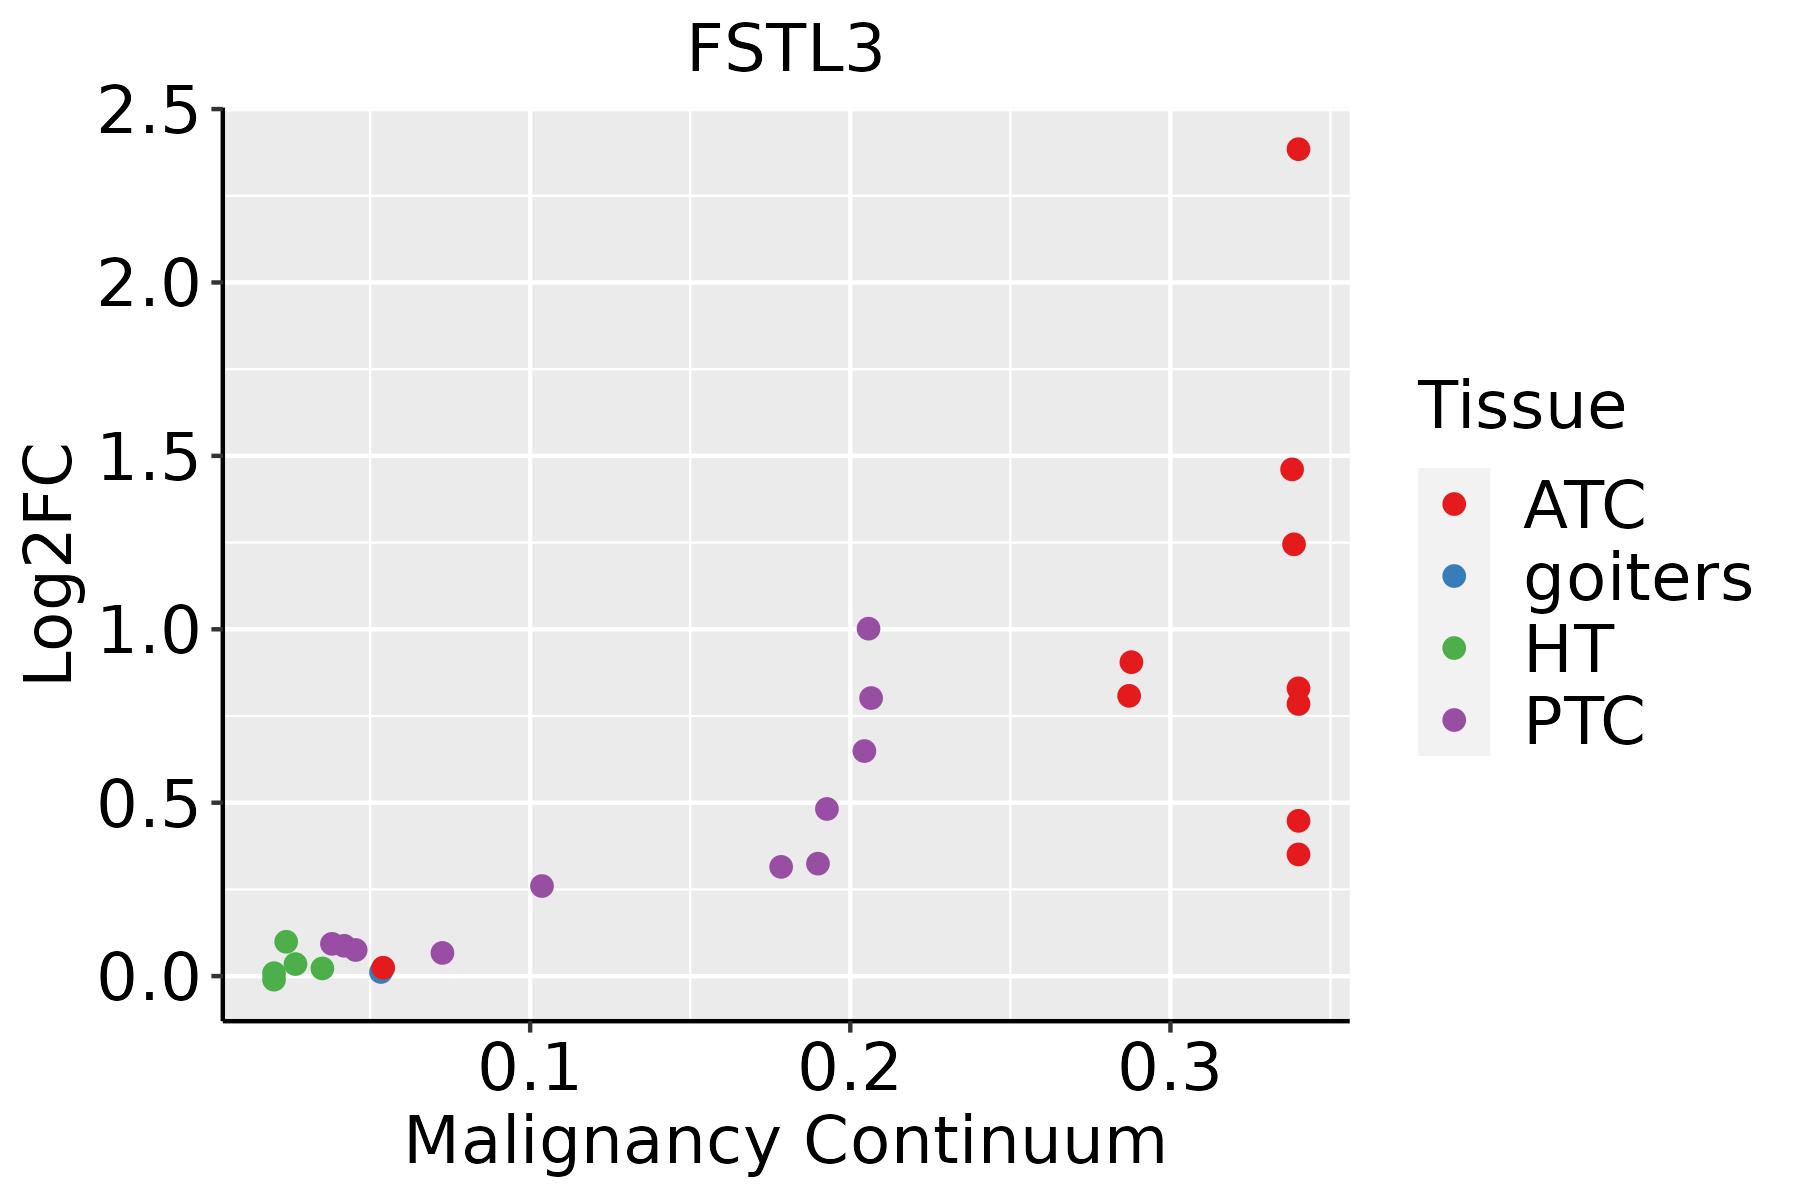
ATC: Anaplastic thyroid cancer
HT: Hashimoto's thyroiditis
PTC: Papillary thyroid cancer
∗log2FC in expression of this searched gene in stem-like cells from each diseased tissue sample relative to stem-like cells in normal samples in each tissue plotted against the malignancy continuum. Samples are colored based on if they are from different disease stage.

Top

Malignant transformation related pathway analysis

check buttonFind out the enriched GO biological processes and KEGG pathways involved in transition from healthy to precancer to cancer
check button Figure of enriched GO biological processes.
TissueDisease StageEnriched GO biological Processes
ColorectumADGO analysis - Figure of enriched GO biological processes: Top 15 enriched GO BP terms are showed in the bar plot of each disease state in each tissue. Each row represents a significant GO biological process which is colored according to the -log10(p.adjust).
ColorectumSERGO analysis - Figure of enriched GO biological processes: Top 15 enriched GO BP terms are showed in the bar plot of each disease state in each tissue. Each row represents a significant GO biological process which is colored according to the -log10(p.adjust).
ColorectumMSSGO analysis - Figure of enriched GO biological processes: Top 15 enriched GO BP terms are showed in the bar plot of each disease state in each tissue. Each row represents a significant GO biological process which is colored according to the -log10(p.adjust).
ColorectumMSI-HGO analysis - Figure of enriched GO biological processes: Top 15 enriched GO BP terms are showed in the bar plot of each disease state in each tissue. Each row represents a significant GO biological process which is colored according to the -log10(p.adjust).
ColorectumFAPGO analysis - Figure of enriched GO biological processes: Top 15 enriched GO BP terms are showed in the bar plot of each disease state in each tissue. Each row represents a significant GO biological process which is colored according to the -log10(p.adjust).
∗Top 15 enriched GO BP terms are showed in the bar plot of each disease state in each tissue. Each row represents a significant GO biological process which is colored according to the -log10(p.adjust).
Page: 1 2 3 4 5 6 7 8 9 

check button Enriched GO biological processes.
GO IDTissueDisease StageDescriptionGene RatioBg Ratiopvaluep.adjustCount
GO:0048732111EsophagusESCCgland development269/8552436/187237.81e-122.95e-10269
GO:0030099111EsophagusESCCmyeloid cell differentiation232/8552381/187231.22e-092.90e-08232
GO:004578527EsophagusESCCpositive regulation of cell adhesion255/8552437/187235.07e-089.11e-07255
GO:0061458110EsophagusESCCreproductive system development247/8552427/187232.24e-073.42e-06247
GO:004860818EsophagusESCCreproductive structure development245/8552424/187232.82e-074.14e-06245
GO:000257317EsophagusESCCmyeloid leukocyte differentiation128/8552208/187232.75e-063.15e-05128
GO:000150317EsophagusESCCossification232/8552408/187233.00e-063.40e-05232
GO:00303239EsophagusESCCrespiratory tube development112/8552181/187237.82e-067.69e-05112
GO:00605417EsophagusESCCrespiratory system development123/8552203/187231.26e-051.15e-04123
GO:00303249EsophagusESCClung development109/8552177/187231.40e-051.27e-04109
GO:001003827EsophagusESCCresponse to metal ion208/8552373/187235.02e-053.90e-04208
GO:000717810EsophagusESCCtransmembrane receptor protein serine/threonine kinase signaling pathway195/8552355/187232.58e-041.58e-03195
GO:1903706110EsophagusESCCregulation of hemopoiesis201/8552367/187232.60e-041.58e-03201
GO:002240720EsophagusESCCregulation of cell-cell adhesion239/8552448/187235.88e-043.19e-03239
GO:000268316EsophagusESCCnegative regulation of immune system process231/8552434/187238.48e-044.36e-03231
GO:0045637111EsophagusESCCregulation of myeloid cell differentiation118/8552210/187231.35e-036.43e-03118
GO:002240919EsophagusESCCpositive regulation of cell-cell adhesion155/8552284/187231.50e-037.06e-03155
GO:190210510EsophagusESCCregulation of leukocyte differentiation152/8552279/187231.82e-038.35e-03152
GO:007124117EsophagusESCCcellular response to inorganic substance125/8552226/187232.17e-039.67e-03125
GO:00022446EsophagusESCChematopoietic progenitor cell differentiation66/8552114/187235.74e-032.13e-0266
Page: 1 2 3 4 5 6 7 8 

check button Enriched KEGG pathways.
Pathway IDTissueDisease StageDescriptionGene RatioBg Ratiopvaluep.adjustqvalueCount
Page: 1 

Top

Cell-cell communication analysis

check buttonIdentification of potential cell-cell interactions between two cell types and their ligand-receptor pairs for different disease states
LigandReceptorLRpairPathwayTissueDisease Stage
Page: 1 

Top

Single-cell gene regulatory network inference analysis

check buttonFind out the significant the regulons (TFs) and the target genes of each regulon across cell types for different disease states
TFCell TypeTissueDisease StageTarget GeneRSSRegulon Activity
∗The dot plots of a searched regulon are shown for all cell subpopulations in each disease state of each tissue based on the regulon specific score inferred using pySCENIC and by calculating the average expression.
Page: 1 

Top

Somatic mutation of malignant transformation related genes

check buttonAnnotation of somatic variants for genes involved in malignant transformation
Hugo SymbolVariant ClassVariant ClassificationdbSNP RSHGVScHGVSpHGVSp ShortSWISSPROTBIOTYPESIFTPolyPhenTumor Sample BarcodeTissueHistologySexAgeStageTherapy TypesDrugsOutcome
FSTL3SNVMissense_Mutationrs769239267c.593N>Tp.Ala198Valp.A198VO95633protein_codingtolerated(0.21)benign(0.106)TCGA-2W-A8YY-01Cervixcervical & endocervical cancerFemale<65I/IIChemotherapycisplatinCR
FSTL3SNVMissense_Mutationc.780N>Cp.Glu260Aspp.E260DO95633protein_codingtolerated_low_confidence(0.14)benign(0.001)TCGA-IR-A3LK-01Cervixcervical & endocervical cancerFemale>=65I/IIChemotherapycisplatinPD
FSTL3SNVMissense_Mutationc.780G>Tp.Glu260Aspp.E260DO95633protein_codingtolerated_low_confidence(0.14)benign(0.001)TCGA-CA-6717-01Colorectumcolon adenocarcinomaMale<65I/IIChemotherapyoxaliplatinCR
FSTL3SNVMissense_Mutationnovelc.578T>Cp.Val193Alap.V193AO95633protein_codingtolerated(0.05)benign(0.278)TCGA-AP-A1DK-01Endometriumuterine corpus endometrioid carcinomaFemale<65I/IIUnknownUnknownSD
FSTL3SNVMissense_Mutationrs761509739c.712C>Tp.Arg238Cysp.R238CO95633protein_codingdeleterious(0)probably_damaging(0.985)TCGA-AP-A1DK-01Endometriumuterine corpus endometrioid carcinomaFemale<65I/IIUnknownUnknownSD
FSTL3SNVMissense_Mutationnovelc.673N>Ap.Arg225Serp.R225SO95633protein_codingdeleterious(0)probably_damaging(0.949)TCGA-AP-A1DV-01Endometriumuterine corpus endometrioid carcinomaFemale<65I/IIUnknownUnknownSD
FSTL3SNVMissense_Mutationnovelc.704N>Ap.Ile235Asnp.I235NO95633protein_codingdeleterious(0)probably_damaging(0.999)TCGA-AP-A1E0-01Endometriumuterine corpus endometrioid carcinomaFemale<65III/IVChemotherapypaclitaxelSD
FSTL3SNVMissense_Mutationnovelc.625G>Ap.Glu209Lysp.E209KO95633protein_codingtolerated(0.25)benign(0.139)TCGA-EO-A22U-01Endometriumuterine corpus endometrioid carcinomaFemale>=65I/IIUnknownUnknownSD
FSTL3SNVMissense_Mutationrs769455629c.173N>Ap.Arg58Glnp.R58QO95633protein_codingtolerated(0.54)benign(0)TCGA-39-5034-01Lunglung squamous cell carcinomaFemale>=65I/IIUnknownUnknownPD
FSTL3SNVMissense_Mutationc.786N>Ap.Phe262Leup.F262LO95633protein_codingdeleterious_low_confidence(0.02)benign(0.084)TCGA-46-3766-01Lunglung squamous cell carcinomaFemale<65I/IIUnknownUnknownSD
Page: 1 2 

Top

Related drugs of malignant transformation related genes

check buttonIdentification of chemicals and drugs interact with genes involved in malignant transfromation
(DGIdb 4.0)
Entrez IDSymbolCategoryInteraction TypesDrug Claim NameDrug NamePMIDs
Page: 1