
|
|||||
|
 | |
| |
| |
| |
| |
| |
|
Gene: FSTL1 |
Gene summary for FSTL1 |
| Gene information | Species | Human | Gene symbol | FSTL1 | Gene ID | 11167 |
| Gene name | follistatin like 1 | |
| Gene Alias | FRP | |
| Cytomap | 3q13.33 | |
| Gene Type | protein-coding | GO ID | GO:0001667 | UniProtAcc | Q12841 |
Top |
Malignant transformation analysis |
| Identification of the aberrant gene expression in precancerous and cancerous lesions by comparing the gene expression of stem-like cells in diseased tissues with normal stem cells |
| Entrez ID | Symbol | Replicates | Species | Organ | Tissue | Adj P-value | Log2FC | Malignancy |
| 11167 | FSTL1 | AEH-subject2 | Human | Endometrium | AEH | 1.36e-06 | -2.14e-01 | -0.2525 |
| 11167 | FSTL1 | AEH-subject3 | Human | Endometrium | AEH | 9.35e-09 | -3.18e-01 | -0.2576 |
| 11167 | FSTL1 | AEH-subject4 | Human | Endometrium | AEH | 1.02e-03 | 4.94e-02 | -0.2657 |
| 11167 | FSTL1 | AEH-subject5 | Human | Endometrium | AEH | 4.34e-06 | -1.96e-01 | -0.2953 |
| 11167 | FSTL1 | EEC-subject1 | Human | Endometrium | EEC | 3.86e-08 | -3.03e-01 | -0.2682 |
| 11167 | FSTL1 | EEC-subject2 | Human | Endometrium | EEC | 1.28e-21 | -4.73e-01 | -0.2607 |
| 11167 | FSTL1 | EEC-subject3 | Human | Endometrium | EEC | 4.28e-30 | -2.62e-01 | -0.2525 |
| 11167 | FSTL1 | EEC-subject4 | Human | Endometrium | EEC | 1.72e-22 | -4.59e-01 | -0.2571 |
| 11167 | FSTL1 | EEC-subject5 | Human | Endometrium | EEC | 6.26e-29 | -5.55e-01 | -0.249 |
| 11167 | FSTL1 | GSM5276935 | Human | Endometrium | EEC | 1.15e-21 | -4.98e-01 | -0.123 |
| 11167 | FSTL1 | GSM6177620_NYU_UCEC1_lib1_lib1 | Human | Endometrium | EEC | 1.15e-21 | -3.16e-01 | -0.1869 |
| 11167 | FSTL1 | GSM6177620_NYU_UCEC1_lib2_lib2 | Human | Endometrium | EEC | 3.03e-25 | -5.46e-01 | -0.1875 |
| 11167 | FSTL1 | GSM6177620_NYU_UCEC1_lib3_lib3 | Human | Endometrium | EEC | 9.52e-27 | -4.05e-01 | -0.1883 |
| 11167 | FSTL1 | GSM6177621_NYU_UCEC2_lib1_lib1 | Human | Endometrium | EEC | 1.57e-27 | -3.65e-01 | -0.1934 |
| 11167 | FSTL1 | GSM6177622_NYU_UCEC3_lib1_lib1 | Human | Endometrium | EEC | 7.42e-43 | -5.13e-01 | -0.1917 |
| 11167 | FSTL1 | GSM6177622_NYU_UCEC3_lib2_lib2 | Human | Endometrium | EEC | 9.40e-35 | -4.77e-01 | -0.1916 |
| 11167 | FSTL1 | GSM6177623_NYU_UCEC3_Vis | Human | Endometrium | EEC | 2.23e-04 | 9.67e-02 | -0.1269 |
| 11167 | FSTL1 | LZE4T | Human | Esophagus | ESCC | 4.02e-02 | -2.93e-01 | 0.0811 |
| 11167 | FSTL1 | LZE20T | Human | Esophagus | ESCC | 1.57e-02 | -3.71e-01 | 0.0662 |
| 11167 | FSTL1 | LZE24T | Human | Esophagus | ESCC | 1.15e-05 | 6.79e-02 | 0.0596 |
| Page: 1 2 3 4 5 6 |
| Tissue | Expression Dynamics | Abbreviation |
| Endometrium | 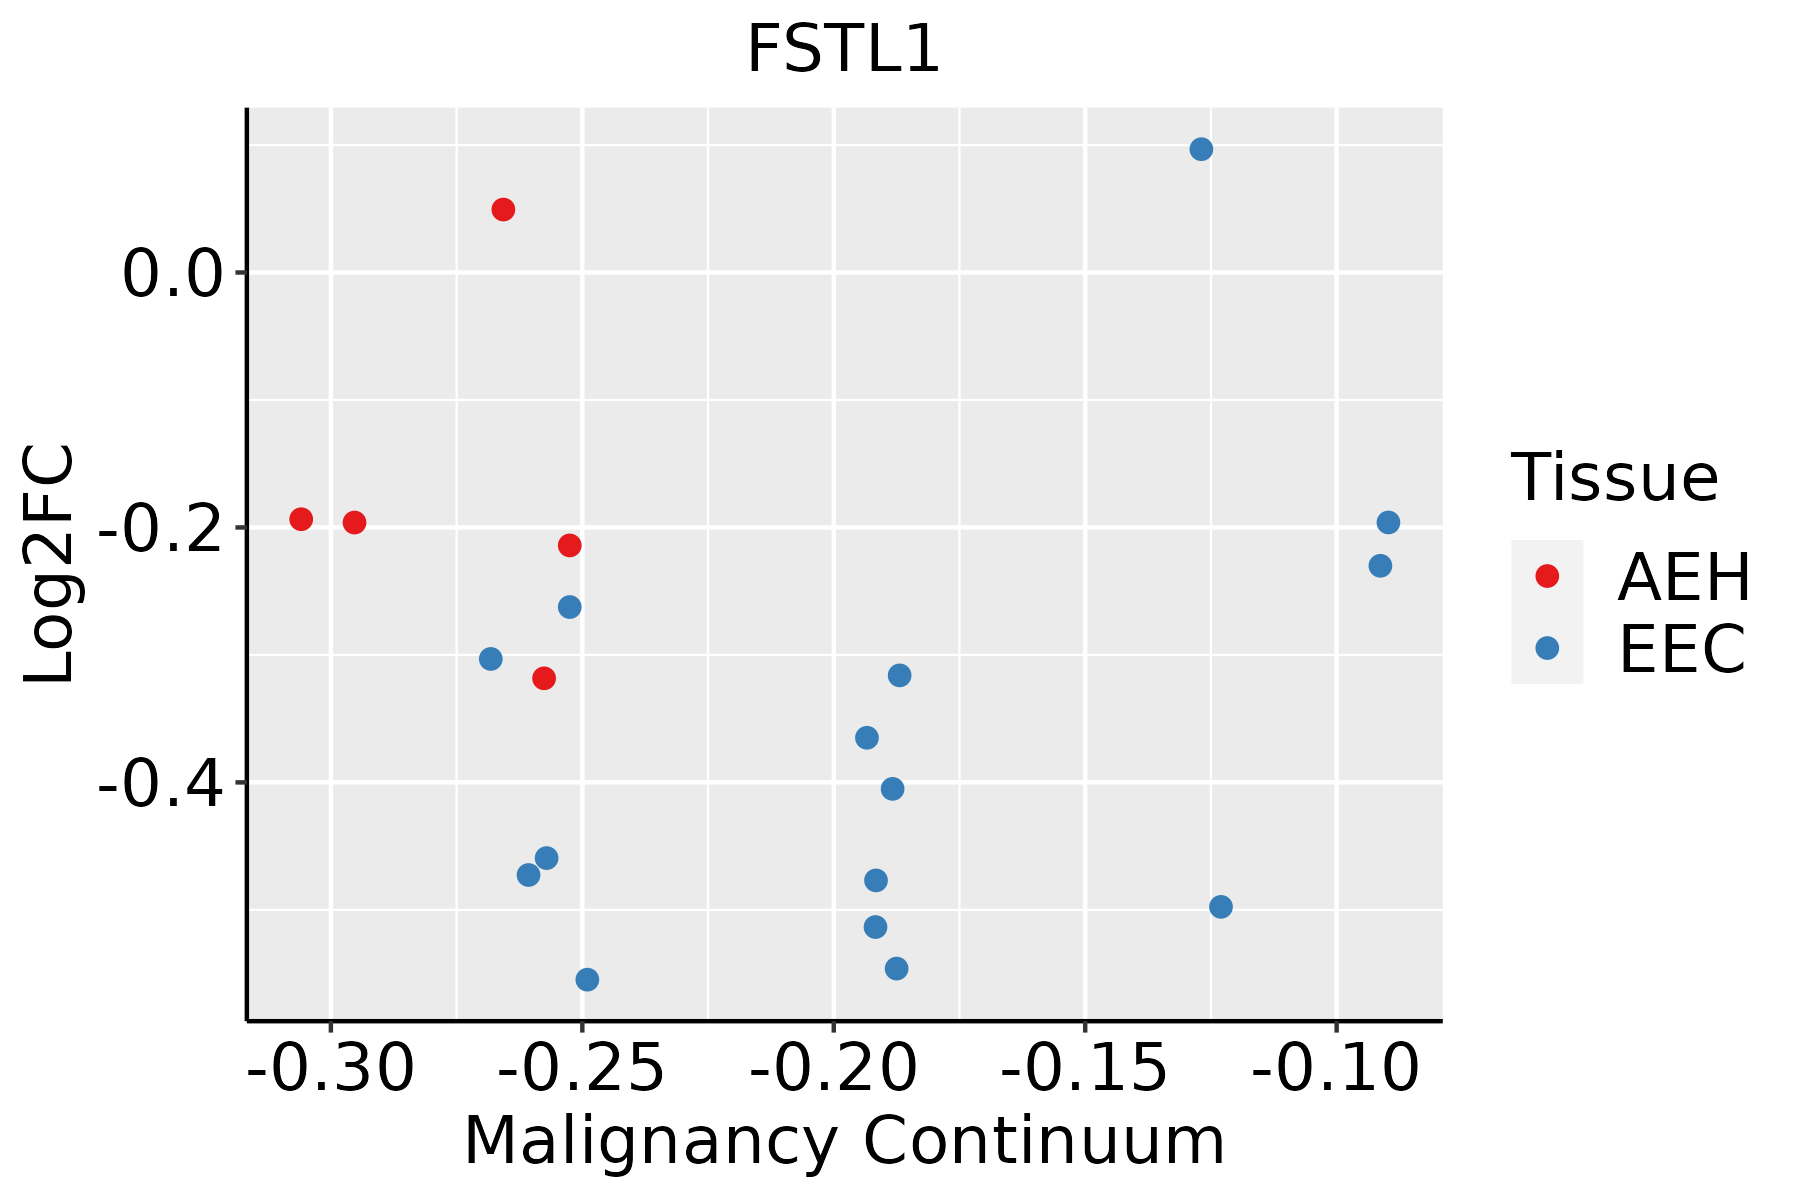 | AEH: Atypical endometrial hyperplasia |
| EEC: Endometrioid Cancer | ||
| Esophagus |  | ESCC: Esophageal squamous cell carcinoma |
| HGIN: High-grade intraepithelial neoplasias | ||
| LGIN: Low-grade intraepithelial neoplasias | ||
| Oral Cavity | 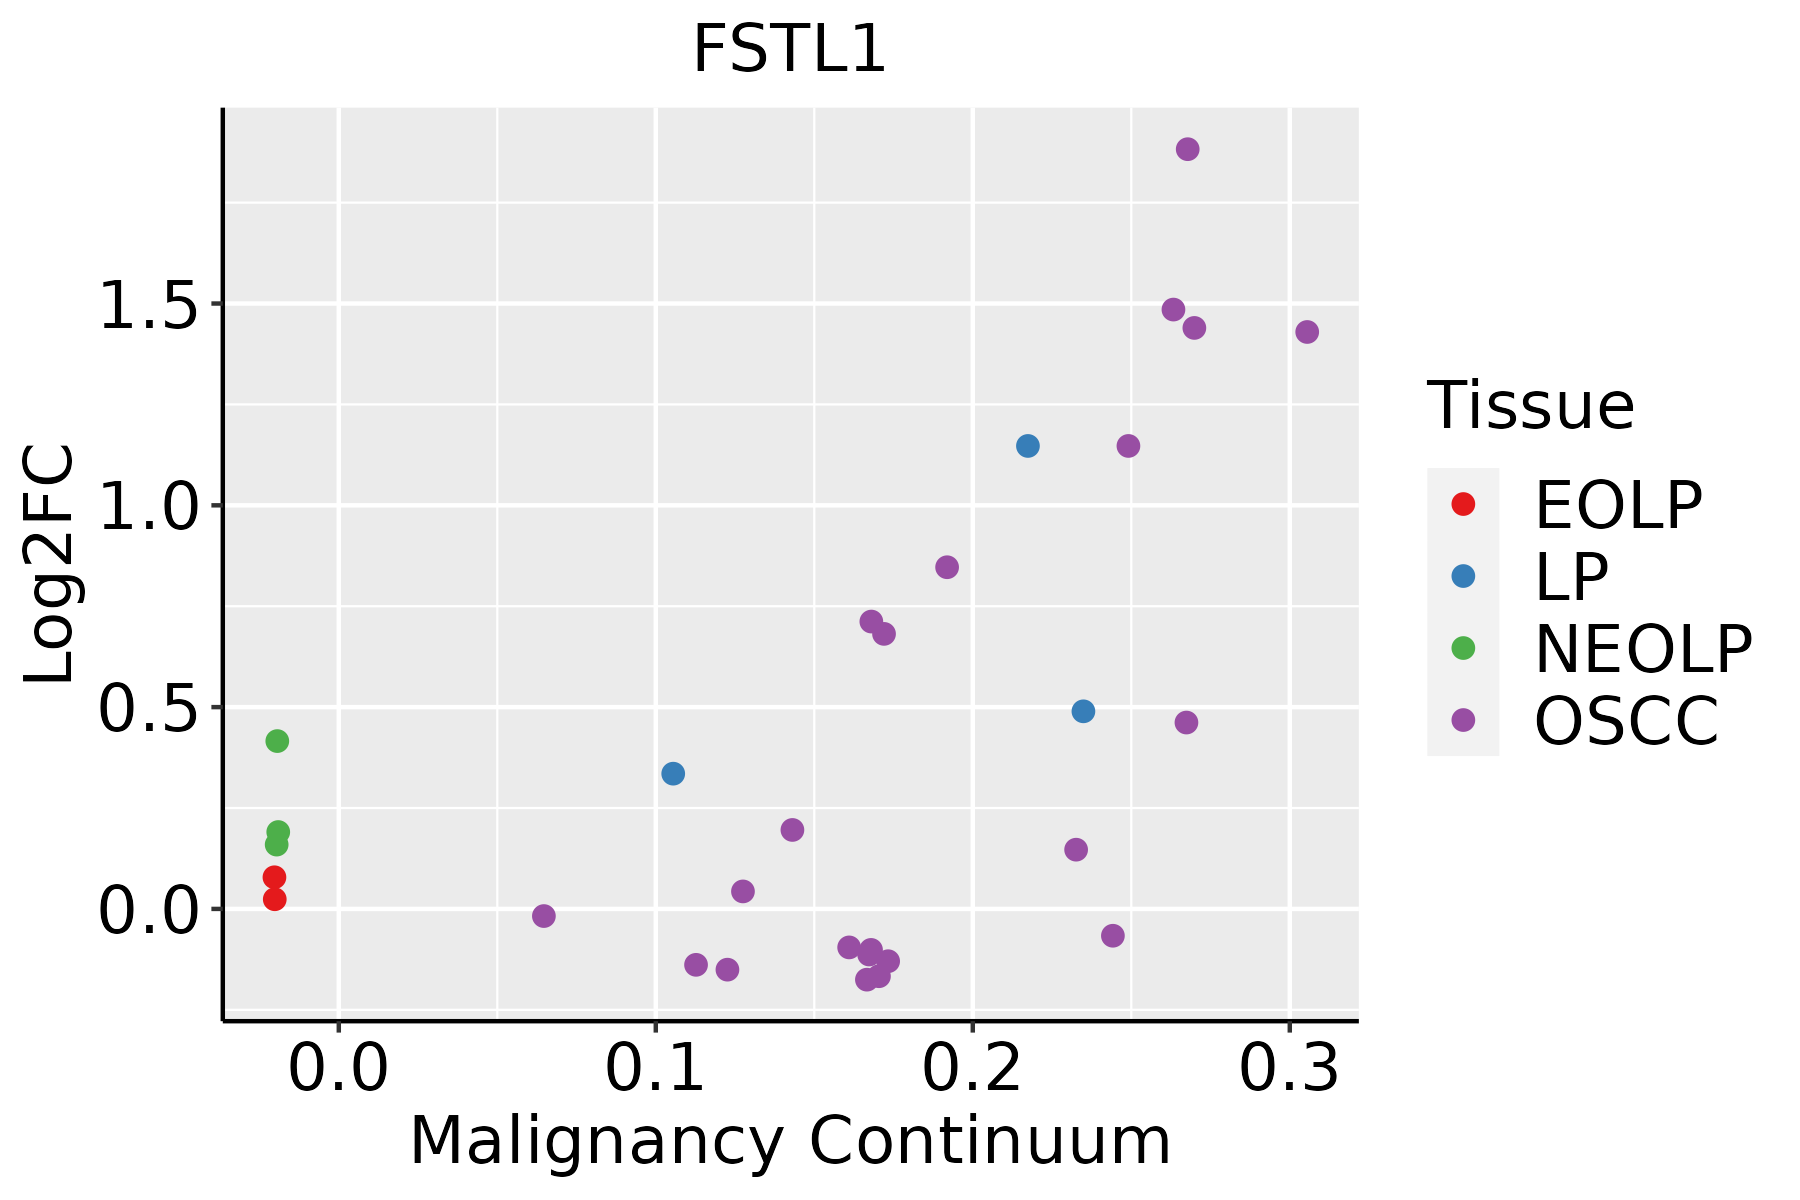 | EOLP: Erosive Oral lichen planus |
| LP: leukoplakia | ||
| NEOLP: Non-erosive oral lichen planus | ||
| OSCC: Oral squamous cell carcinoma | ||
| Prostate | 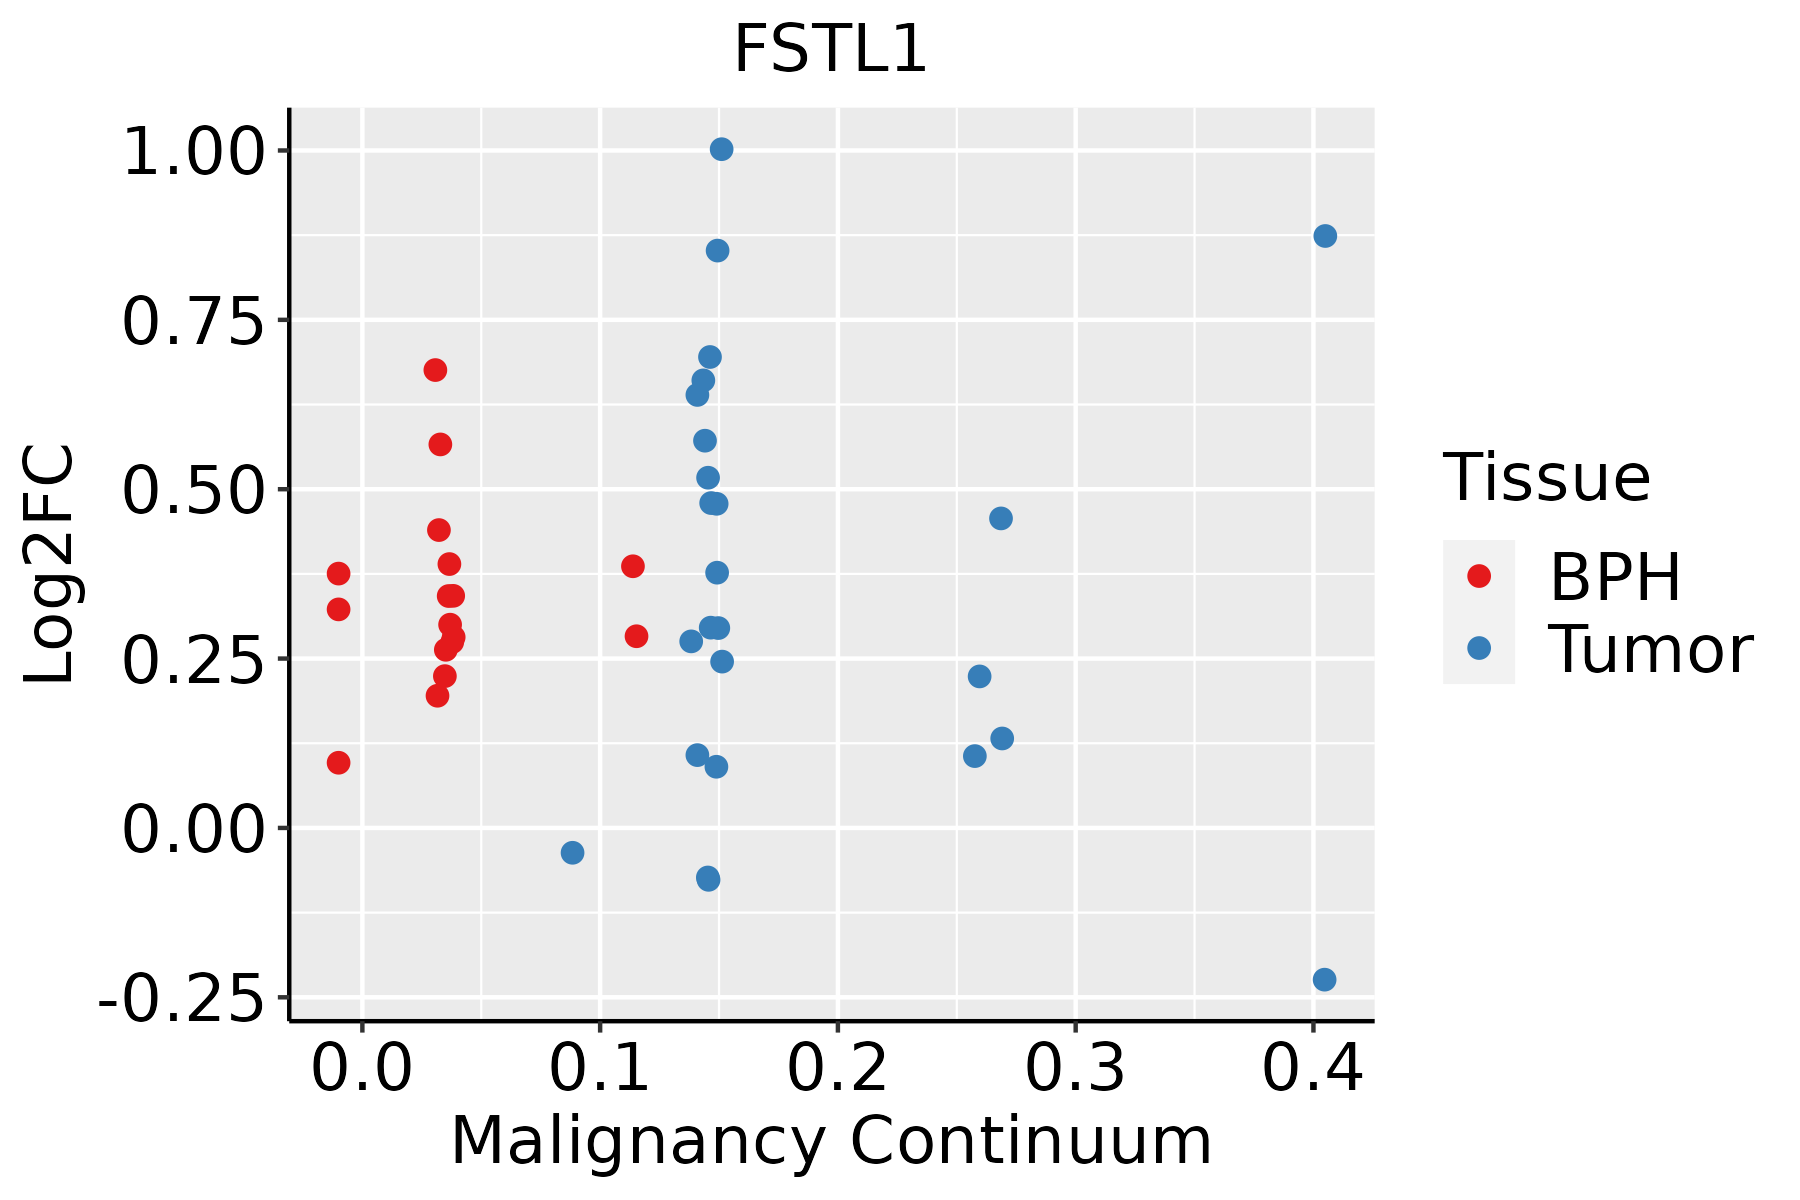 | BPH: Benign Prostatic Hyperplasia |
| Skin | 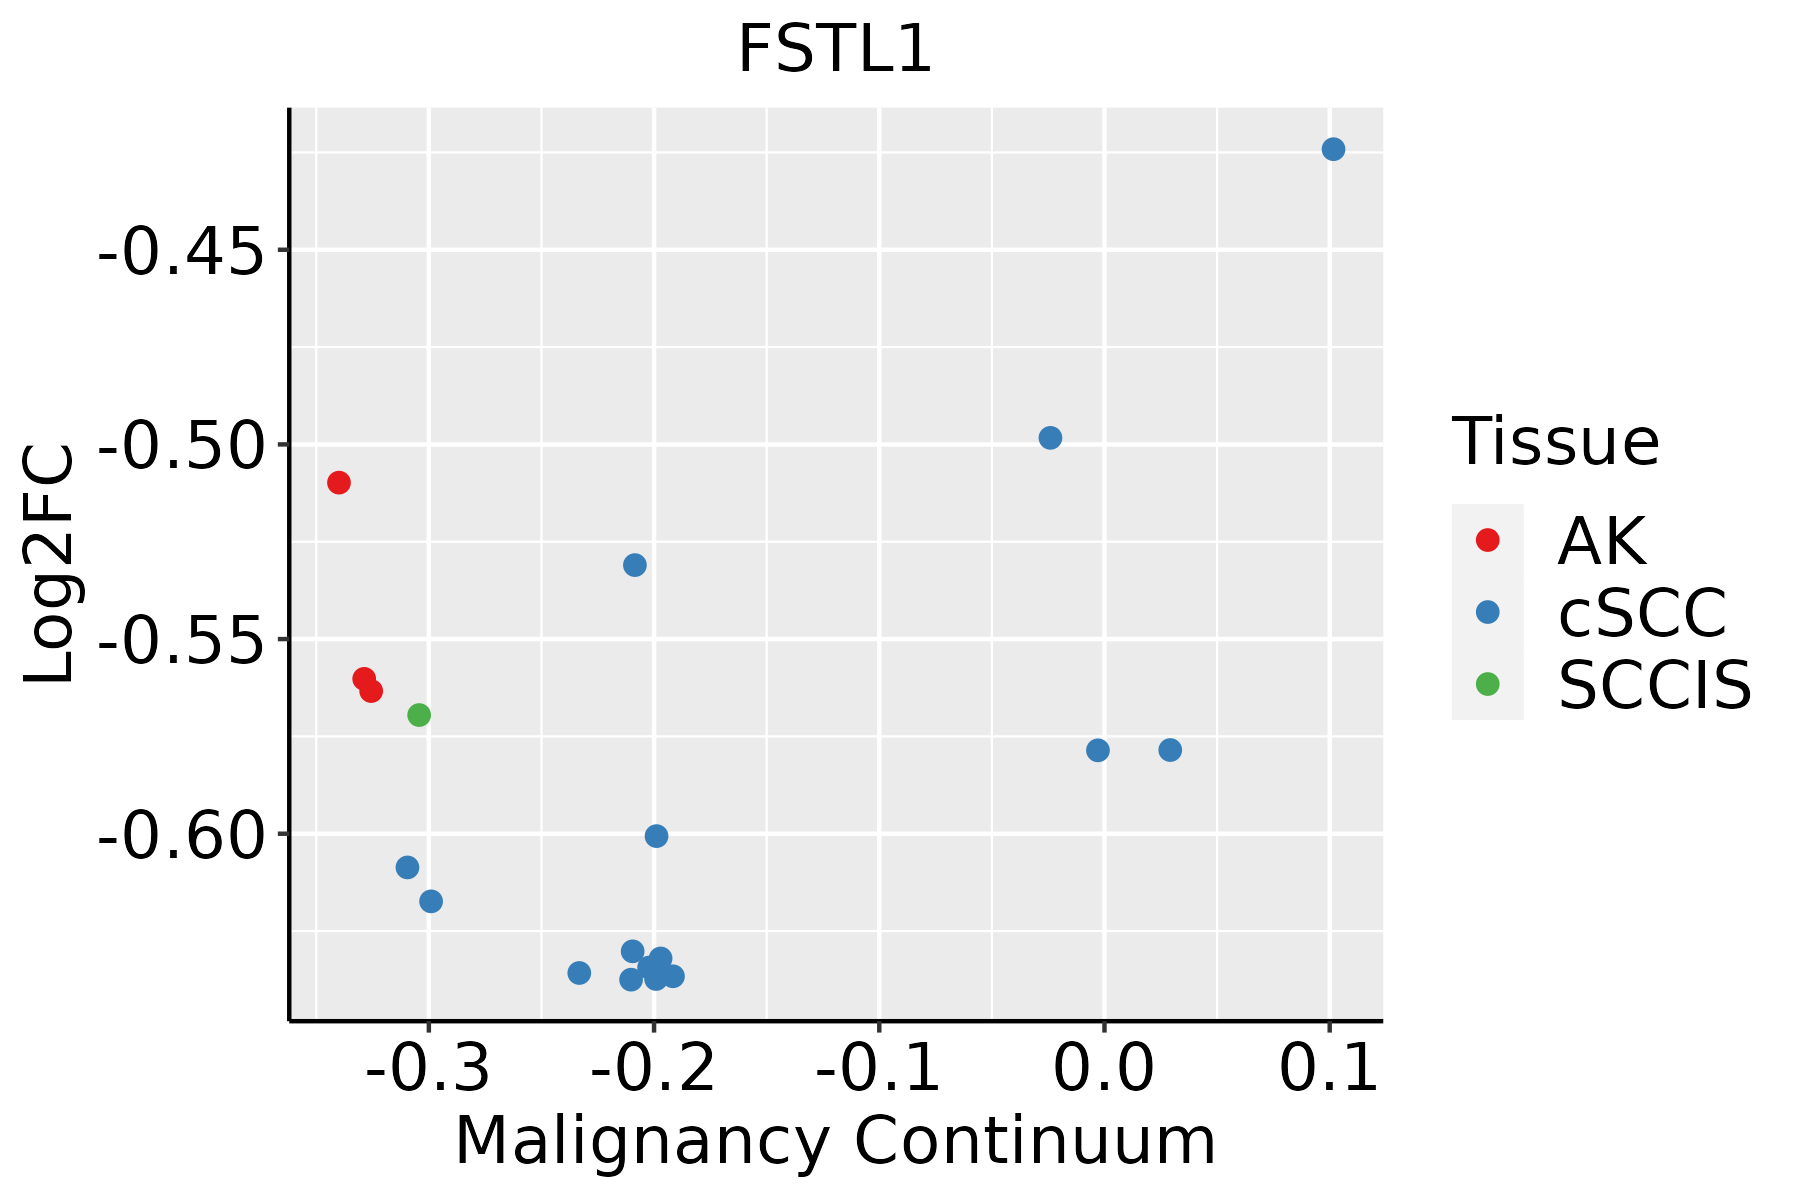 | AK: Actinic keratosis |
| cSCC: Cutaneous squamous cell carcinoma | ||
| SCCIS:squamous cell carcinoma in situ | ||
| Thyroid | 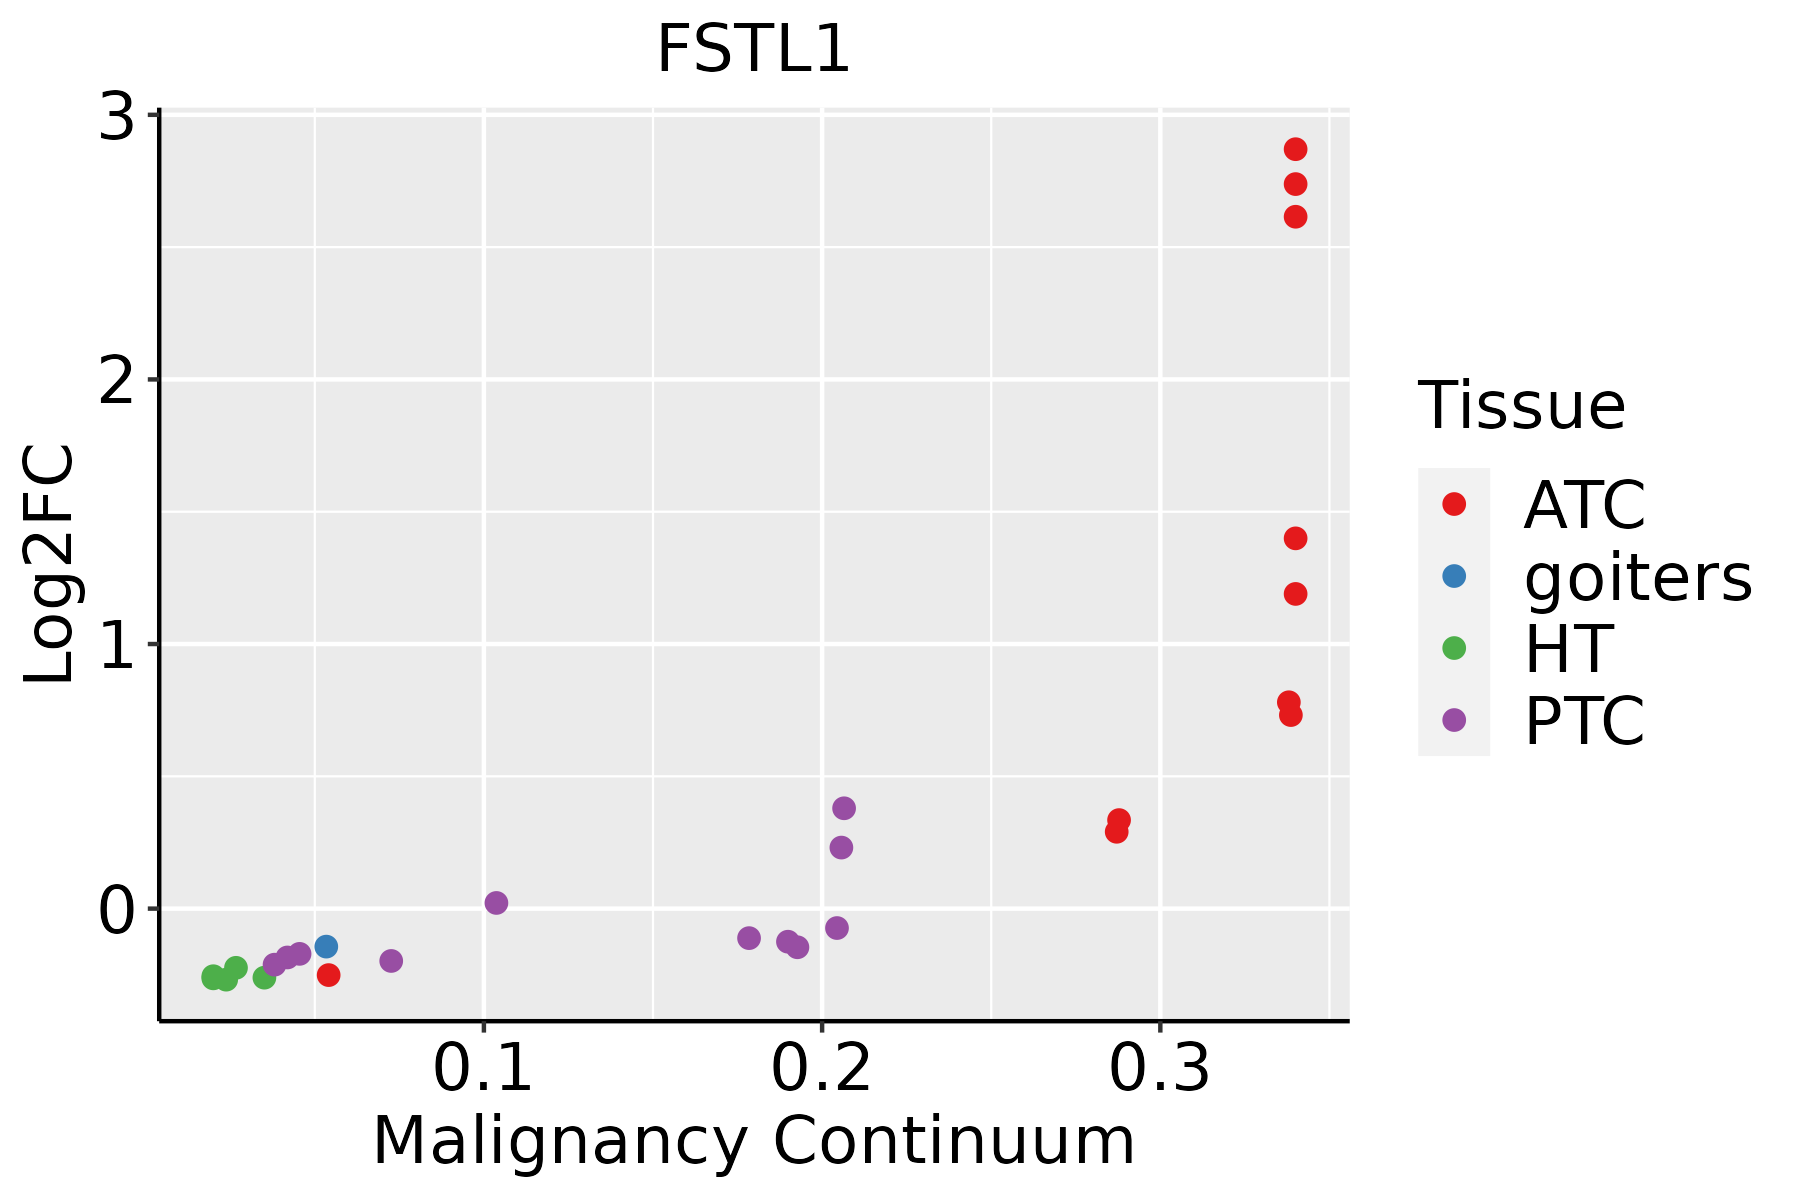 | ATC: Anaplastic thyroid cancer |
| HT: Hashimoto's thyroiditis | ||
| PTC: Papillary thyroid cancer |
| ∗log2FC in expression of this searched gene in stem-like cells from each diseased tissue sample relative to stem-like cells in normal samples in each tissue plotted against the malignancy continuum. Samples are colored based on if they are from different disease stage. |
Top |
Malignant transformation related pathway analysis |
| Find out the enriched GO biological processes and KEGG pathways involved in transition from healthy to precancer to cancer |
| Tissue | Disease Stage | Enriched GO biological Processes |
| Colorectum | AD |  |
| Colorectum | SER |  |
| Colorectum | MSS |  |
| Colorectum | MSI-H |  |
| Colorectum | FAP |  |
| ∗Top 15 enriched GO BP terms are showed in the bar plot of each disease state in each tissue. Each row represents a significant GO biological process which is colored according to the -log10(p.adjust). |
| Page: 1 2 3 4 5 6 7 8 9 |
| GO ID | Tissue | Disease Stage | Description | Gene Ratio | Bg Ratio | pvalue | p.adjust | Count |
| GO:000166710 | Endometrium | AEH | ameboidal-type cell migration | 90/2100 | 475/18723 | 3.73e-07 | 1.57e-05 | 90 |
| GO:009013014 | Endometrium | AEH | tissue migration | 73/2100 | 365/18723 | 5.79e-07 | 2.20e-05 | 73 |
| GO:009013214 | Endometrium | AEH | epithelium migration | 72/2100 | 360/18723 | 6.90e-07 | 2.55e-05 | 72 |
| GO:001063114 | Endometrium | AEH | epithelial cell migration | 71/2100 | 357/18723 | 1.02e-06 | 3.52e-05 | 71 |
| GO:00071787 | Endometrium | AEH | transmembrane receptor protein serine/threonine kinase signaling pathway | 67/2100 | 355/18723 | 1.28e-05 | 2.80e-04 | 67 |
| GO:00435428 | Endometrium | AEH | endothelial cell migration | 55/2100 | 279/18723 | 2.11e-05 | 4.15e-04 | 55 |
| GO:004887216 | Endometrium | AEH | homeostasis of number of cells | 53/2100 | 272/18723 | 4.10e-05 | 6.99e-04 | 53 |
| GO:000315810 | Endometrium | AEH | endothelium development | 31/2100 | 136/18723 | 8.53e-05 | 1.26e-03 | 31 |
| GO:00305092 | Endometrium | AEH | BMP signaling pathway | 32/2100 | 152/18723 | 3.15e-04 | 3.54e-03 | 32 |
| GO:00717722 | Endometrium | AEH | response to BMP | 32/2100 | 165/18723 | 1.38e-03 | 1.16e-02 | 32 |
| GO:00717732 | Endometrium | AEH | cellular response to BMP stimulus | 32/2100 | 165/18723 | 1.38e-03 | 1.16e-02 | 32 |
| GO:00454467 | Endometrium | AEH | endothelial cell differentiation | 24/2100 | 118/18723 | 2.71e-03 | 1.96e-02 | 24 |
| GO:00900922 | Endometrium | AEH | regulation of transmembrane receptor protein serine/threonine kinase signaling pathway | 43/2100 | 256/18723 | 4.47e-03 | 2.93e-02 | 43 |
| GO:000166716 | Endometrium | EEC | ameboidal-type cell migration | 91/2168 | 475/18723 | 7.87e-07 | 2.80e-05 | 91 |
| GO:009013015 | Endometrium | EEC | tissue migration | 73/2168 | 365/18723 | 1.91e-06 | 5.78e-05 | 73 |
| GO:009013215 | Endometrium | EEC | epithelium migration | 72/2168 | 360/18723 | 2.24e-06 | 6.59e-05 | 72 |
| GO:001063115 | Endometrium | EEC | epithelial cell migration | 71/2168 | 357/18723 | 3.24e-06 | 8.85e-05 | 71 |
| GO:000717814 | Endometrium | EEC | transmembrane receptor protein serine/threonine kinase signaling pathway | 68/2168 | 355/18723 | 1.90e-05 | 3.50e-04 | 68 |
| GO:004354213 | Endometrium | EEC | endothelial cell migration | 55/2168 | 279/18723 | 5.12e-05 | 8.18e-04 | 55 |
| GO:000315813 | Endometrium | EEC | endothelium development | 32/2168 | 136/18723 | 6.37e-05 | 9.48e-04 | 32 |
| Page: 1 2 3 4 5 6 7 8 |
| Pathway ID | Tissue | Disease Stage | Description | Gene Ratio | Bg Ratio | pvalue | p.adjust | qvalue | Count |
| Page: 1 |
Top |
Cell-cell communication analysis |
| Identification of potential cell-cell interactions between two cell types and their ligand-receptor pairs for different disease states |
| Ligand | Receptor | LRpair | Pathway | Tissue | Disease Stage |
| Page: 1 |
Top |
Single-cell gene regulatory network inference analysis |
| Find out the significant the regulons (TFs) and the target genes of each regulon across cell types for different disease states |
| TF | Cell Type | Tissue | Disease Stage | Target Gene | RSS | Regulon Activity |
| ∗The dot plots of a searched regulon are shown for all cell subpopulations in each disease state of each tissue based on the regulon specific score inferred using pySCENIC and by calculating the average expression. |
| Page: 1 |
Top |
Somatic mutation of malignant transformation related genes |
| Annotation of somatic variants for genes involved in malignant transformation |
| Hugo Symbol | Variant Class | Variant Classification | dbSNP RS | HGVSc | HGVSp | HGVSp Short | SWISSPROT | BIOTYPE | SIFT | PolyPhen | Tumor Sample Barcode | Tissue | Histology | Sex | Age | Stage | Therapy Types | Drugs | Outcome |
| FSTL1 | SNV | Missense_Mutation | rs748013373 | c.365N>A | p.Arg122Gln | p.R122Q | Q12841 | protein_coding | deleterious(0) | possibly_damaging(0.797) | TCGA-AN-A046-01 | Breast | breast invasive carcinoma | Female | >=65 | I/II | Unknown | Unknown | SD |
| FSTL1 | insertion | Frame_Shift_Ins | novel | c.474_475insC | p.Gly159ArgfsTer2 | p.G159Rfs*2 | Q12841 | protein_coding | TCGA-A8-A0A4-01 | Breast | breast invasive carcinoma | Female | >=65 | I/II | Hormone Therapy | tamoxiphen | CR | ||
| FSTL1 | insertion | Frame_Shift_Ins | novel | c.472_473insGTGCCCCAGGAGACCAAGGAGGCTCTCTCTGCTCAATACAGTAC | p.Asn158SerfsTer27 | p.N158Sfs*27 | Q12841 | protein_coding | TCGA-A8-A0A4-01 | Breast | breast invasive carcinoma | Female | >=65 | I/II | Hormone Therapy | tamoxiphen | CR | ||
| FSTL1 | SNV | Missense_Mutation | c.688N>C | p.Glu230Gln | p.E230Q | Q12841 | protein_coding | tolerated(0.17) | benign(0.167) | TCGA-VS-A9UI-01 | Cervix | cervical & endocervical cancer | Female | >=65 | I/II | Unknown | Unknown | SD | |
| FSTL1 | SNV | Missense_Mutation | rs143843913 | c.716N>T | p.Thr239Met | p.T239M | Q12841 | protein_coding | tolerated(0.08) | possibly_damaging(0.891) | TCGA-A6-6780-01 | Colorectum | colon adenocarcinoma | Male | >=65 | I/II | Unknown | Unknown | SD |
| FSTL1 | SNV | Missense_Mutation | c.682N>T | p.Pro228Ser | p.P228S | Q12841 | protein_coding | deleterious(0) | probably_damaging(0.999) | TCGA-AA-3846-01 | Colorectum | colon adenocarcinoma | Female | >=65 | I/II | Unknown | Unknown | SD | |
| FSTL1 | SNV | Missense_Mutation | c.556G>T | p.Asp186Tyr | p.D186Y | Q12841 | protein_coding | deleterious(0) | possibly_damaging(0.541) | TCGA-AA-3966-01 | Colorectum | colon adenocarcinoma | Female | >=65 | I/II | Unknown | Unknown | SD | |
| FSTL1 | SNV | Missense_Mutation | c.674N>A | p.Ser225Tyr | p.S225Y | Q12841 | protein_coding | tolerated(0.16) | benign(0.005) | TCGA-AA-3994-01 | Colorectum | colon adenocarcinoma | Male | >=65 | III/IV | Chemotherapy | capecitabine | CR | |
| FSTL1 | SNV | Missense_Mutation | rs376856380 | c.371N>A | p.Arg124His | p.R124H | Q12841 | protein_coding | tolerated(0.2) | possibly_damaging(0.828) | TCGA-CA-6717-01 | Colorectum | colon adenocarcinoma | Male | <65 | I/II | Chemotherapy | oxaliplatin | CR |
| FSTL1 | SNV | Missense_Mutation | rs554312023 | c.368G>A | p.Arg123His | p.R123H | Q12841 | protein_coding | tolerated(0.15) | benign(0.012) | TCGA-AG-3881-01 | Colorectum | rectum adenocarcinoma | Female | >=65 | I/II | Unknown | Unknown | SD |
| Page: 1 2 3 4 |
Top |
Related drugs of malignant transformation related genes |
| Identification of chemicals and drugs interact with genes involved in malignant transfromation |
| (DGIdb 4.0) |
| Entrez ID | Symbol | Category | Interaction Types | Drug Claim Name | Drug Name | PMIDs |
| Page: 1 |

Copyright 2023-Present -The University of Texas Health Science Center at Houston |