
|
|||||
|
 | |
| |
| |
| |
| |
| |
|
Gene: FSCN1 |
Gene summary for FSCN1 |
| Gene information | Species | Human | Gene symbol | FSCN1 | Gene ID | 6624 |
| Gene name | fascin actin-bundling protein 1 | |
| Gene Alias | FAN1 | |
| Cytomap | 7p22.1 | |
| Gene Type | protein-coding | GO ID | GO:0006928 | UniProtAcc | B3KTA3 |
Top |
Malignant transformation analysis |
| Identification of the aberrant gene expression in precancerous and cancerous lesions by comparing the gene expression of stem-like cells in diseased tissues with normal stem cells |
| Entrez ID | Symbol | Replicates | Species | Organ | Tissue | Adj P-value | Log2FC | Malignancy |
| 6624 | FSCN1 | CA_HPV_1 | Human | Cervix | CC | 1.19e-02 | 8.45e-02 | 0.0264 |
| 6624 | FSCN1 | Tumor | Human | Cervix | CC | 3.07e-26 | 6.54e-01 | 0.1241 |
| 6624 | FSCN1 | sample3 | Human | Cervix | CC | 1.18e-43 | 7.61e-01 | 0.1387 |
| 6624 | FSCN1 | H2 | Human | Cervix | HSIL_HPV | 2.83e-03 | -1.60e-01 | 0.0632 |
| 6624 | FSCN1 | T1 | Human | Cervix | CC | 1.03e-03 | 3.39e-01 | 0.0918 |
| 6624 | FSCN1 | T3 | Human | Cervix | CC | 7.11e-41 | 7.55e-01 | 0.1389 |
| 6624 | FSCN1 | LZE4T | Human | Esophagus | ESCC | 4.19e-22 | 1.23e+00 | 0.0811 |
| 6624 | FSCN1 | LZE7T | Human | Esophagus | ESCC | 9.36e-03 | 7.26e-01 | 0.0667 |
| 6624 | FSCN1 | LZE22T | Human | Esophagus | ESCC | 1.64e-08 | 1.80e+00 | 0.068 |
| 6624 | FSCN1 | P1T-E | Human | Esophagus | ESCC | 1.77e-05 | 1.55e+00 | 0.0875 |
| 6624 | FSCN1 | P2T-E | Human | Esophagus | ESCC | 7.61e-54 | 1.49e+00 | 0.1177 |
| 6624 | FSCN1 | P4T-E | Human | Esophagus | ESCC | 1.57e-42 | 1.69e+00 | 0.1323 |
| 6624 | FSCN1 | P5T-E | Human | Esophagus | ESCC | 4.18e-45 | 1.45e+00 | 0.1327 |
| 6624 | FSCN1 | P8T-E | Human | Esophagus | ESCC | 3.18e-02 | -3.86e-02 | 0.0889 |
| 6624 | FSCN1 | P9T-E | Human | Esophagus | ESCC | 7.65e-20 | 9.13e-01 | 0.1131 |
| 6624 | FSCN1 | P10T-E | Human | Esophagus | ESCC | 3.19e-29 | 8.76e-01 | 0.116 |
| 6624 | FSCN1 | P11T-E | Human | Esophagus | ESCC | 3.30e-27 | 2.91e+00 | 0.1426 |
| 6624 | FSCN1 | P12T-E | Human | Esophagus | ESCC | 2.37e-43 | 1.57e+00 | 0.1122 |
| 6624 | FSCN1 | P15T-E | Human | Esophagus | ESCC | 9.64e-51 | 2.35e+00 | 0.1149 |
| 6624 | FSCN1 | P16T-E | Human | Esophagus | ESCC | 1.74e-61 | 1.78e+00 | 0.1153 |
| Page: 1 2 3 4 5 6 7 |
| Tissue | Expression Dynamics | Abbreviation |
| Cervix | 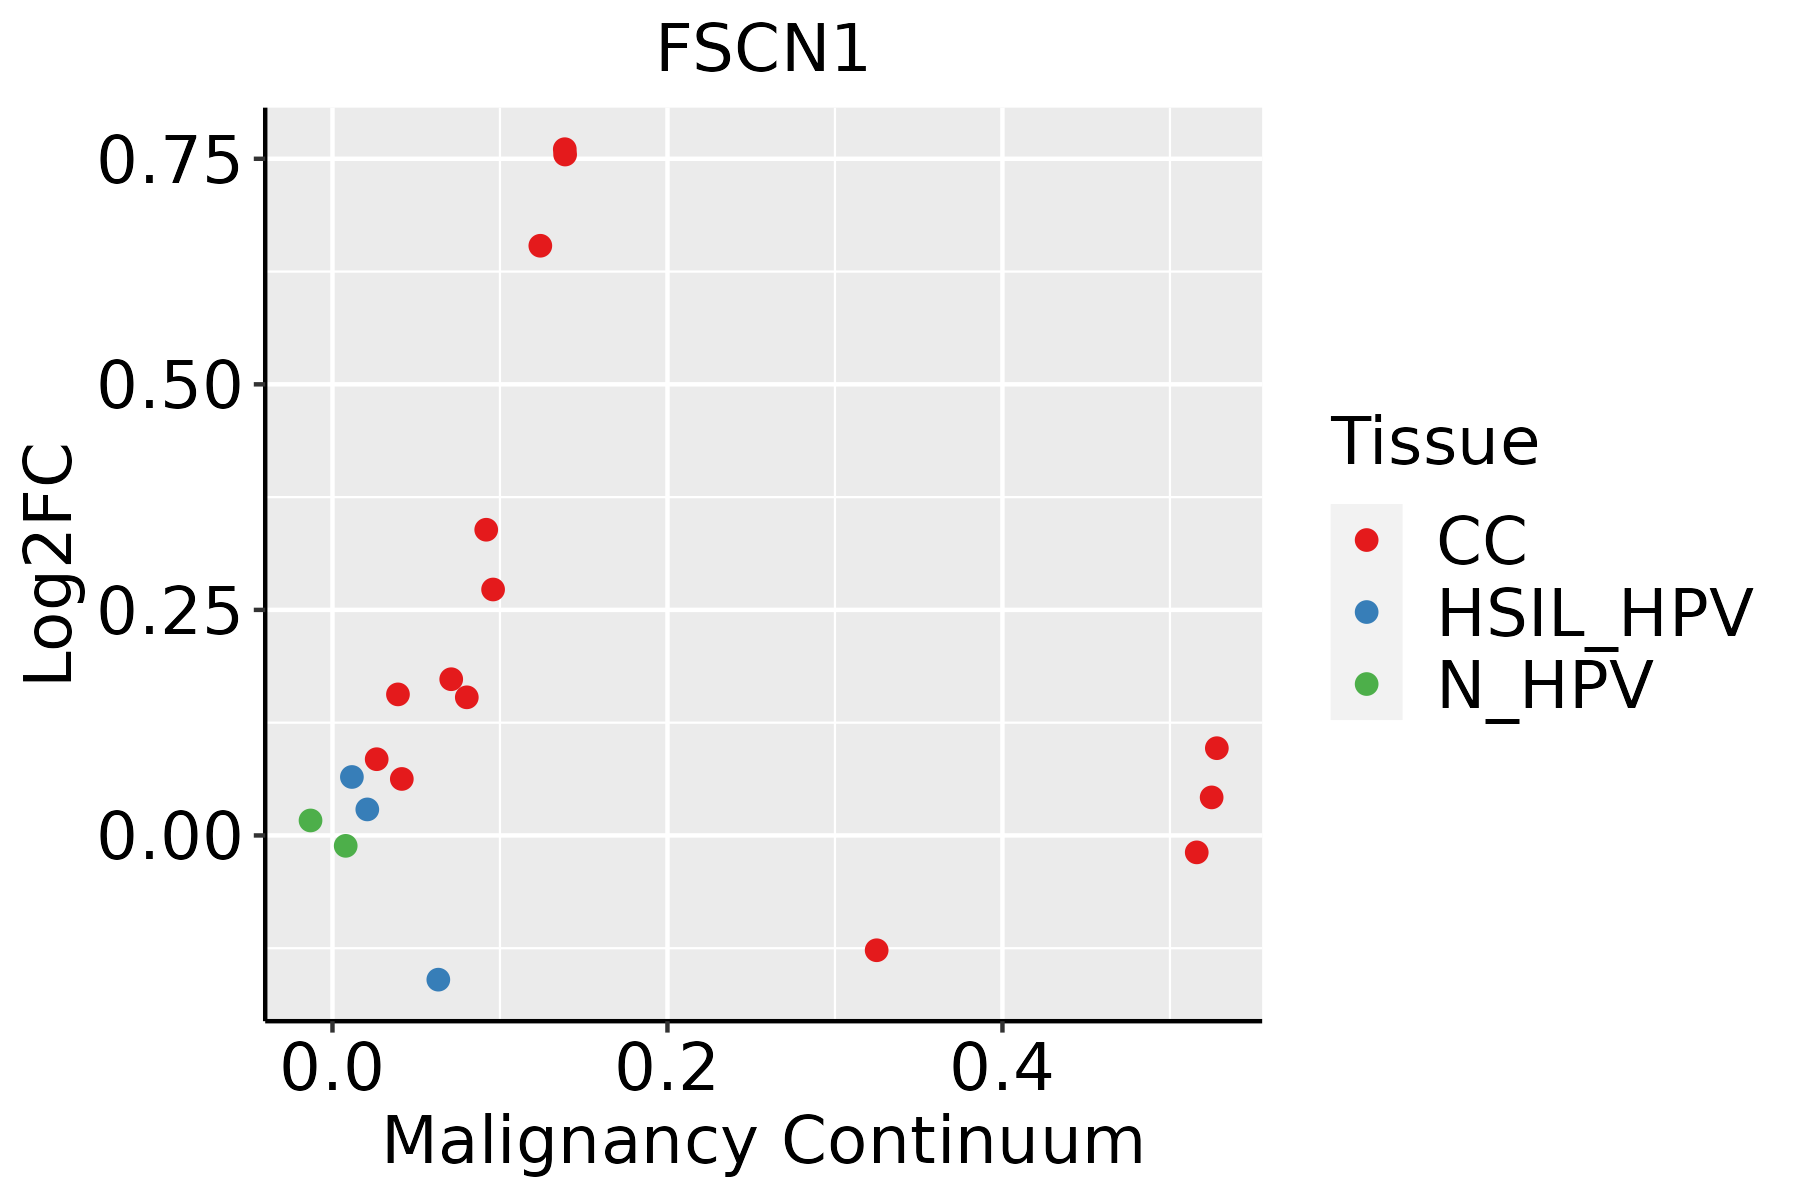 | CC: Cervix cancer |
| HSIL_HPV: HPV-infected high-grade squamous intraepithelial lesions | ||
| N_HPV: HPV-infected normal cervix | ||
| Esophagus | 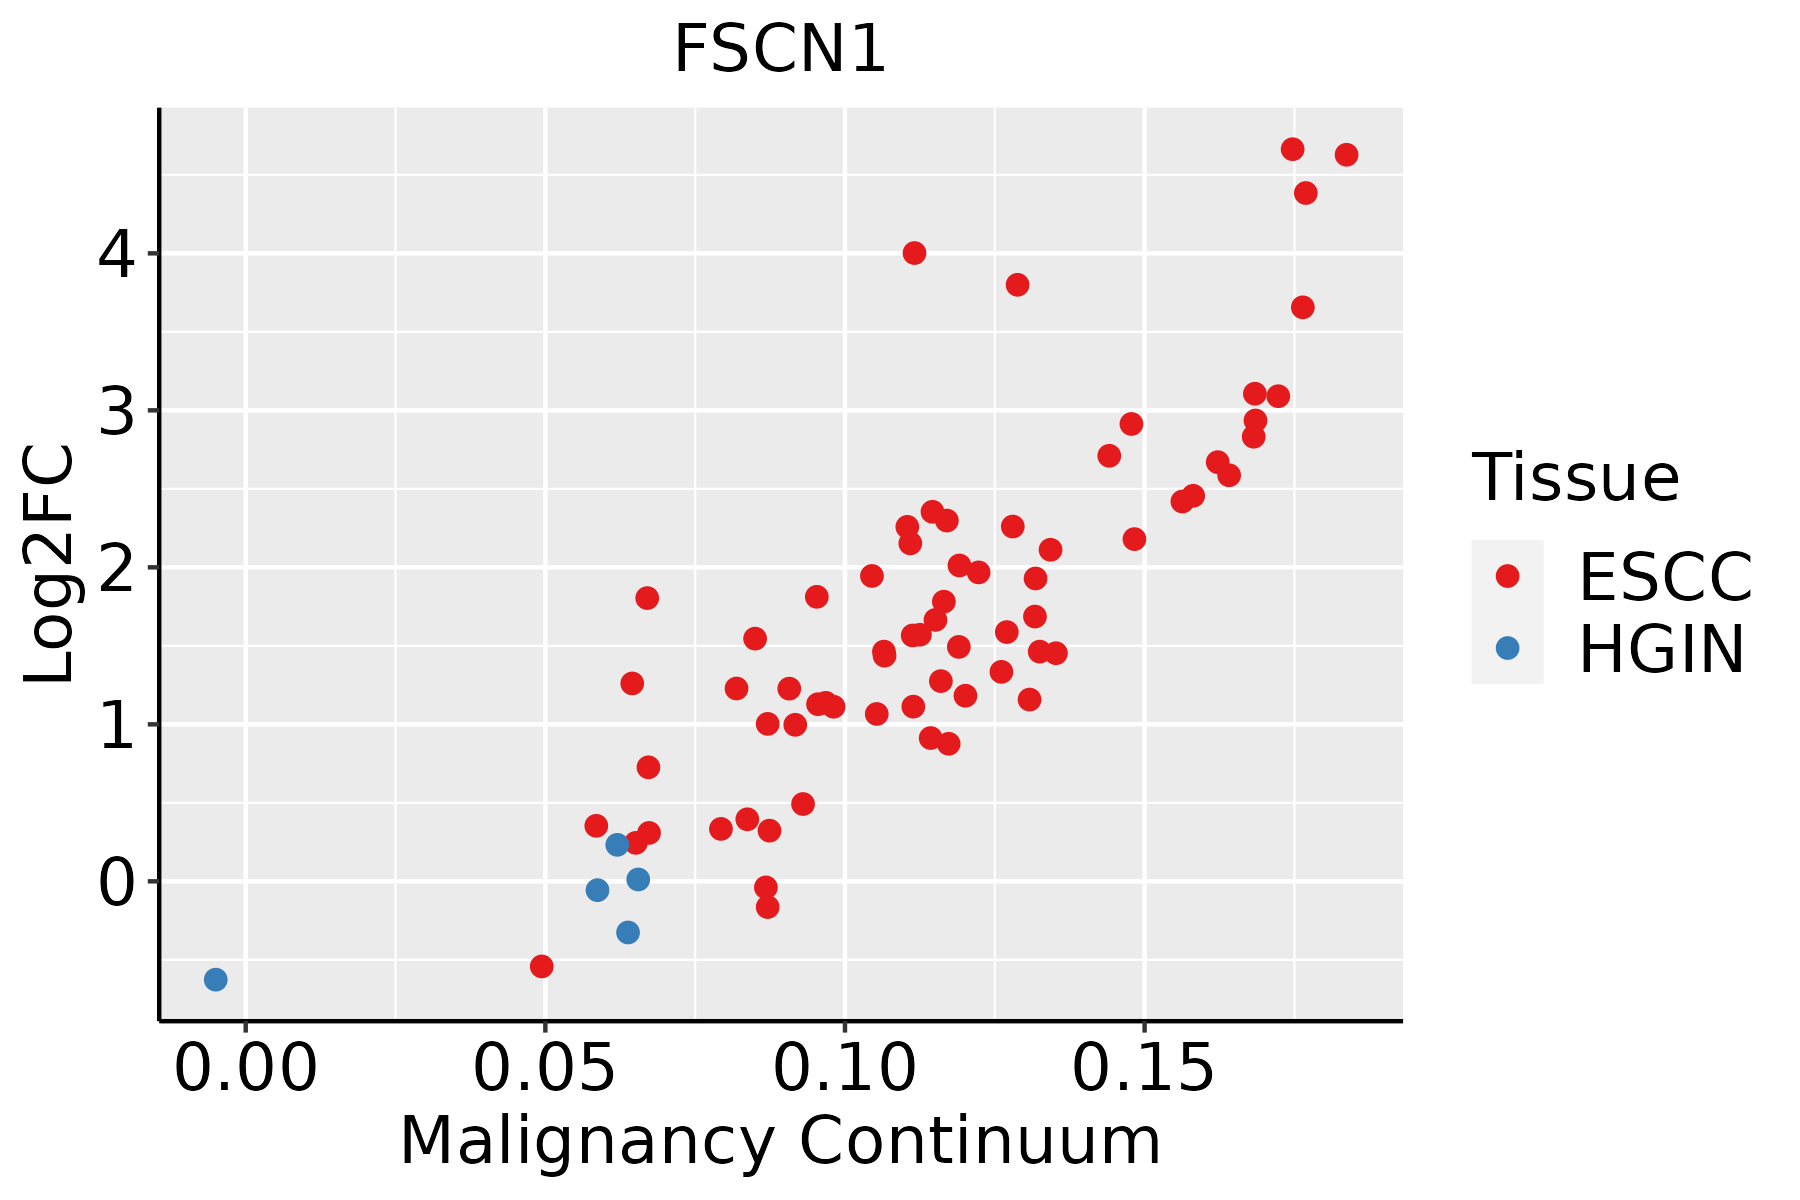 | ESCC: Esophageal squamous cell carcinoma |
| HGIN: High-grade intraepithelial neoplasias | ||
| LGIN: Low-grade intraepithelial neoplasias | ||
| Liver | 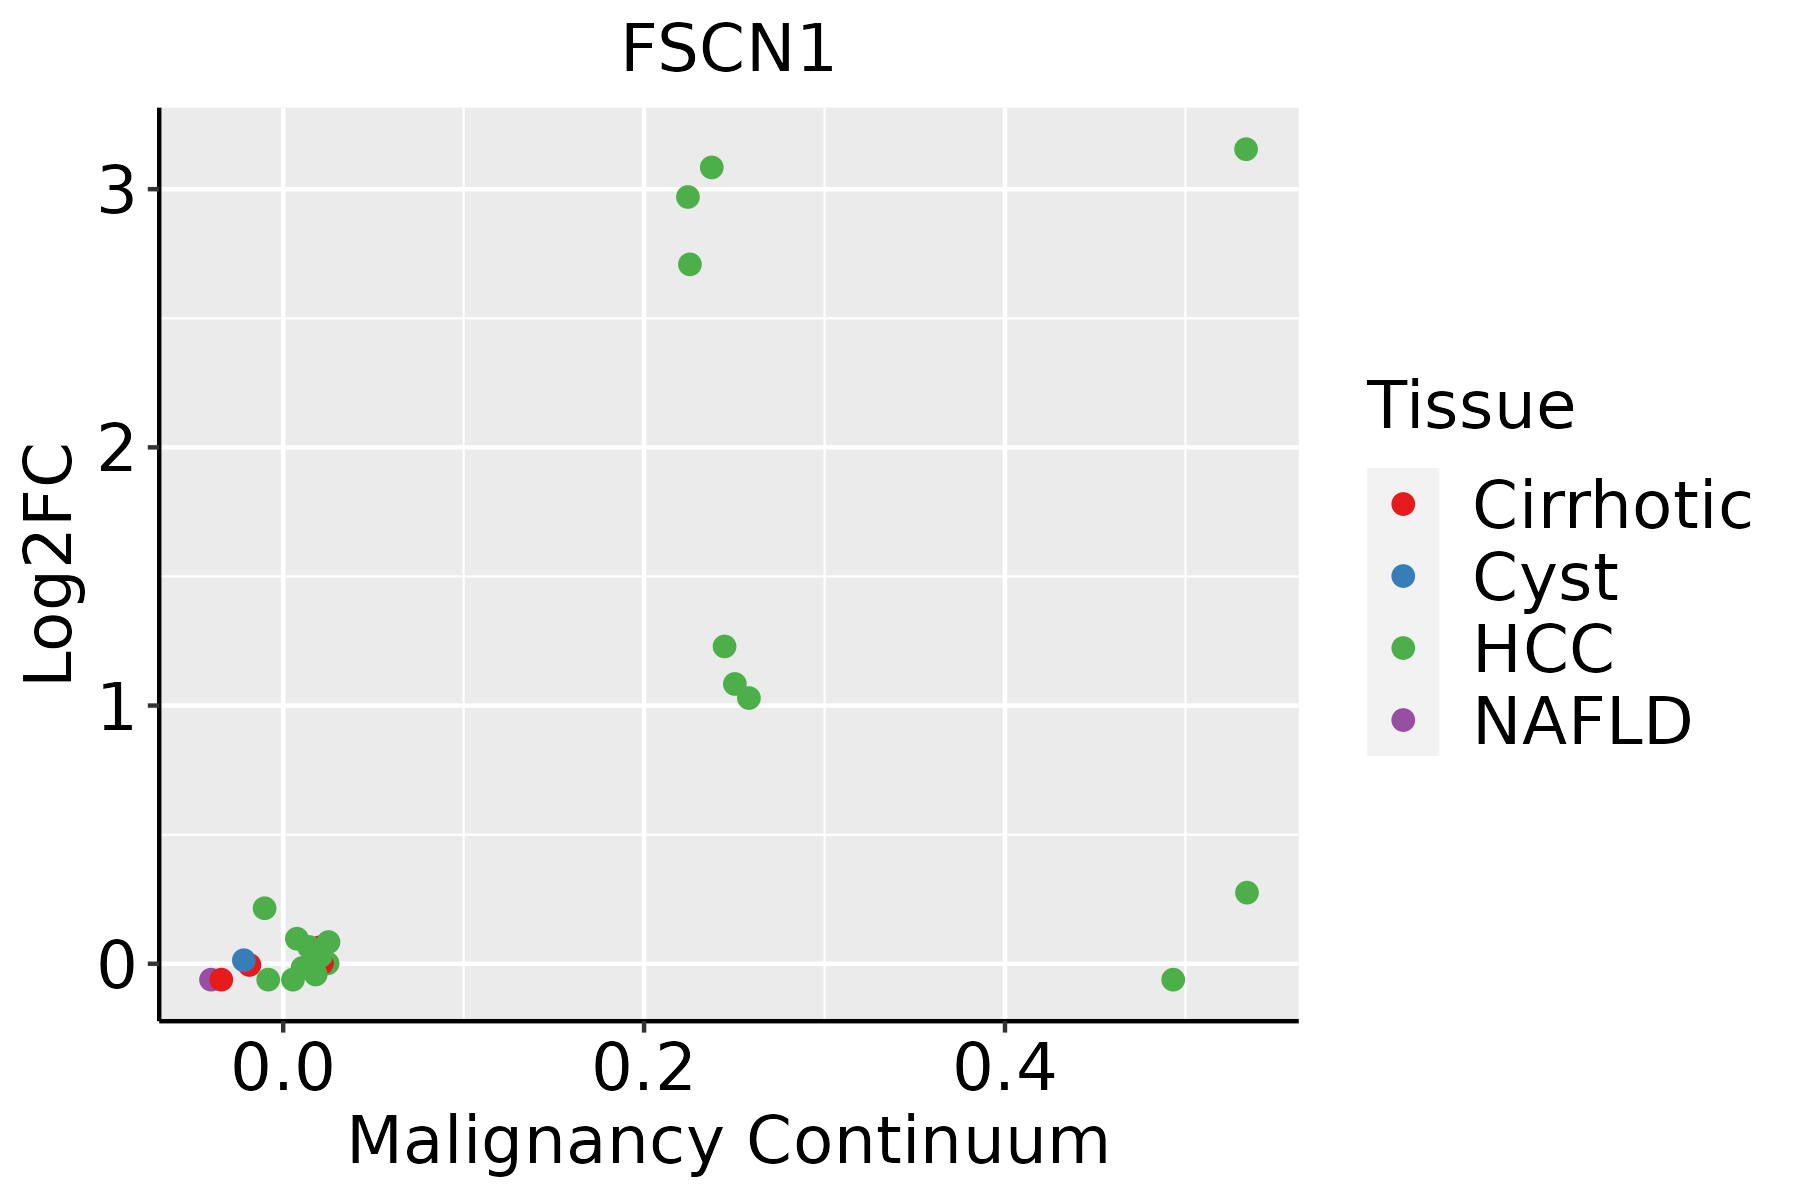 | HCC: Hepatocellular carcinoma |
| NAFLD: Non-alcoholic fatty liver disease | ||
| Oral Cavity |  | EOLP: Erosive Oral lichen planus |
| LP: leukoplakia | ||
| NEOLP: Non-erosive oral lichen planus | ||
| OSCC: Oral squamous cell carcinoma | ||
| Skin | 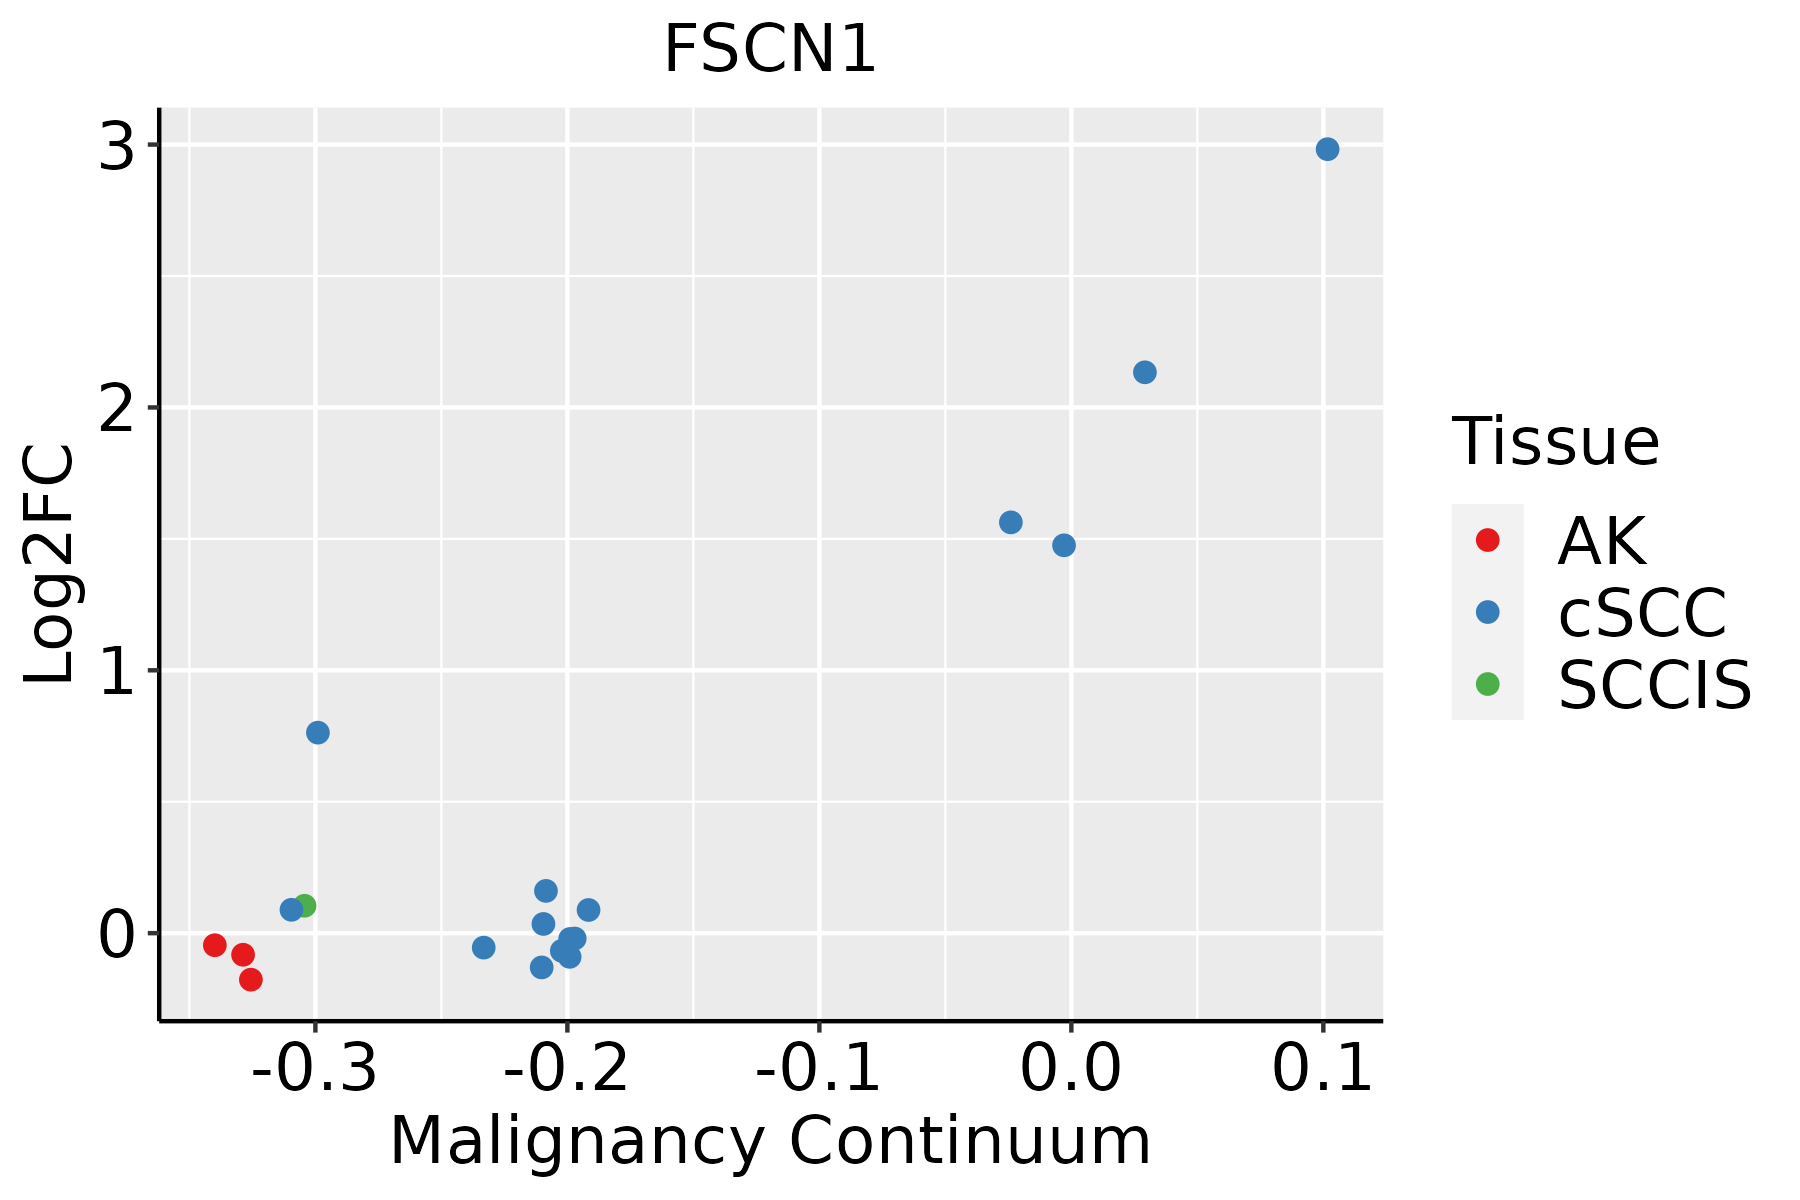 | AK: Actinic keratosis |
| cSCC: Cutaneous squamous cell carcinoma | ||
| SCCIS:squamous cell carcinoma in situ | ||
| Thyroid | 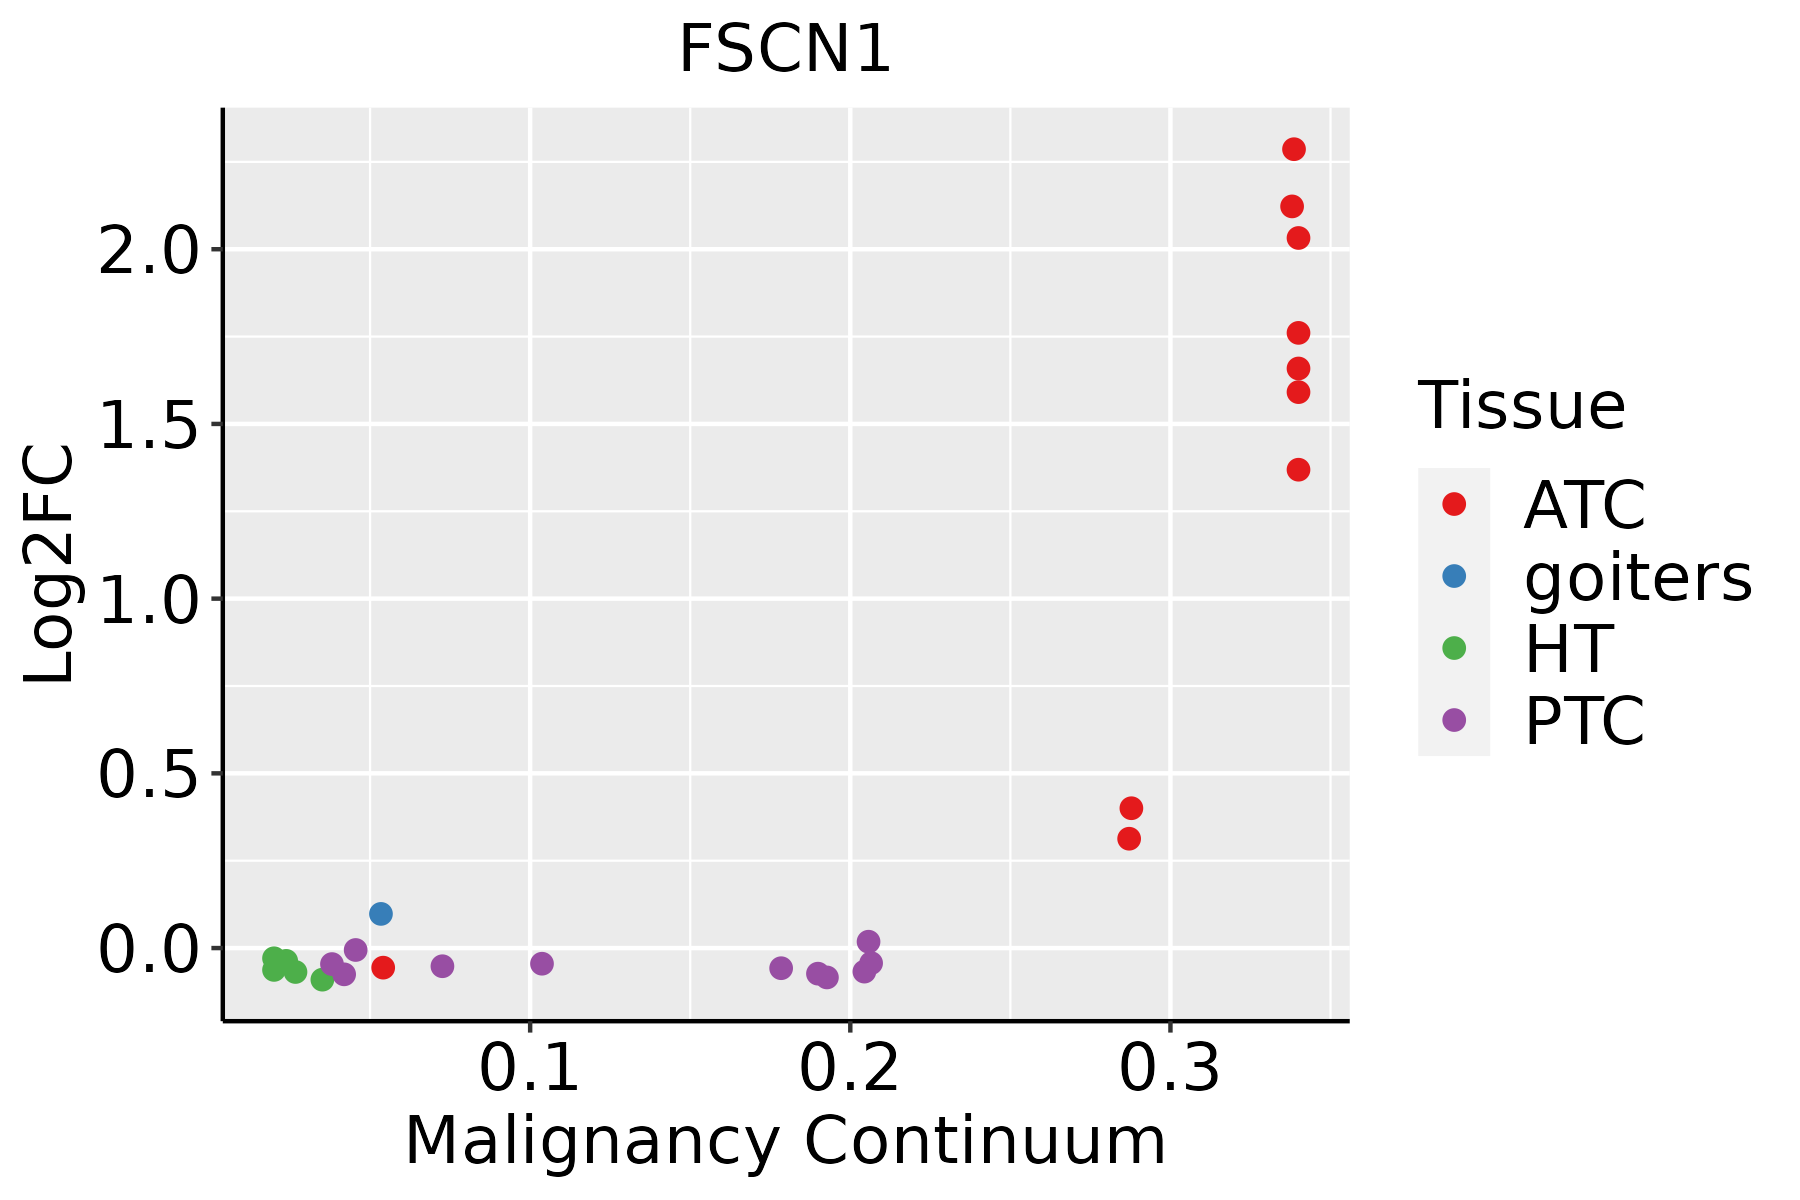 | ATC: Anaplastic thyroid cancer |
| HT: Hashimoto's thyroiditis | ||
| PTC: Papillary thyroid cancer |
| ∗log2FC in expression of this searched gene in stem-like cells from each diseased tissue sample relative to stem-like cells in normal samples in each tissue plotted against the malignancy continuum. Samples are colored based on if they are from different disease stage. |
Top |
Malignant transformation related pathway analysis |
| Find out the enriched GO biological processes and KEGG pathways involved in transition from healthy to precancer to cancer |
| Tissue | Disease Stage | Enriched GO biological Processes |
| Colorectum | AD |  |
| Colorectum | SER |  |
| Colorectum | MSS |  |
| Colorectum | MSI-H |  |
| Colorectum | FAP |  |
| ∗Top 15 enriched GO BP terms are showed in the bar plot of each disease state in each tissue. Each row represents a significant GO biological process which is colored according to the -log10(p.adjust). |
| Page: 1 2 3 4 5 6 7 8 9 |
| GO ID | Tissue | Disease Stage | Description | Gene Ratio | Bg Ratio | pvalue | p.adjust | Count |
| GO:000701510 | Cervix | CC | actin filament organization | 109/2311 | 442/18723 | 4.92e-13 | 2.45e-10 | 109 |
| GO:003297010 | Cervix | CC | regulation of actin filament-based process | 96/2311 | 397/18723 | 4.00e-11 | 8.54e-09 | 96 |
| GO:00071639 | Cervix | CC | establishment or maintenance of cell polarity | 63/2311 | 218/18723 | 4.25e-11 | 8.76e-09 | 63 |
| GO:003295610 | Cervix | CC | regulation of actin cytoskeleton organization | 86/2311 | 358/18723 | 5.90e-10 | 7.51e-08 | 86 |
| GO:004325410 | Cervix | CC | regulation of protein-containing complex assembly | 96/2311 | 428/18723 | 2.91e-09 | 3.05e-07 | 96 |
| GO:00452169 | Cervix | CC | cell-cell junction organization | 53/2311 | 200/18723 | 3.83e-08 | 2.53e-06 | 53 |
| GO:00300108 | Cervix | CC | establishment of cell polarity | 42/2311 | 143/18723 | 4.30e-08 | 2.62e-06 | 42 |
| GO:00975817 | Cervix | CC | lamellipodium organization | 31/2311 | 90/18723 | 4.57e-08 | 2.76e-06 | 31 |
| GO:00300325 | Cervix | CC | lamellipodium assembly | 26/2311 | 72/18723 | 1.87e-07 | 8.48e-06 | 26 |
| GO:006157210 | Cervix | CC | actin filament bundle organization | 44/2311 | 161/18723 | 2.08e-07 | 9.34e-06 | 44 |
| GO:005101710 | Cervix | CC | actin filament bundle assembly | 43/2311 | 157/18723 | 2.66e-07 | 1.12e-05 | 43 |
| GO:00343298 | Cervix | CC | cell junction assembly | 88/2311 | 420/18723 | 3.42e-07 | 1.38e-05 | 88 |
| GO:00070439 | Cervix | CC | cell-cell junction assembly | 39/2311 | 146/18723 | 1.86e-06 | 5.94e-05 | 39 |
| GO:003133410 | Cervix | CC | positive regulation of protein-containing complex assembly | 55/2311 | 237/18723 | 2.25e-06 | 6.73e-05 | 55 |
| GO:00313467 | Cervix | CC | positive regulation of cell projection organization | 72/2311 | 353/18723 | 1.04e-05 | 2.32e-04 | 72 |
| GO:19027437 | Cervix | CC | regulation of lamellipodium organization | 19/2311 | 54/18723 | 1.27e-05 | 2.60e-04 | 19 |
| GO:002241110 | Cervix | CC | cellular component disassembly | 83/2311 | 443/18723 | 6.04e-05 | 8.68e-04 | 83 |
| GO:19027457 | Cervix | CC | positive regulation of lamellipodium organization | 14/2311 | 37/18723 | 6.97e-05 | 9.81e-04 | 14 |
| GO:19021153 | Cervix | CC | regulation of organelle assembly | 40/2311 | 186/18723 | 2.92e-04 | 3.15e-03 | 40 |
| GO:00105916 | Cervix | CC | regulation of lamellipodium assembly | 14/2311 | 42/18723 | 3.32e-04 | 3.49e-03 | 14 |
| Page: 1 2 3 4 5 6 7 8 9 10 11 12 |
| Pathway ID | Tissue | Disease Stage | Description | Gene Ratio | Bg Ratio | pvalue | p.adjust | qvalue | Count |
| Page: 1 |
Top |
Cell-cell communication analysis |
| Identification of potential cell-cell interactions between two cell types and their ligand-receptor pairs for different disease states |
| Ligand | Receptor | LRpair | Pathway | Tissue | Disease Stage |
| Page: 1 |
Top |
Single-cell gene regulatory network inference analysis |
| Find out the significant the regulons (TFs) and the target genes of each regulon across cell types for different disease states |
| TF | Cell Type | Tissue | Disease Stage | Target Gene | RSS | Regulon Activity |
| ∗The dot plots of a searched regulon are shown for all cell subpopulations in each disease state of each tissue based on the regulon specific score inferred using pySCENIC and by calculating the average expression. |
| Page: 1 |
Top |
Somatic mutation of malignant transformation related genes |
| Annotation of somatic variants for genes involved in malignant transformation |
| Hugo Symbol | Variant Class | Variant Classification | dbSNP RS | HGVSc | HGVSp | HGVSp Short | SWISSPROT | BIOTYPE | SIFT | PolyPhen | Tumor Sample Barcode | Tissue | Histology | Sex | Age | Stage | Therapy Types | Drugs | Outcome |
| FSCN1 | SNV | Missense_Mutation | novel | c.1045G>T | p.Ala349Ser | p.A349S | Q16658 | protein_coding | deleterious(0) | possibly_damaging(0.877) | TCGA-A2-A3XZ-01 | Breast | breast invasive carcinoma | Female | <65 | I/II | Chemotherapy | carboplatin | CR |
| FSCN1 | SNV | Missense_Mutation | rs761467264 | c.1193G>A | p.Arg398His | p.R398H | Q16658 | protein_coding | tolerated(0.37) | probably_damaging(0.999) | TCGA-2W-A8YY-01 | Cervix | cervical & endocervical cancer | Female | <65 | I/II | Chemotherapy | cisplatin | CR |
| FSCN1 | SNV | Missense_Mutation | novel | c.178N>C | p.Val60Leu | p.V60L | Q16658 | protein_coding | tolerated(0.11) | benign(0.014) | TCGA-C5-A8XK-01 | Cervix | cervical & endocervical cancer | Female | <65 | I/II | Chemotherapy | cisplatin | SD |
| FSCN1 | SNV | Missense_Mutation | novel | c.403N>T | p.His135Tyr | p.H135Y | Q16658 | protein_coding | deleterious(0) | probably_damaging(0.994) | TCGA-MA-AA42-01 | Cervix | cervical & endocervical cancer | Female | >=65 | I/II | Unknown | Unknown | SD |
| FSCN1 | SNV | Missense_Mutation | novel | c.1423N>A | p.Ala475Thr | p.A475T | Q16658 | protein_coding | tolerated(0.06) | probably_damaging(0.997) | TCGA-VS-A8QH-01 | Cervix | cervical & endocervical cancer | Female | >=65 | I/II | Chemotherapy | gemcitabine | PD |
| FSCN1 | SNV | Missense_Mutation | novel | c.864N>C | p.Glu288Asp | p.E288D | Q16658 | protein_coding | tolerated(0.13) | probably_damaging(0.989) | TCGA-VS-A958-01 | Cervix | cervical & endocervical cancer | Female | <65 | I/II | Chemotherapy | cisplatin | CR |
| FSCN1 | SNV | Missense_Mutation | rs756163037 | c.1333G>A | p.Gly445Ser | p.G445S | Q16658 | protein_coding | tolerated(0.95) | benign(0.001) | TCGA-A6-6653-01 | Colorectum | colon adenocarcinoma | Male | >=65 | I/II | Unknown | Unknown | SD |
| FSCN1 | SNV | Missense_Mutation | c.1147N>T | p.Arg383Cys | p.R383C | Q16658 | protein_coding | deleterious(0) | probably_damaging(0.999) | TCGA-AZ-6598-01 | Colorectum | colon adenocarcinoma | Female | >=65 | I/II | Unknown | Unknown | SD | |
| FSCN1 | SNV | Missense_Mutation | c.326G>A | p.Arg109Gln | p.R109Q | Q16658 | protein_coding | tolerated(0.29) | benign(0.099) | TCGA-AZ-6601-01 | Colorectum | colon adenocarcinoma | Male | >=65 | I/II | Unknown | Unknown | PD | |
| FSCN1 | SNV | Missense_Mutation | rs755808795 | c.1148N>A | p.Arg383His | p.R383H | Q16658 | protein_coding | deleterious(0) | probably_damaging(0.997) | TCGA-CK-4951-01 | Colorectum | colon adenocarcinoma | Female | >=65 | I/II | Unknown | Unknown | PD |
| Page: 1 2 3 4 5 |
Top |
Related drugs of malignant transformation related genes |
| Identification of chemicals and drugs interact with genes involved in malignant transfromation |
| (DGIdb 4.0) |
| Entrez ID | Symbol | Category | Interaction Types | Drug Claim Name | Drug Name | PMIDs |
| 6624 | FSCN1 | NA | NP-G2-044 | NP-G2-044 |
| Page: 1 |

Copyright 2023-Present -The University of Texas Health Science Center at Houston |