
|
|||||
|
 | |
| |
| |
| |
| |
| |
|
Gene: FRZB |
Gene summary for FRZB |
| Gene information | Species | Human | Gene symbol | FRZB | Gene ID | 2487 |
| Gene name | frizzled related protein | |
| Gene Alias | FRE | |
| Cytomap | 2q32.1 | |
| Gene Type | protein-coding | GO ID | GO:0001501 | UniProtAcc | D9ZGF6 |
Top |
Malignant transformation analysis |
| Identification of the aberrant gene expression in precancerous and cancerous lesions by comparing the gene expression of stem-like cells in diseased tissues with normal stem cells |
| Entrez ID | Symbol | Replicates | Species | Organ | Tissue | Adj P-value | Log2FC | Malignancy |
| 2487 | FRZB | P2T-E | Human | Esophagus | ESCC | 7.96e-19 | 4.67e-01 | 0.1177 |
| 2487 | FRZB | P16T-E | Human | Esophagus | ESCC | 2.31e-37 | 9.13e-01 | 0.1153 |
| 2487 | FRZB | P56T-E | Human | Esophagus | ESCC | 4.69e-04 | 1.45e+00 | 0.1613 |
| 2487 | FRZB | P76T-E | Human | Esophagus | ESCC | 2.66e-17 | 9.22e-01 | 0.1207 |
| 2487 | FRZB | P130T-E | Human | Esophagus | ESCC | 1.54e-08 | 9.57e-01 | 0.1676 |
| 2487 | FRZB | C43 | Human | Oral cavity | OSCC | 4.24e-06 | -2.19e-01 | 0.1704 |
| 2487 | FRZB | C57 | Human | Oral cavity | OSCC | 4.07e-11 | -1.49e-01 | 0.1679 |
| 2487 | FRZB | C08 | Human | Oral cavity | OSCC | 4.60e-04 | -2.10e-01 | 0.1919 |
| 2487 | FRZB | C09 | Human | Oral cavity | OSCC | 2.67e-02 | -2.19e-01 | 0.1431 |
| 2487 | FRZB | NEOLP-2 | Human | Oral cavity | NEOLP | 7.85e-03 | 3.46e-01 | -0.0196 |
| 2487 | FRZB | NEOLP-3 | Human | Oral cavity | NEOLP | 1.17e-04 | 3.46e-01 | -0.0191 |
| 2487 | FRZB | SYSMH1 | Human | Oral cavity | OSCC | 2.01e-07 | -2.16e-01 | 0.1127 |
| 2487 | FRZB | SYSMH2 | Human | Oral cavity | OSCC | 1.98e-06 | -2.07e-01 | 0.2326 |
| 2487 | FRZB | SYSMH4 | Human | Oral cavity | OSCC | 1.98e-06 | -2.18e-01 | 0.1226 |
| 2487 | FRZB | SYSMH5 | Human | Oral cavity | OSCC | 4.24e-06 | -2.19e-01 | 0.0647 |
| 2487 | FRZB | SYSMH6 | Human | Oral cavity | OSCC | 4.54e-05 | -2.13e-01 | 0.1275 |
| Page: 1 |
| Tissue | Expression Dynamics | Abbreviation |
| Esophagus | 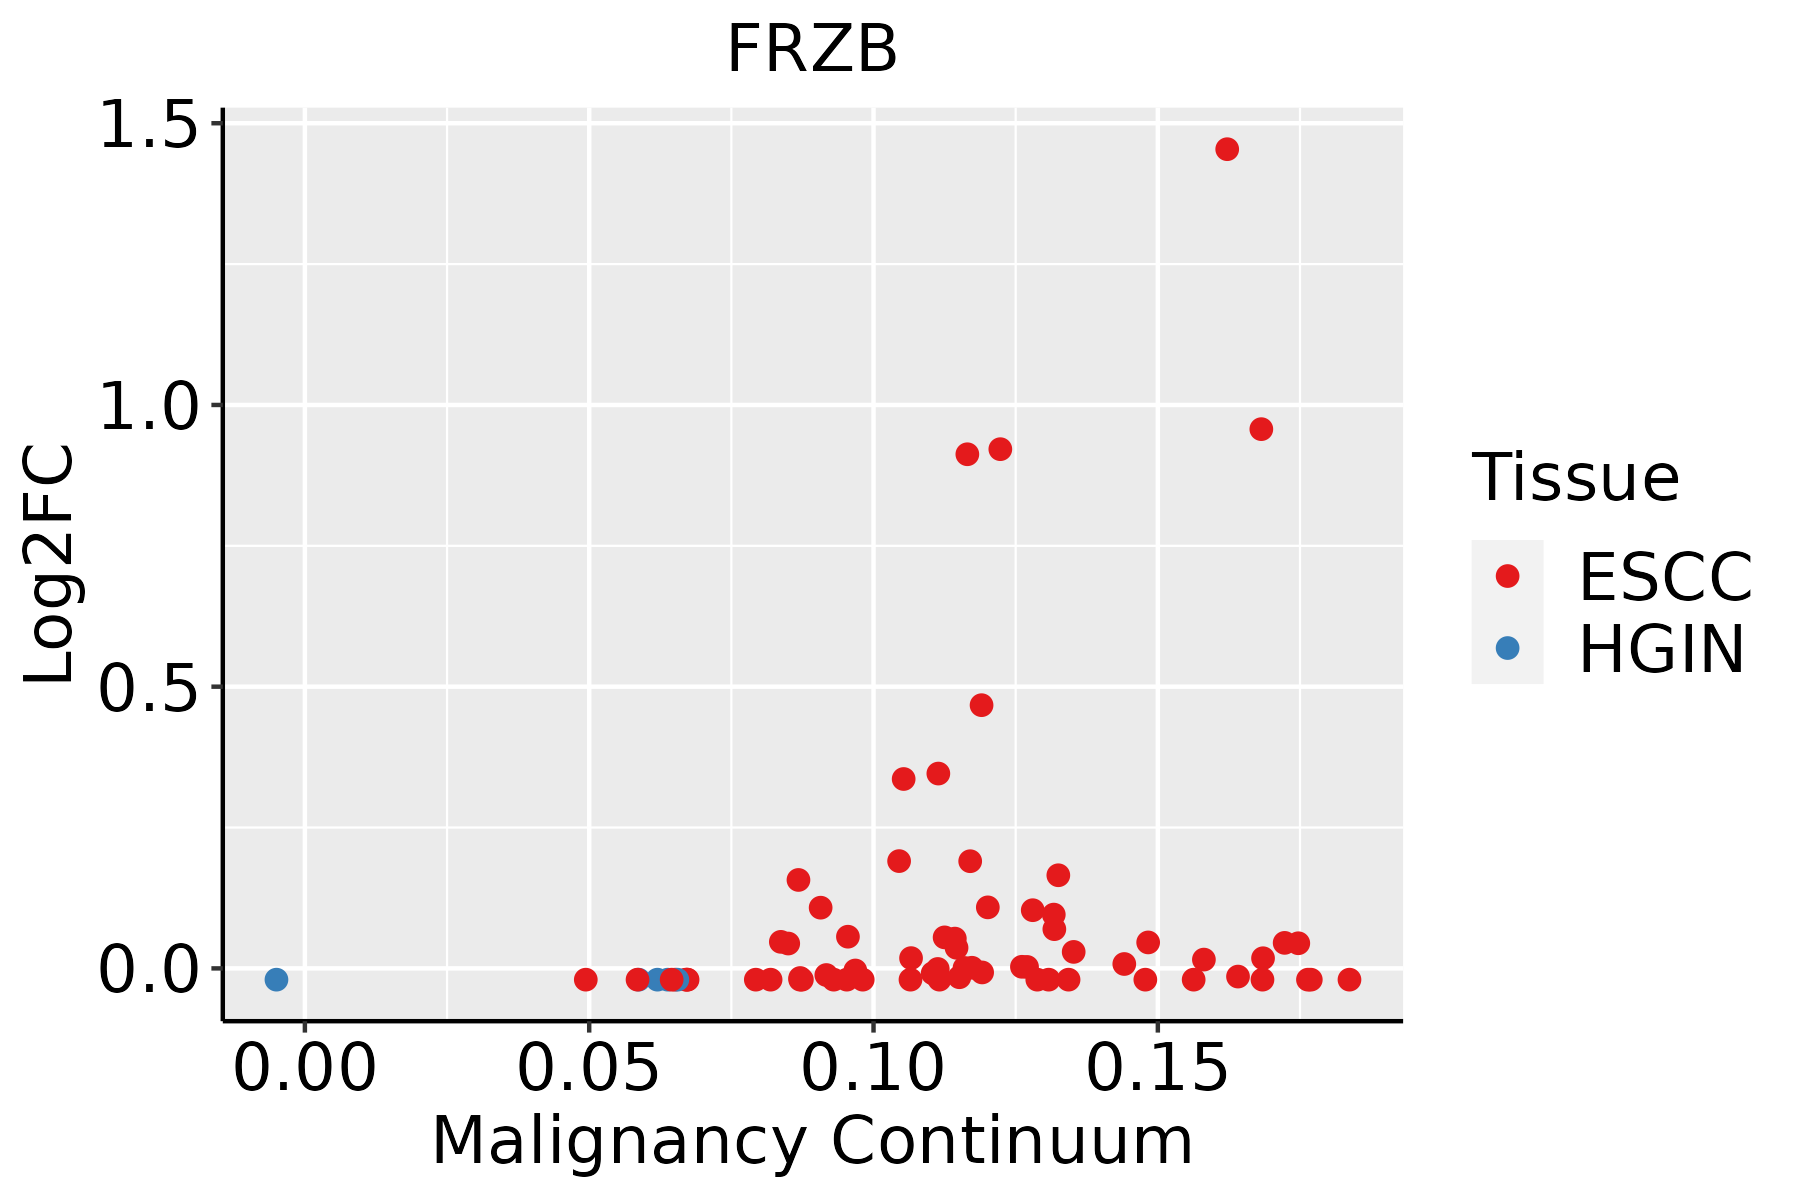 | ESCC: Esophageal squamous cell carcinoma |
| HGIN: High-grade intraepithelial neoplasias | ||
| LGIN: Low-grade intraepithelial neoplasias | ||
| Oral Cavity |  | EOLP: Erosive Oral lichen planus |
| LP: leukoplakia | ||
| NEOLP: Non-erosive oral lichen planus | ||
| OSCC: Oral squamous cell carcinoma |
| ∗log2FC in expression of this searched gene in stem-like cells from each diseased tissue sample relative to stem-like cells in normal samples in each tissue plotted against the malignancy continuum. Samples are colored based on if they are from different disease stage. |
Top |
Malignant transformation related pathway analysis |
| Find out the enriched GO biological processes and KEGG pathways involved in transition from healthy to precancer to cancer |
| Tissue | Disease Stage | Enriched GO biological Processes |
| Colorectum | AD |  |
| Colorectum | SER |  |
| Colorectum | MSS |  |
| Colorectum | MSI-H |  |
| Colorectum | FAP |  |
| ∗Top 15 enriched GO BP terms are showed in the bar plot of each disease state in each tissue. Each row represents a significant GO biological process which is colored according to the -log10(p.adjust). |
| Page: 1 2 3 4 5 6 7 8 9 |
| GO ID | Tissue | Disease Stage | Description | Gene Ratio | Bg Ratio | pvalue | p.adjust | Count |
| GO:0048732111 | Esophagus | ESCC | gland development | 269/8552 | 436/18723 | 7.81e-12 | 2.95e-10 | 269 |
| GO:0016049110 | Esophagus | ESCC | cell growth | 289/8552 | 482/18723 | 1.29e-10 | 3.77e-09 | 289 |
| GO:001605517 | Esophagus | ESCC | Wnt signaling pathway | 268/8552 | 444/18723 | 2.32e-10 | 6.58e-09 | 268 |
| GO:019873817 | Esophagus | ESCC | cell-cell signaling by wnt | 269/8552 | 446/18723 | 2.41e-10 | 6.79e-09 | 269 |
| GO:000155819 | Esophagus | ESCC | regulation of cell growth | 248/8552 | 414/18723 | 2.97e-09 | 6.45e-08 | 248 |
| GO:003011117 | Esophagus | ESCC | regulation of Wnt signaling pathway | 194/8552 | 328/18723 | 5.39e-07 | 7.14e-06 | 194 |
| GO:0061008110 | Esophagus | ESCC | hepaticobiliary system development | 98/8552 | 150/18723 | 8.91e-07 | 1.15e-05 | 98 |
| GO:006007016 | Esophagus | ESCC | canonical Wnt signaling pathway | 180/8552 | 303/18723 | 9.15e-07 | 1.17e-05 | 180 |
| GO:0001889110 | Esophagus | ESCC | liver development | 96/8552 | 147/18723 | 1.18e-06 | 1.47e-05 | 96 |
| GO:006082817 | Esophagus | ESCC | regulation of canonical Wnt signaling pathway | 153/8552 | 253/18723 | 1.38e-06 | 1.67e-05 | 153 |
| GO:00459267 | Esophagus | ESCC | negative regulation of growth | 148/8552 | 249/18723 | 7.88e-06 | 7.73e-05 | 148 |
| GO:00454449 | Esophagus | ESCC | fat cell differentiation | 135/8552 | 229/18723 | 3.38e-05 | 2.78e-04 | 135 |
| GO:00488638 | Esophagus | ESCC | stem cell differentiation | 122/8552 | 206/18723 | 5.95e-05 | 4.59e-04 | 122 |
| GO:00456007 | Esophagus | ESCC | positive regulation of fat cell differentiation | 46/8552 | 66/18723 | 6.72e-05 | 5.11e-04 | 46 |
| GO:00487628 | Esophagus | ESCC | mesenchymal cell differentiation | 133/8552 | 236/18723 | 5.94e-04 | 3.22e-03 | 133 |
| GO:00485687 | Esophagus | ESCC | embryonic organ development | 228/8552 | 427/18723 | 7.28e-04 | 3.79e-03 | 228 |
| GO:00303085 | Esophagus | ESCC | negative regulation of cell growth | 108/8552 | 188/18723 | 7.46e-04 | 3.87e-03 | 108 |
| GO:00301788 | Esophagus | ESCC | negative regulation of Wnt signaling pathway | 97/8552 | 170/18723 | 1.81e-03 | 8.31e-03 | 97 |
| GO:00355671 | Esophagus | ESCC | non-canonical Wnt signaling pathway | 45/8552 | 72/18723 | 2.97e-03 | 1.24e-02 | 45 |
| GO:00604856 | Esophagus | ESCC | mesenchyme development | 156/8552 | 291/18723 | 3.76e-03 | 1.53e-02 | 156 |
| Page: 1 2 3 4 |
| Pathway ID | Tissue | Disease Stage | Description | Gene Ratio | Bg Ratio | pvalue | p.adjust | qvalue | Count |
| hsa0431024 | Oral cavity | NEOLP | Wnt signaling pathway | 34/1112 | 171/8465 | 8.05e-03 | 2.88e-02 | 1.81e-02 | 34 |
| hsa0431034 | Oral cavity | NEOLP | Wnt signaling pathway | 34/1112 | 171/8465 | 8.05e-03 | 2.88e-02 | 1.81e-02 | 34 |
| Page: 1 |
Top |
Cell-cell communication analysis |
| Identification of potential cell-cell interactions between two cell types and their ligand-receptor pairs for different disease states |
| Ligand | Receptor | LRpair | Pathway | Tissue | Disease Stage |
| Page: 1 |
Top |
Single-cell gene regulatory network inference analysis |
| Find out the significant the regulons (TFs) and the target genes of each regulon across cell types for different disease states |
| TF | Cell Type | Tissue | Disease Stage | Target Gene | RSS | Regulon Activity |
| ∗The dot plots of a searched regulon are shown for all cell subpopulations in each disease state of each tissue based on the regulon specific score inferred using pySCENIC and by calculating the average expression. |
| Page: 1 |
Top |
Somatic mutation of malignant transformation related genes |
| Annotation of somatic variants for genes involved in malignant transformation |
| Hugo Symbol | Variant Class | Variant Classification | dbSNP RS | HGVSc | HGVSp | HGVSp Short | SWISSPROT | BIOTYPE | SIFT | PolyPhen | Tumor Sample Barcode | Tissue | Histology | Sex | Age | Stage | Therapy Types | Drugs | Outcome |
| FRZB | SNV | Missense_Mutation | novel | c.473N>C | p.Gly158Ala | p.G158A | Q92765 | protein_coding | tolerated(0.32) | benign(0.01) | TCGA-C8-A8HQ-01 | Breast | breast invasive carcinoma | Female | <65 | I/II | Unknown | Unknown | SD |
| FRZB | SNV | Missense_Mutation | novel | c.343G>T | p.Ala115Ser | p.A115S | Q92765 | protein_coding | deleterious(0) | probably_damaging(0.99) | TCGA-E9-A295-01 | Breast | breast invasive carcinoma | Female | >=65 | I/II | Hormone Therapy | tamoxiphen | SD |
| FRZB | SNV | Missense_Mutation | rs759242908 | c.631N>T | p.His211Tyr | p.H211Y | Q92765 | protein_coding | deleterious(0.03) | possibly_damaging(0.868) | TCGA-EW-A1IZ-01 | Breast | breast invasive carcinoma | Female | <65 | III/IV | Chemotherapy | taxotere | SD |
| FRZB | insertion | In_Frame_Ins | novel | c.136_137insCTTGGG | p.Leu46delinsProTrpVal | p.L46delinsPWV | Q92765 | protein_coding | TCGA-A2-A04Y-01 | Breast | breast invasive carcinoma | Female | <65 | I/II | Chemotherapy | cytoxan | SD | ||
| FRZB | SNV | Missense_Mutation | novel | c.176A>G | p.His59Arg | p.H59R | Q92765 | protein_coding | deleterious(0) | probably_damaging(0.988) | TCGA-2W-A8YY-01 | Cervix | cervical & endocervical cancer | Female | <65 | I/II | Chemotherapy | cisplatin | CR |
| FRZB | SNV | Missense_Mutation | rs151046356 | c.433N>A | p.Gly145Ser | p.G145S | Q92765 | protein_coding | deleterious(0.01) | probably_damaging(0.997) | TCGA-EA-A3HS-01 | Cervix | cervical & endocervical cancer | Female | <65 | I/II | Unknown | Unknown | SD |
| FRZB | SNV | Missense_Mutation | c.862N>T | p.Arg288Cys | p.R288C | Q92765 | protein_coding | deleterious(0.01) | probably_damaging(0.991) | TCGA-FU-A3HZ-01 | Cervix | cervical & endocervical cancer | Female | <65 | I/II | Chemotherapy | cisplatin | CR | |
| FRZB | SNV | Missense_Mutation | novel | c.77N>A | p.Arg26Gln | p.R26Q | Q92765 | protein_coding | tolerated(0.7) | benign(0) | TCGA-JW-AAVH-01 | Cervix | cervical & endocervical cancer | Female | <65 | I/II | Unknown | Unknown | SD |
| FRZB | SNV | Missense_Mutation | c.814G>T | p.Gly272Cys | p.G272C | Q92765 | protein_coding | deleterious(0) | probably_damaging(0.989) | TCGA-LP-A4AW-01 | Cervix | cervical & endocervical cancer | Female | <65 | I/II | Unknown | Unknown | SD | |
| FRZB | SNV | Missense_Mutation | c.458N>A | p.Ile153Asn | p.I153N | Q92765 | protein_coding | deleterious(0) | probably_damaging(0.979) | TCGA-AA-3713-01 | Colorectum | colon adenocarcinoma | Male | >=65 | III/IV | Chemotherapy | 5-fluorouracil | PR |
| Page: 1 2 3 4 5 |
Top |
Related drugs of malignant transformation related genes |
| Identification of chemicals and drugs interact with genes involved in malignant transfromation |
| (DGIdb 4.0) |
| Entrez ID | Symbol | Category | Interaction Types | Drug Claim Name | Drug Name | PMIDs |
| Page: 1 |

Copyright 2023-Present -The University of Texas Health Science Center at Houston |