
|
|||||
|
 | |
| |
| |
| |
| |
| |
|
Gene: FRYL |
Gene summary for FRYL |
| Gene information | Species | Human | Gene symbol | FRYL | Gene ID | 285527 |
| Gene name | FRY like transcription coactivator | |
| Gene Alias | AF4p12 | |
| Cytomap | 4p11 | |
| Gene Type | protein-coding | GO ID | GO:0000902 | UniProtAcc | B3KXG5 |
Top |
Malignant transformation analysis |
| Identification of the aberrant gene expression in precancerous and cancerous lesions by comparing the gene expression of stem-like cells in diseased tissues with normal stem cells |
| Entrez ID | Symbol | Replicates | Species | Organ | Tissue | Adj P-value | Log2FC | Malignancy |
| 285527 | FRYL | CA_HPV_1 | Human | Cervix | CC | 7.94e-04 | 5.49e-02 | 0.0264 |
| 285527 | FRYL | CCI_1 | Human | Cervix | CC | 9.36e-12 | 1.64e+00 | 0.528 |
| 285527 | FRYL | CCI_2 | Human | Cervix | CC | 3.82e-13 | 1.04e+00 | 0.5249 |
| 285527 | FRYL | CCI_3 | Human | Cervix | CC | 3.32e-04 | 8.46e-01 | 0.516 |
| 285527 | FRYL | HTA11_3410_2000001011 | Human | Colorectum | AD | 3.24e-15 | -5.01e-01 | 0.0155 |
| 285527 | FRYL | HTA11_1938_2000001011 | Human | Colorectum | AD | 2.46e-05 | 4.16e-01 | -0.0811 |
| 285527 | FRYL | HTA11_78_2000001011 | Human | Colorectum | AD | 1.02e-05 | 5.73e-01 | -0.1088 |
| 285527 | FRYL | HTA11_347_2000001011 | Human | Colorectum | AD | 2.77e-27 | 1.09e+00 | -0.1954 |
| 285527 | FRYL | HTA11_696_2000001011 | Human | Colorectum | AD | 7.75e-05 | 3.55e-01 | -0.1464 |
| 285527 | FRYL | HTA11_866_2000001011 | Human | Colorectum | AD | 1.77e-06 | 4.64e-01 | -0.1001 |
| 285527 | FRYL | HTA11_5212_2000001011 | Human | Colorectum | AD | 3.45e-02 | -4.35e-01 | -0.2061 |
| 285527 | FRYL | HTA11_546_2000001011 | Human | Colorectum | AD | 2.51e-04 | 4.47e-01 | -0.0842 |
| 285527 | FRYL | HTA11_866_3004761011 | Human | Colorectum | AD | 4.49e-16 | -6.45e-01 | 0.096 |
| 285527 | FRYL | HTA11_9408_2000001011 | Human | Colorectum | AD | 1.44e-09 | -7.62e-01 | 0.0451 |
| 285527 | FRYL | HTA11_8622_2000001021 | Human | Colorectum | SER | 2.12e-16 | -8.55e-01 | 0.0528 |
| 285527 | FRYL | HTA11_7696_3000711011 | Human | Colorectum | AD | 8.02e-03 | -2.02e-01 | 0.0674 |
| 285527 | FRYL | HTA11_11156_2000001011 | Human | Colorectum | AD | 1.78e-13 | -1.01e+00 | 0.0397 |
| 285527 | FRYL | HTA11_99999970781_79442 | Human | Colorectum | MSS | 7.93e-16 | -5.14e-01 | 0.294 |
| 285527 | FRYL | HTA11_99999965062_69753 | Human | Colorectum | MSI-H | 5.42e-27 | 7.86e-01 | 0.3487 |
| 285527 | FRYL | HTA11_99999971662_82457 | Human | Colorectum | MSS | 1.03e-11 | -4.14e-01 | 0.3859 |
| Page: 1 2 3 4 5 6 7 8 9 10 11 |
| Tissue | Expression Dynamics | Abbreviation |
| Cervix | 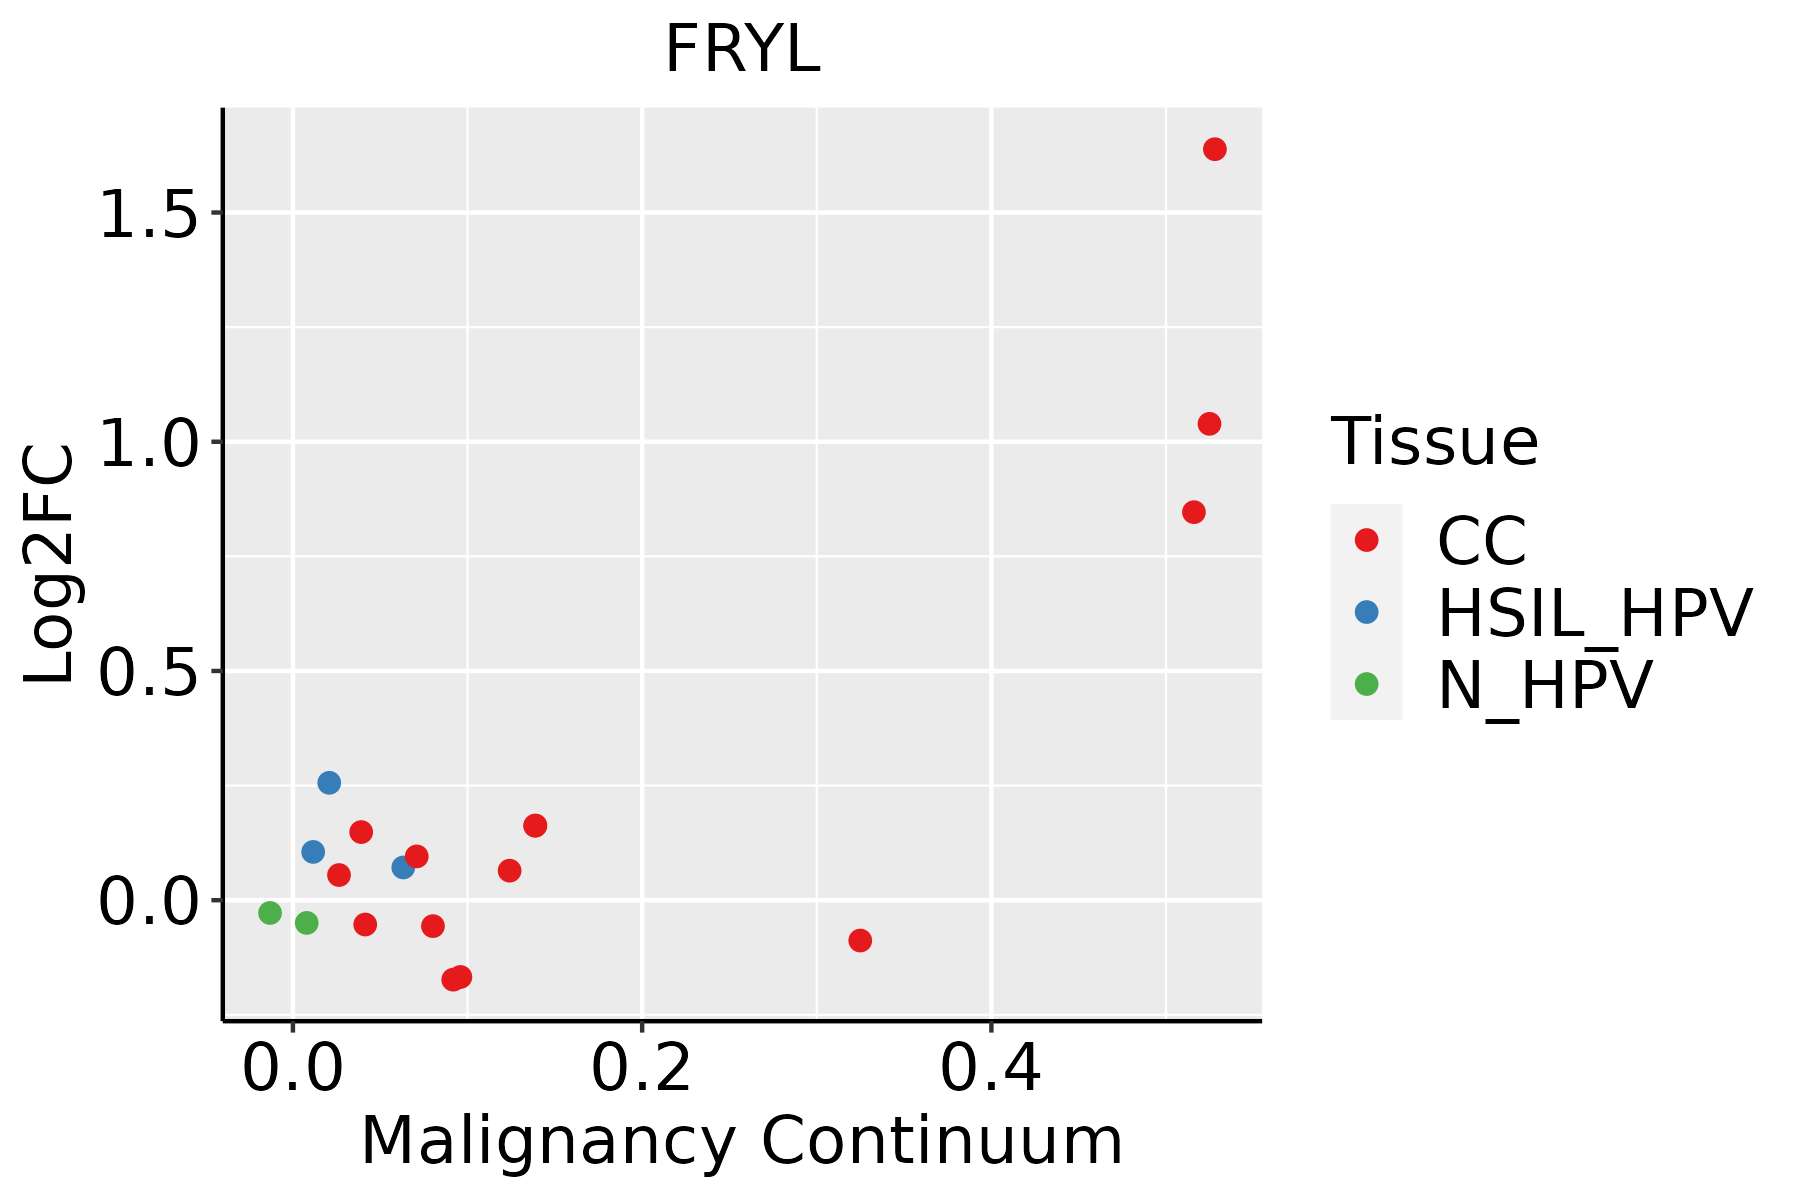 | CC: Cervix cancer |
| HSIL_HPV: HPV-infected high-grade squamous intraepithelial lesions | ||
| N_HPV: HPV-infected normal cervix | ||
| Colorectum (GSE201348) |  | FAP: Familial adenomatous polyposis |
| CRC: Colorectal cancer | ||
| Colorectum (HTA11) |  | AD: Adenomas |
| SER: Sessile serrated lesions | ||
| MSI-H: Microsatellite-high colorectal cancer | ||
| MSS: Microsatellite stable colorectal cancer | ||
| Endometrium | 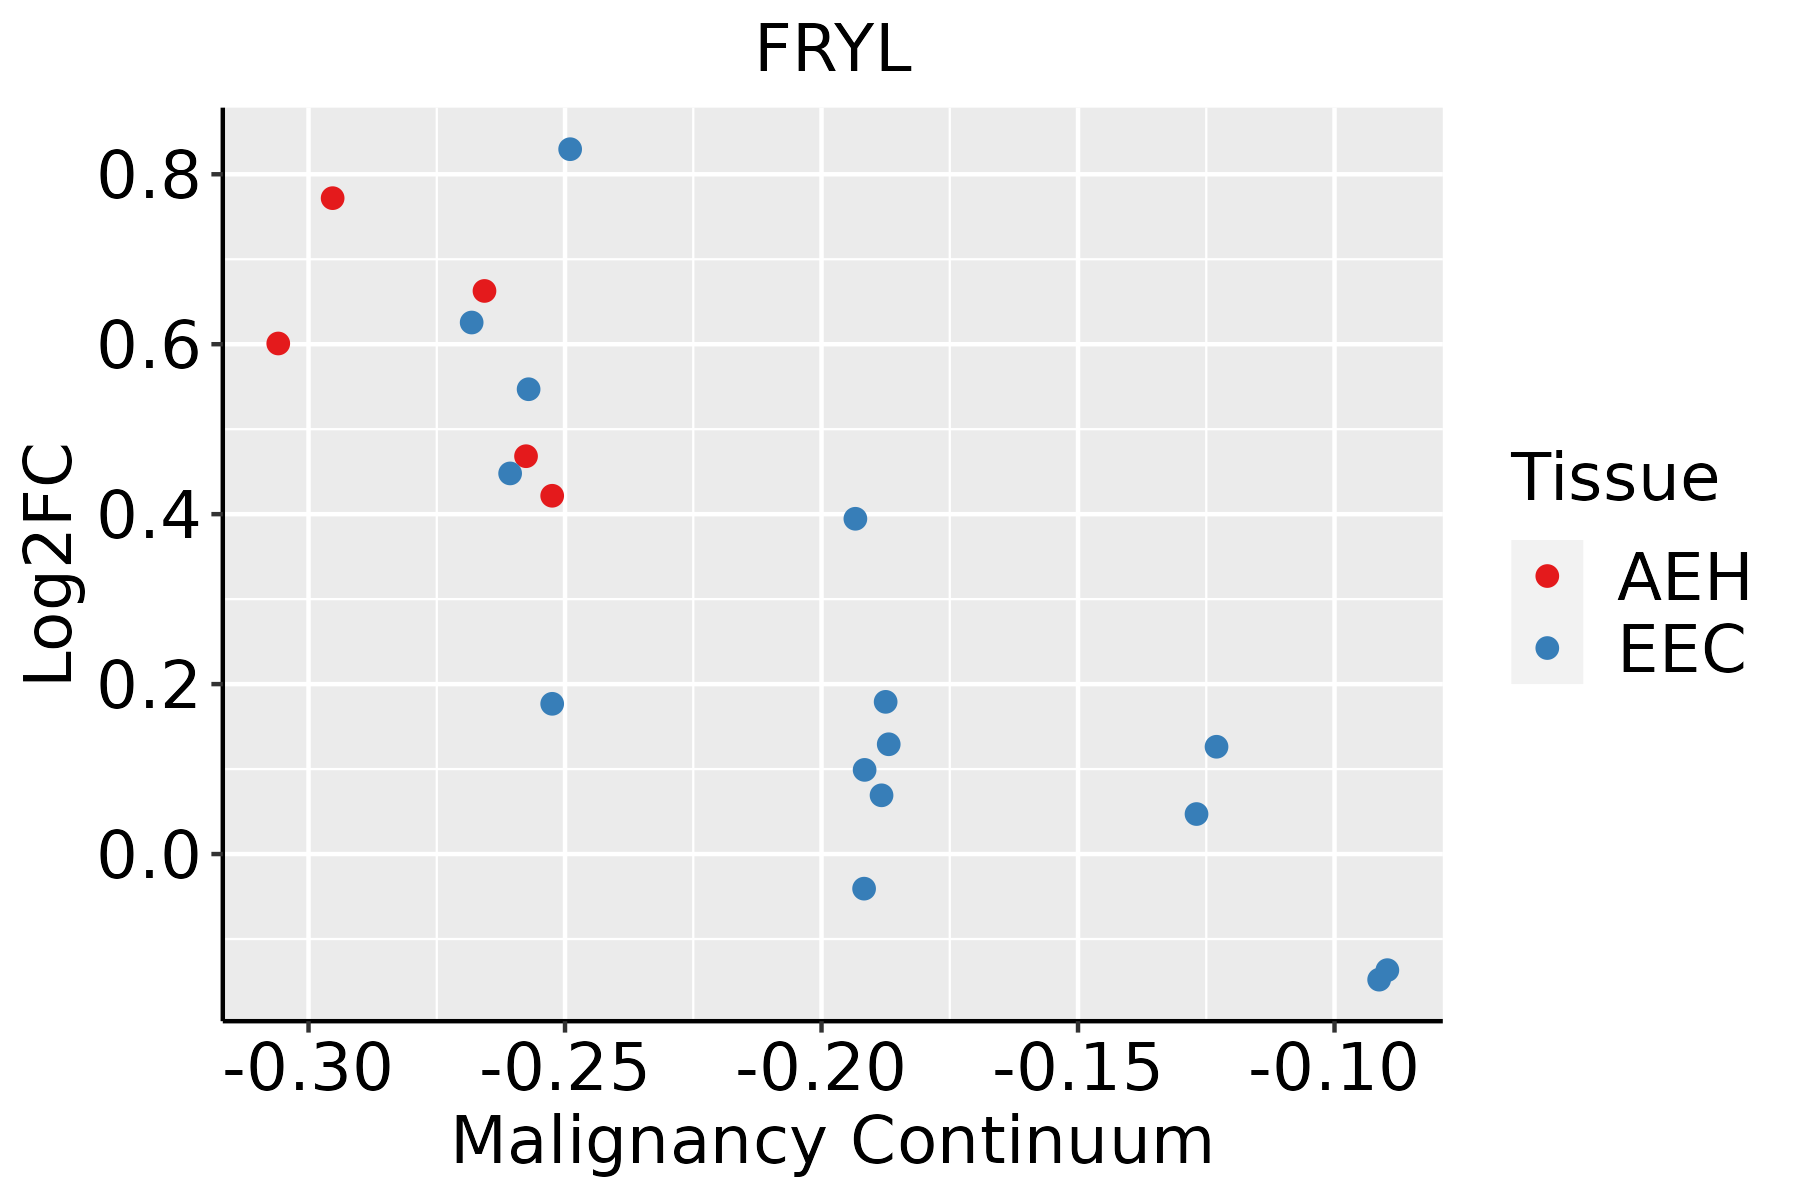 | AEH: Atypical endometrial hyperplasia |
| EEC: Endometrioid Cancer | ||
| Esophagus | 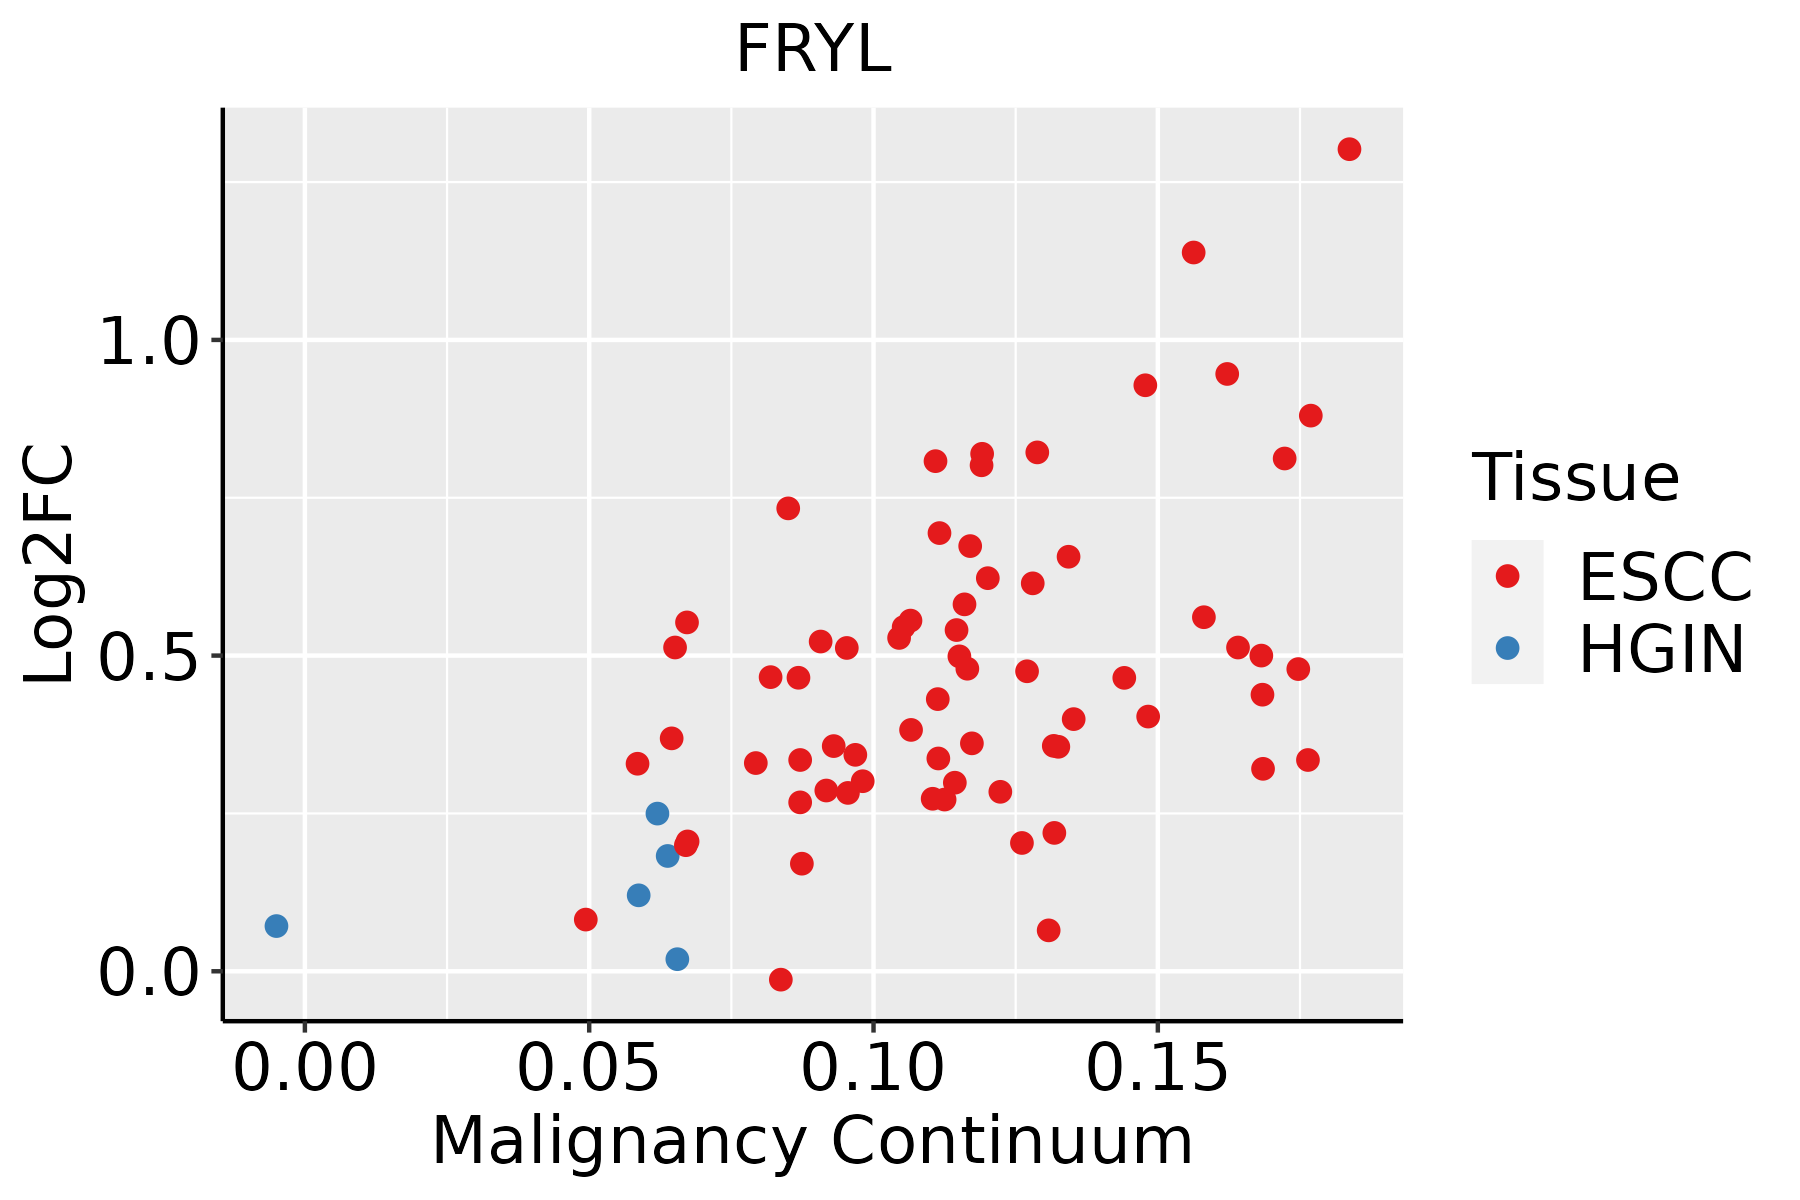 | ESCC: Esophageal squamous cell carcinoma |
| HGIN: High-grade intraepithelial neoplasias | ||
| LGIN: Low-grade intraepithelial neoplasias | ||
| Liver | 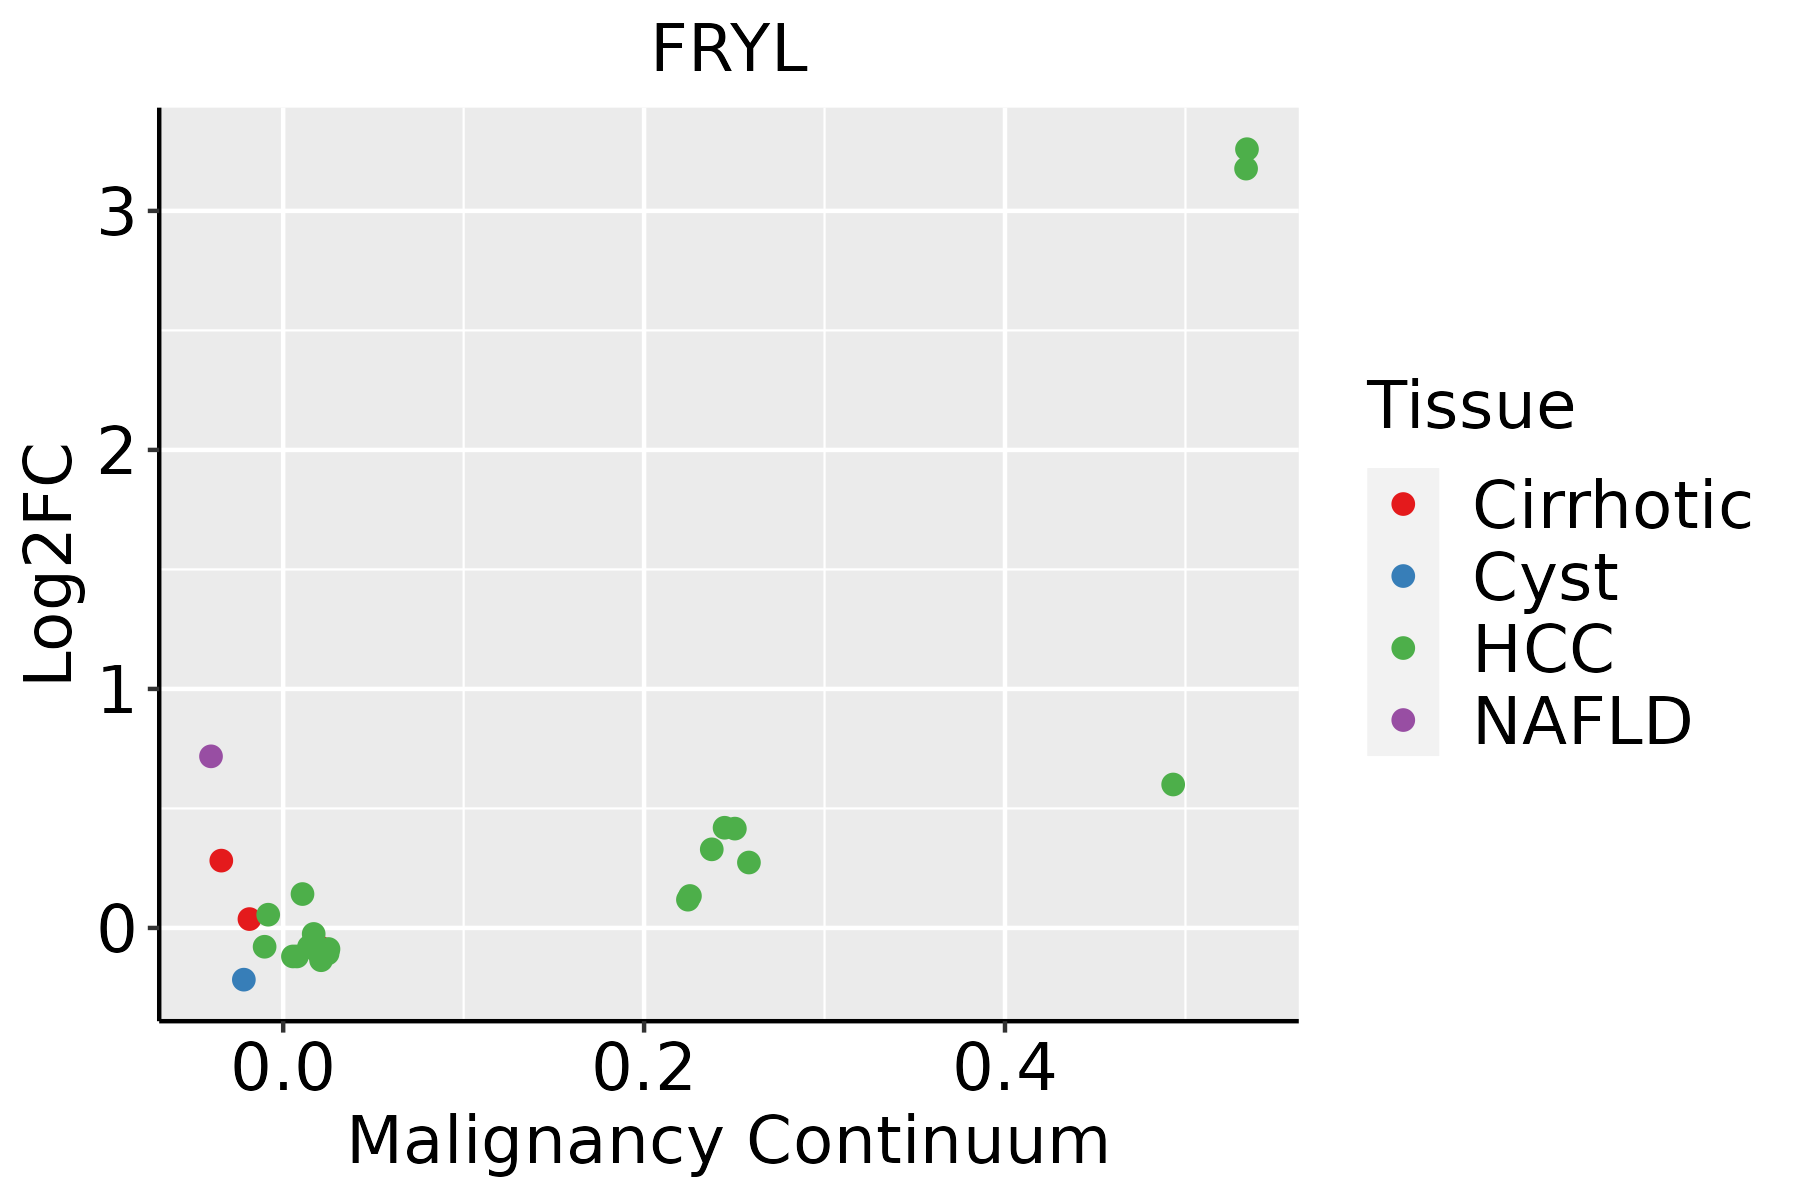 | HCC: Hepatocellular carcinoma |
| NAFLD: Non-alcoholic fatty liver disease | ||
| Lung | 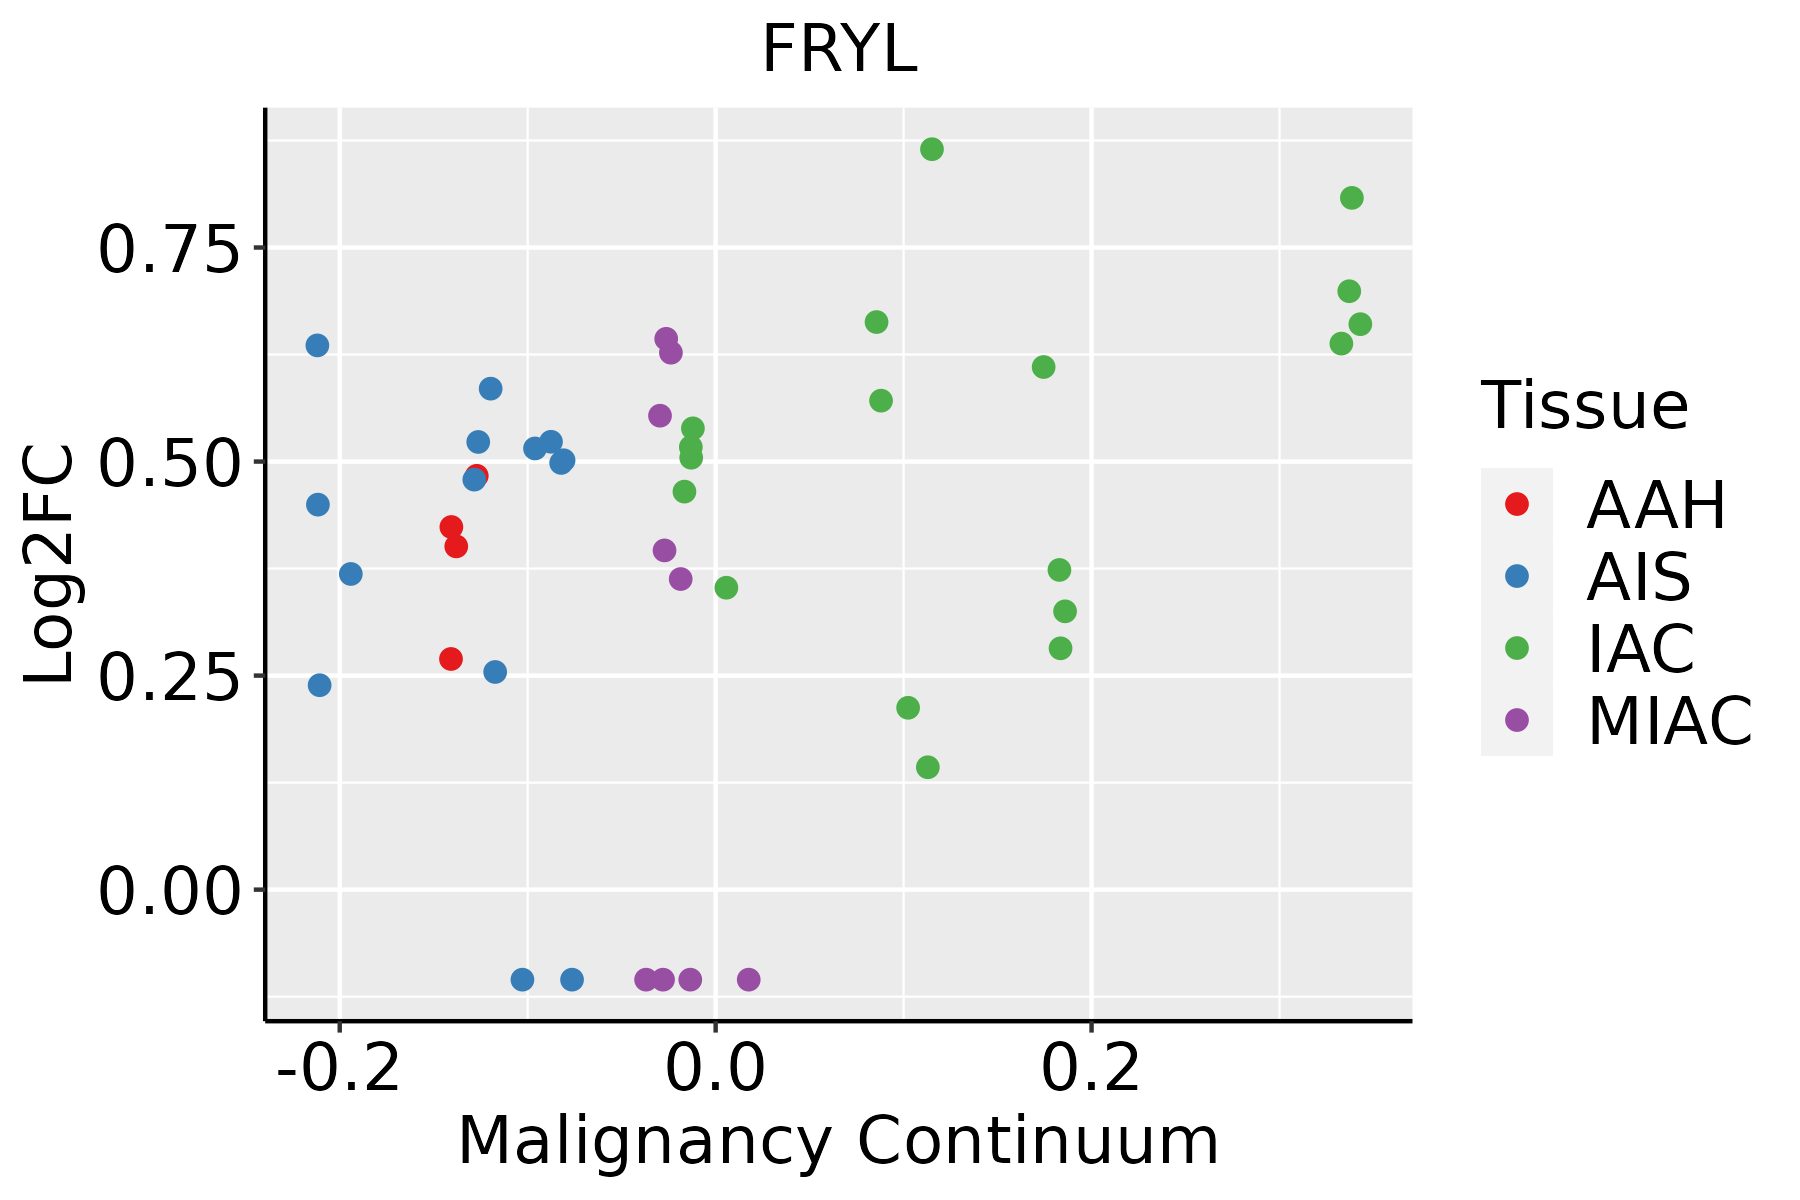 | AAH: Atypical adenomatous hyperplasia |
| AIS: Adenocarcinoma in situ | ||
| IAC: Invasive lung adenocarcinoma | ||
| MIA: Minimally invasive adenocarcinoma | ||
| Oral Cavity |  | EOLP: Erosive Oral lichen planus |
| LP: leukoplakia | ||
| NEOLP: Non-erosive oral lichen planus | ||
| OSCC: Oral squamous cell carcinoma | ||
| Prostate | 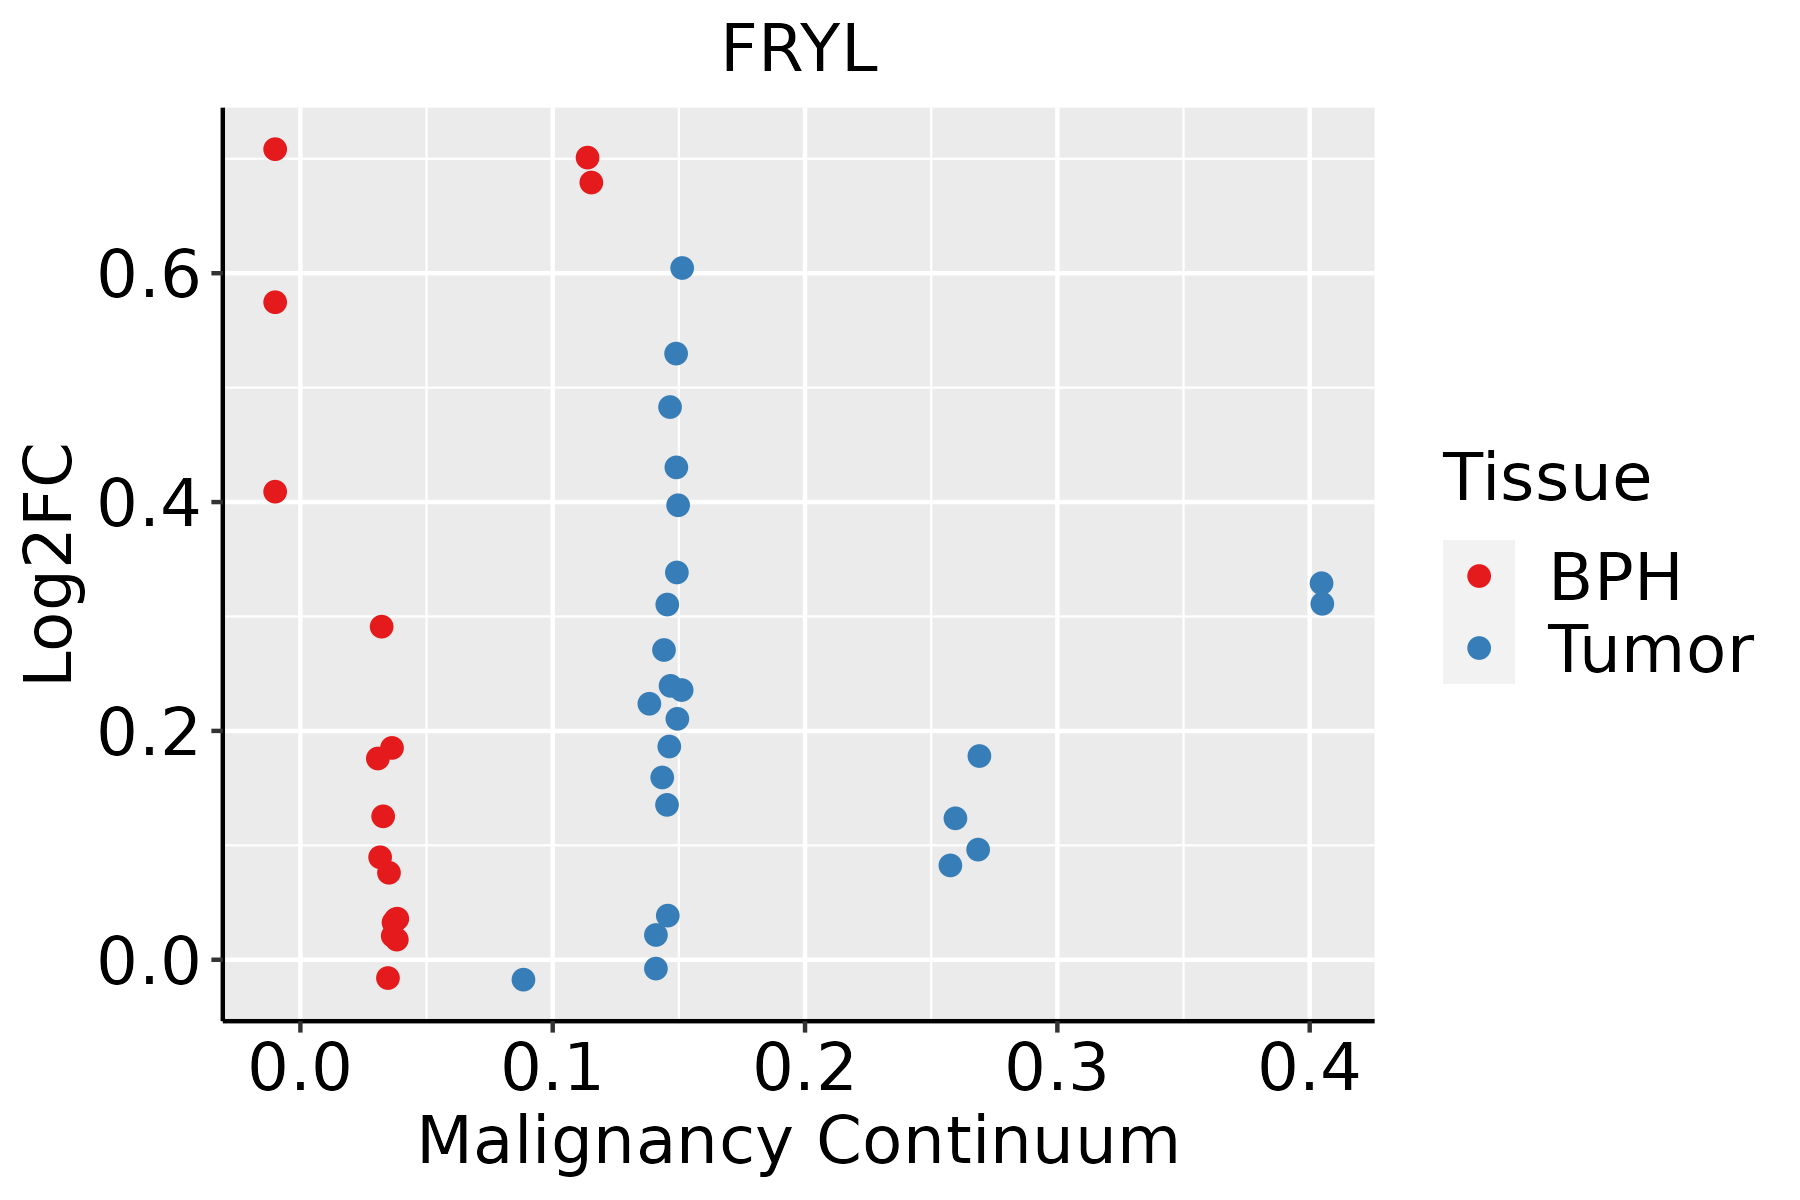 | BPH: Benign Prostatic Hyperplasia |
| Skin |  | AK: Actinic keratosis |
| cSCC: Cutaneous squamous cell carcinoma | ||
| SCCIS:squamous cell carcinoma in situ | ||
| Thyroid | 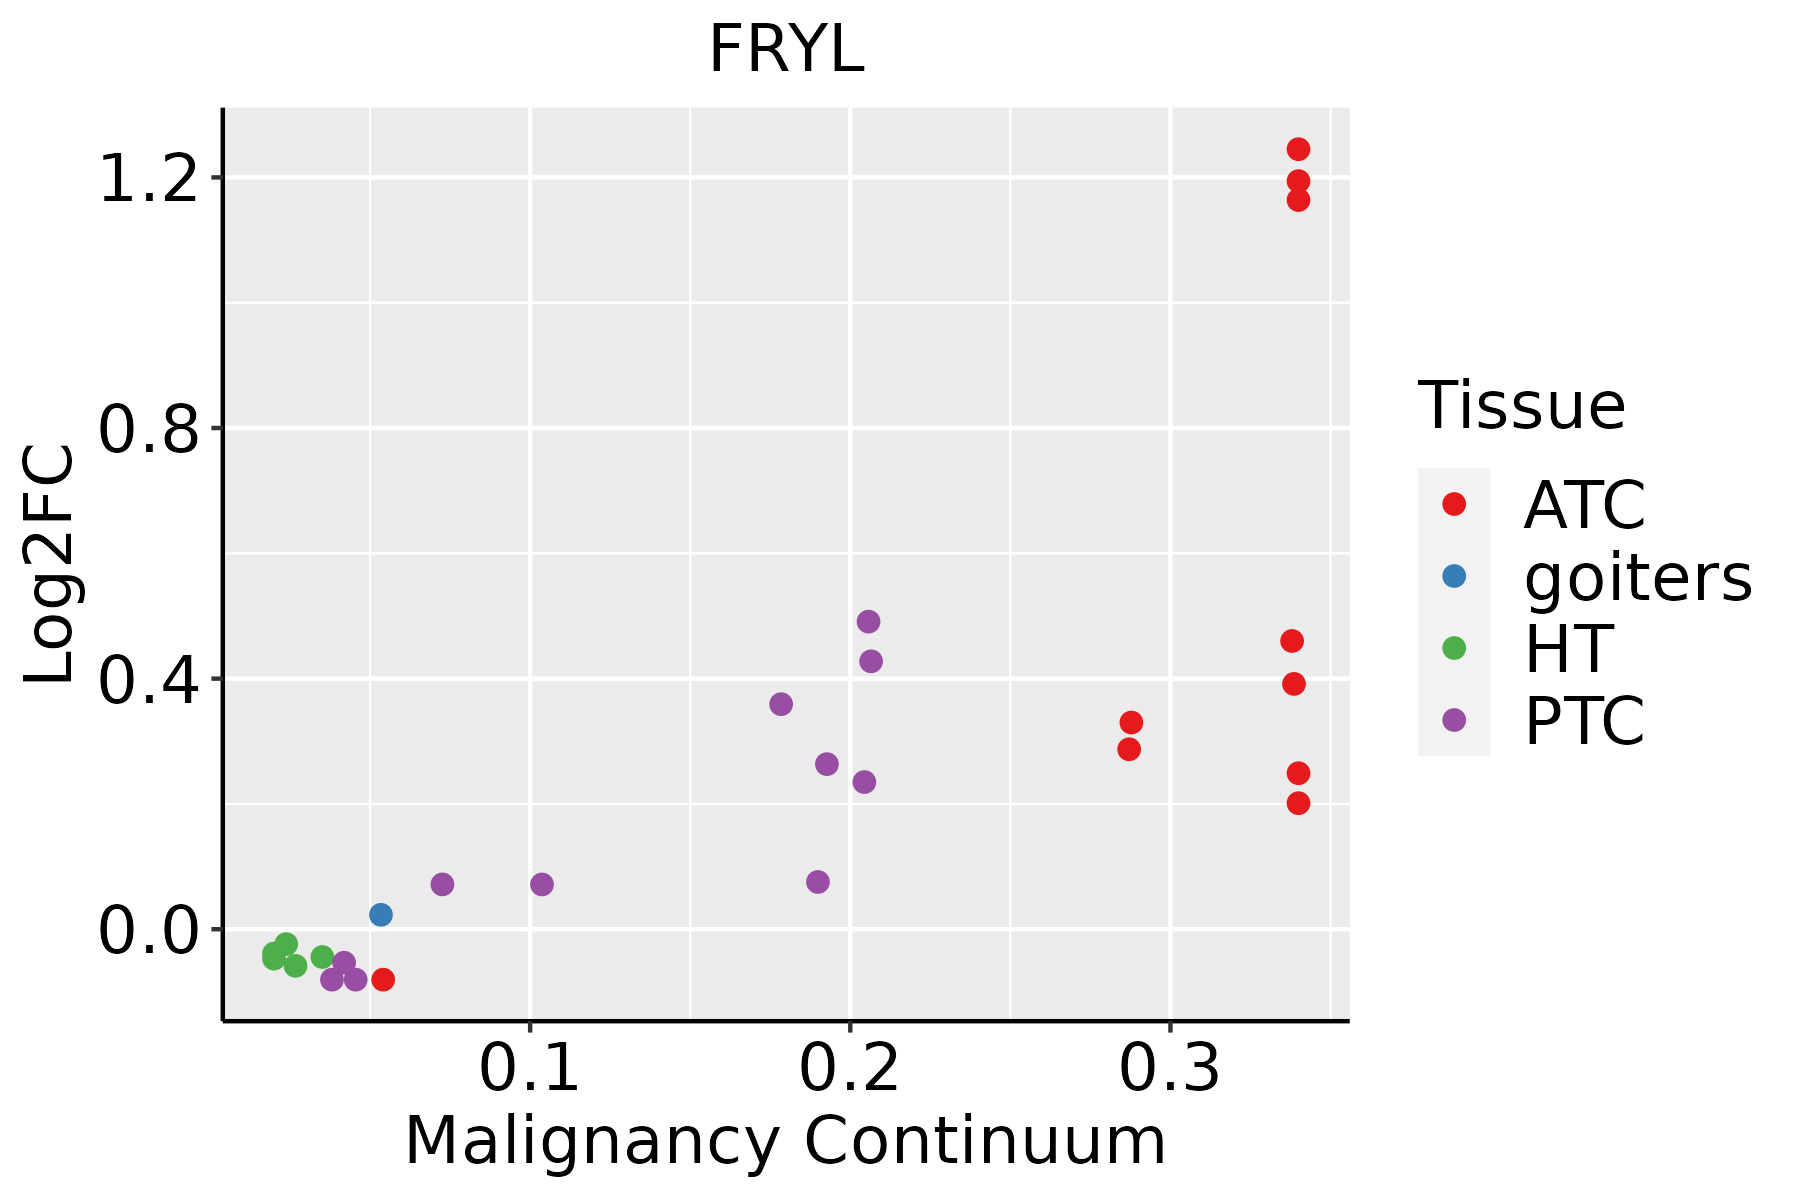 | ATC: Anaplastic thyroid cancer |
| HT: Hashimoto's thyroiditis | ||
| PTC: Papillary thyroid cancer |
| ∗log2FC in expression of this searched gene in stem-like cells from each diseased tissue sample relative to stem-like cells in normal samples in each tissue plotted against the malignancy continuum. Samples are colored based on if they are from different disease stage. |
Top |
Malignant transformation related pathway analysis |
| Find out the enriched GO biological processes and KEGG pathways involved in transition from healthy to precancer to cancer |
| Tissue | Disease Stage | Enriched GO biological Processes |
| Colorectum | AD |  |
| Colorectum | SER |  |
| Colorectum | MSS |  |
| Colorectum | MSI-H |  |
| Colorectum | FAP |  |
| ∗Top 15 enriched GO BP terms are showed in the bar plot of each disease state in each tissue. Each row represents a significant GO biological process which is colored according to the -log10(p.adjust). |
| Page: 1 2 3 4 5 6 7 8 9 |
| GO ID | Tissue | Disease Stage | Description | Gene Ratio | Bg Ratio | pvalue | p.adjust | Count |
| Page: 1 |
| Pathway ID | Tissue | Disease Stage | Description | Gene Ratio | Bg Ratio | pvalue | p.adjust | qvalue | Count |
| Page: 1 |
Top |
Cell-cell communication analysis |
| Identification of potential cell-cell interactions between two cell types and their ligand-receptor pairs for different disease states |
| Ligand | Receptor | LRpair | Pathway | Tissue | Disease Stage |
| Page: 1 |
Top |
Single-cell gene regulatory network inference analysis |
| Find out the significant the regulons (TFs) and the target genes of each regulon across cell types for different disease states |
| TF | Cell Type | Tissue | Disease Stage | Target Gene | RSS | Regulon Activity |
| ∗The dot plots of a searched regulon are shown for all cell subpopulations in each disease state of each tissue based on the regulon specific score inferred using pySCENIC and by calculating the average expression. |
| Page: 1 |
Top |
Somatic mutation of malignant transformation related genes |
| Annotation of somatic variants for genes involved in malignant transformation |
| Hugo Symbol | Variant Class | Variant Classification | dbSNP RS | HGVSc | HGVSp | HGVSp Short | SWISSPROT | BIOTYPE | SIFT | PolyPhen | Tumor Sample Barcode | Tissue | Histology | Sex | Age | Stage | Therapy Types | Drugs | Outcome |
| FRYL | SNV | Missense_Mutation | novel | c.4598G>A | p.Ser1533Asn | p.S1533N | O94915 | protein_coding | deleterious(0.01) | probably_damaging(0.972) | TCGA-3C-AALK-01 | Breast | breast invasive carcinoma | Female | <65 | I/II | Chemotherapy | docetaxel | SD |
| FRYL | SNV | Missense_Mutation | rs781407347 | c.1184N>A | p.Arg395Gln | p.R395Q | O94915 | protein_coding | deleterious(0) | probably_damaging(0.99) | TCGA-A8-A06Q-01 | Breast | breast invasive carcinoma | Female | <65 | III/IV | Unknown | Unknown | SD |
| FRYL | SNV | Missense_Mutation | c.5158A>G | p.Ile1720Val | p.I1720V | O94915 | protein_coding | tolerated(0.3) | benign(0) | TCGA-A8-A09Z-01 | Breast | breast invasive carcinoma | Female | >=65 | I/II | Unknown | Unknown | SD | |
| FRYL | SNV | Missense_Mutation | rs545267489 | c.7846N>A | p.Glu2616Lys | p.E2616K | O94915 | protein_coding | tolerated_low_confidence(0.19) | benign(0.018) | TCGA-AC-A23H-01 | Breast | breast invasive carcinoma | Female | >=65 | I/II | Unknown | Unknown | PD |
| FRYL | SNV | Missense_Mutation | c.7624N>G | p.Gln2542Glu | p.Q2542E | O94915 | protein_coding | tolerated_low_confidence(0.37) | benign(0.007) | TCGA-AC-A23H-01 | Breast | breast invasive carcinoma | Female | >=65 | I/II | Unknown | Unknown | PD | |
| FRYL | SNV | Missense_Mutation | c.822N>G | p.Ile274Met | p.I274M | O94915 | protein_coding | deleterious(0) | possibly_damaging(0.82) | TCGA-AC-A23H-01 | Breast | breast invasive carcinoma | Female | >=65 | I/II | Unknown | Unknown | PD | |
| FRYL | SNV | Missense_Mutation | novel | c.8455G>T | p.Asp2819Tyr | p.D2819Y | O94915 | protein_coding | tolerated(0.09) | benign(0.089) | TCGA-AN-A046-01 | Breast | breast invasive carcinoma | Female | >=65 | I/II | Unknown | Unknown | SD |
| FRYL | SNV | Missense_Mutation | rs545267489 | c.7846G>A | p.Glu2616Lys | p.E2616K | O94915 | protein_coding | tolerated_low_confidence(0.19) | benign(0.018) | TCGA-AN-A046-01 | Breast | breast invasive carcinoma | Female | >=65 | I/II | Unknown | Unknown | SD |
| FRYL | SNV | Missense_Mutation | c.6191T>G | p.Leu2064Arg | p.L2064R | O94915 | protein_coding | deleterious(0) | probably_damaging(1) | TCGA-AO-A1KP-01 | Breast | breast invasive carcinoma | Female | >=65 | I/II | Chemotherapy | fluorouracil | SD | |
| FRYL | SNV | Missense_Mutation | rs771261214 | c.8403N>A | p.Asp2801Glu | p.D2801E | O94915 | protein_coding | tolerated(0.77) | benign(0) | TCGA-AO-A1KT-01 | Breast | breast invasive carcinoma | Female | >=65 | I/II | Chemotherapy | fluorouracil | SD |
| Page: 1 2 3 4 5 6 7 8 9 10 11 12 13 14 15 16 17 18 19 20 21 22 23 24 25 26 27 28 29 |
Top |
Related drugs of malignant transformation related genes |
| Identification of chemicals and drugs interact with genes involved in malignant transfromation |
| (DGIdb 4.0) |
| Entrez ID | Symbol | Category | Interaction Types | Drug Claim Name | Drug Name | PMIDs |
| Page: 1 |

Copyright 2023-Present -The University of Texas Health Science Center at Houston |