
|
|||||
|
 | |
| |
| |
| |
| |
| |
|
Gene: FRY |
Gene summary for FRY |
| Gene information | Species | Human | Gene symbol | FRY | Gene ID | 10129 |
| Gene name | FRY microtubule binding protein | |
| Gene Alias | 13CDNA73 | |
| Cytomap | 13q13.1 | |
| Gene Type | protein-coding | GO ID | GO:0000902 | UniProtAcc | Q5TBA9 |
Top |
Malignant transformation analysis |
| Identification of the aberrant gene expression in precancerous and cancerous lesions by comparing the gene expression of stem-like cells in diseased tissues with normal stem cells |
| Entrez ID | Symbol | Replicates | Species | Organ | Tissue | Adj P-value | Log2FC | Malignancy |
| 10129 | FRY | S43 | Human | Liver | Cirrhotic | 1.52e-07 | -1.32e-01 | -0.0187 |
| 10129 | FRY | HCC1_Meng | Human | Liver | HCC | 1.33e-71 | -2.58e-04 | 0.0246 |
| 10129 | FRY | HCC2_Meng | Human | Liver | HCC | 6.44e-11 | -1.85e-01 | 0.0107 |
| 10129 | FRY | cirrhotic2 | Human | Liver | Cirrhotic | 1.86e-03 | -1.39e-01 | 0.0201 |
| 10129 | FRY | HCC5 | Human | Liver | HCC | 2.63e-02 | 1.35e+00 | 0.4932 |
| 10129 | FRY | S028 | Human | Liver | HCC | 2.75e-04 | 4.33e-01 | 0.2503 |
| 10129 | FRY | S029 | Human | Liver | HCC | 1.97e-11 | 7.97e-01 | 0.2581 |
| 10129 | FRY | TD9 | Human | Lung | IAC | 6.78e-04 | 6.88e-01 | 0.088 |
| 10129 | FRY | RNA-P10T2-P10T2-3 | Human | Lung | AAH | 1.37e-02 | 5.30e-01 | -0.1408 |
| 10129 | FRY | RNA-P17T-P17T-4 | Human | Lung | IAC | 1.00e-03 | 4.14e-01 | 0.343 |
| 10129 | FRY | RNA-P17T-P17T-6 | Human | Lung | IAC | 7.10e-03 | 2.92e-01 | 0.3385 |
| 10129 | FRY | RNA-P17T-P17T-8 | Human | Lung | IAC | 1.04e-05 | 4.81e-01 | 0.3329 |
| 10129 | FRY | RNA-P25T1-P25T1-1 | Human | Lung | AIS | 1.85e-05 | 3.31e-01 | -0.2116 |
| 10129 | FRY | RNA-P25T1-P25T1-2 | Human | Lung | AIS | 2.23e-02 | 3.37e-01 | -0.1941 |
| 10129 | FRY | RNA-P25T1-P25T1-3 | Human | Lung | AIS | 2.96e-02 | 5.44e-01 | -0.2107 |
| 10129 | FRY | RNA-P25T1-P25T1-4 | Human | Lung | AIS | 3.52e-08 | 4.80e-01 | -0.2119 |
| 10129 | FRY | RNA-P6T2-P6T2-1 | Human | Lung | IAC | 7.65e-04 | 2.00e-01 | -0.0166 |
| 10129 | FRY | RNA-P6T2-P6T2-2 | Human | Lung | IAC | 3.09e-09 | 3.22e-01 | -0.0132 |
| 10129 | FRY | RNA-P6T2-P6T2-3 | Human | Lung | IAC | 8.88e-14 | 2.95e-01 | -0.013 |
| 10129 | FRY | RNA-P6T2-P6T2-4 | Human | Lung | IAC | 2.47e-05 | 2.79e-01 | -0.0121 |
| Page: 1 2 |
| Tissue | Expression Dynamics | Abbreviation |
| Liver | 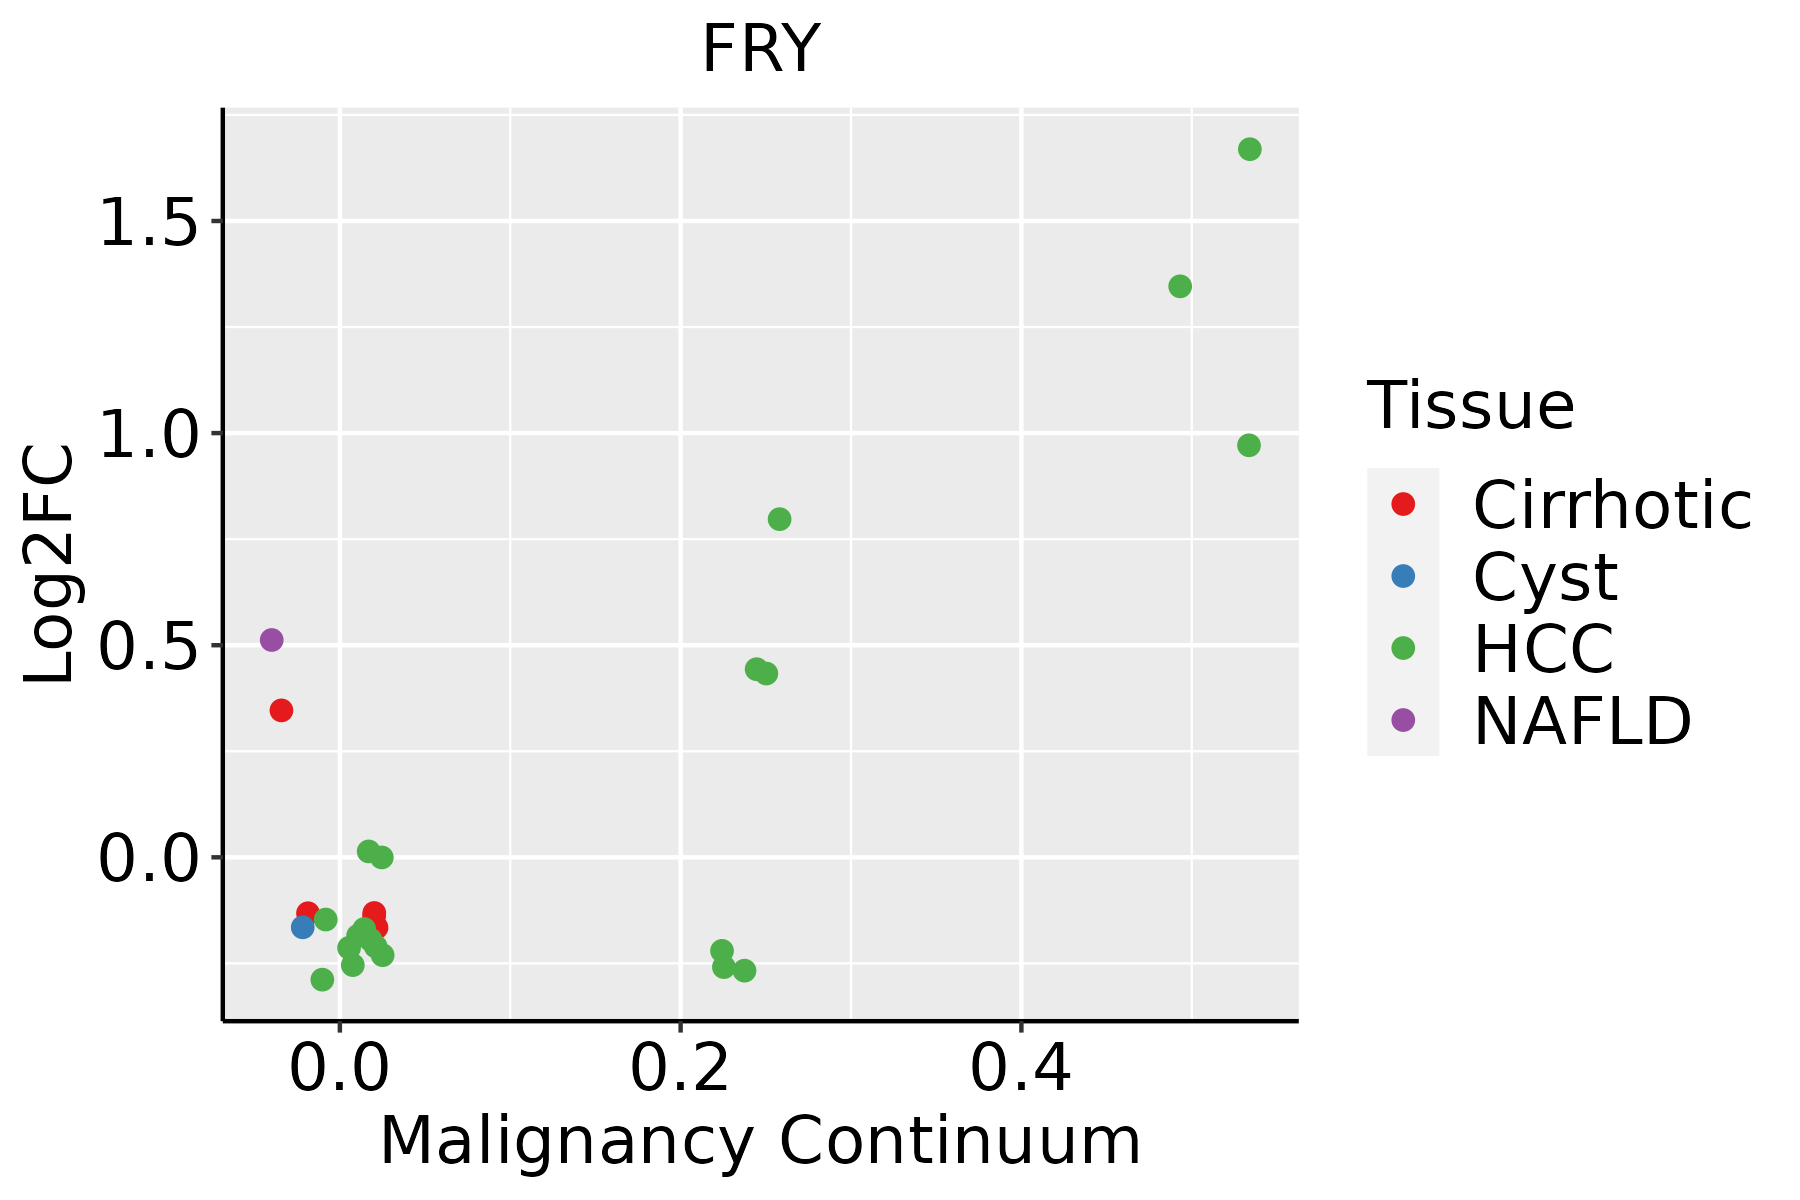 | HCC: Hepatocellular carcinoma |
| NAFLD: Non-alcoholic fatty liver disease | ||
| Lung |  | AAH: Atypical adenomatous hyperplasia |
| AIS: Adenocarcinoma in situ | ||
| IAC: Invasive lung adenocarcinoma | ||
| MIA: Minimally invasive adenocarcinoma | ||
| Oral Cavity |  | EOLP: Erosive Oral lichen planus |
| LP: leukoplakia | ||
| NEOLP: Non-erosive oral lichen planus | ||
| OSCC: Oral squamous cell carcinoma |
| ∗log2FC in expression of this searched gene in stem-like cells from each diseased tissue sample relative to stem-like cells in normal samples in each tissue plotted against the malignancy continuum. Samples are colored based on if they are from different disease stage. |
Top |
Malignant transformation related pathway analysis |
| Find out the enriched GO biological processes and KEGG pathways involved in transition from healthy to precancer to cancer |
| Tissue | Disease Stage | Enriched GO biological Processes |
| Colorectum | AD |  |
| Colorectum | SER |  |
| Colorectum | MSS |  |
| Colorectum | MSI-H |  |
| Colorectum | FAP |  |
| ∗Top 15 enriched GO BP terms are showed in the bar plot of each disease state in each tissue. Each row represents a significant GO biological process which is colored according to the -log10(p.adjust). |
| Page: 1 2 3 4 5 6 7 8 9 |
| GO ID | Tissue | Disease Stage | Description | Gene Ratio | Bg Ratio | pvalue | p.adjust | Count |
| GO:0090042 | Liver | Cirrhotic | tubulin deacetylation | 8/4634 | 13/18723 | 5.27e-03 | 2.70e-02 | 8 |
| GO:0035601 | Liver | Cirrhotic | protein deacylation | 39/4634 | 112/18723 | 1.08e-02 | 4.75e-02 | 39 |
| GO:0098732 | Liver | HCC | macromolecule deacylation | 67/7958 | 116/18723 | 6.46e-04 | 3.99e-03 | 67 |
| GO:00356011 | Liver | HCC | protein deacylation | 64/7958 | 112/18723 | 1.23e-03 | 6.83e-03 | 64 |
| GO:00900421 | Liver | HCC | tubulin deacetylation | 11/7958 | 13/18723 | 2.38e-03 | 1.16e-02 | 11 |
| GO:0090311 | Liver | HCC | regulation of protein deacetylation | 30/7958 | 48/18723 | 4.10e-03 | 1.78e-02 | 30 |
| GO:00064761 | Liver | HCC | protein deacetylation | 55/7958 | 101/18723 | 1.01e-02 | 3.79e-02 | 55 |
| GO:00064762 | Lung | IAC | protein deacetylation | 25/2061 | 101/18723 | 7.38e-05 | 1.55e-03 | 25 |
| GO:00356012 | Lung | IAC | protein deacylation | 25/2061 | 112/18723 | 4.18e-04 | 6.25e-03 | 25 |
| GO:00987322 | Lung | IAC | macromolecule deacylation | 25/2061 | 116/18723 | 7.26e-04 | 9.60e-03 | 25 |
| GO:00903112 | Lung | IAC | regulation of protein deacetylation | 12/2061 | 48/18723 | 4.87e-03 | 3.77e-02 | 12 |
| GO:000647611 | Lung | AIS | protein deacetylation | 23/1849 | 101/18723 | 1.06e-04 | 2.54e-03 | 23 |
| GO:003560111 | Lung | AIS | protein deacylation | 23/1849 | 112/18723 | 5.25e-04 | 8.42e-03 | 23 |
| GO:00987321 | Lung | AIS | macromolecule deacylation | 23/1849 | 116/18723 | 8.77e-04 | 1.19e-02 | 23 |
| GO:00903111 | Lung | AIS | regulation of protein deacetylation | 11/1849 | 48/18723 | 6.14e-03 | 4.98e-02 | 11 |
| GO:00356014 | Oral cavity | OSCC | protein deacylation | 74/7305 | 112/18723 | 5.88e-09 | 1.26e-07 | 74 |
| GO:00987324 | Oral cavity | OSCC | macromolecule deacylation | 74/7305 | 116/18723 | 5.52e-08 | 1.01e-06 | 74 |
| GO:00064764 | Oral cavity | OSCC | protein deacetylation | 66/7305 | 101/18723 | 7.36e-08 | 1.30e-06 | 66 |
| GO:00903113 | Oral cavity | OSCC | regulation of protein deacetylation | 30/7305 | 48/18723 | 8.31e-04 | 4.41e-03 | 30 |
| GO:000647621 | Oral cavity | EOLP | protein deacetylation | 23/2218 | 101/18723 | 1.42e-03 | 9.65e-03 | 23 |
| Page: 1 2 |
| Pathway ID | Tissue | Disease Stage | Description | Gene Ratio | Bg Ratio | pvalue | p.adjust | qvalue | Count |
| Page: 1 |
Top |
Cell-cell communication analysis |
| Identification of potential cell-cell interactions between two cell types and their ligand-receptor pairs for different disease states |
| Ligand | Receptor | LRpair | Pathway | Tissue | Disease Stage |
| Page: 1 |
Top |
Single-cell gene regulatory network inference analysis |
| Find out the significant the regulons (TFs) and the target genes of each regulon across cell types for different disease states |
| TF | Cell Type | Tissue | Disease Stage | Target Gene | RSS | Regulon Activity |
| ∗The dot plots of a searched regulon are shown for all cell subpopulations in each disease state of each tissue based on the regulon specific score inferred using pySCENIC and by calculating the average expression. |
| Page: 1 |
Top |
Somatic mutation of malignant transformation related genes |
| Annotation of somatic variants for genes involved in malignant transformation |
| Hugo Symbol | Variant Class | Variant Classification | dbSNP RS | HGVSc | HGVSp | HGVSp Short | SWISSPROT | BIOTYPE | SIFT | PolyPhen | Tumor Sample Barcode | Tissue | Histology | Sex | Age | Stage | Therapy Types | Drugs | Outcome |
| FRY | SNV | Missense_Mutation | novel | c.4504G>C | p.Glu1502Gln | p.E1502Q | Q5TBA9 | protein_coding | deleterious(0.01) | benign(0.116) | TCGA-A7-A6VY-01 | Breast | breast invasive carcinoma | Female | <65 | I/II | Chemotherapy | cyclophosphamide | CR |
| FRY | SNV | Missense_Mutation | novel | c.1892N>A | p.Arg631Lys | p.R631K | Q5TBA9 | protein_coding | tolerated(0.1) | benign(0.078) | TCGA-A8-A06R-01 | Breast | breast invasive carcinoma | Female | >=65 | I/II | Chemotherapy | 5-fluorouracil | CR |
| FRY | SNV | Missense_Mutation | rs368412145 | c.8798N>G | p.Asn2933Ser | p.N2933S | Q5TBA9 | protein_coding | tolerated(0.4) | benign(0.013) | TCGA-AO-A0JC-01 | Breast | breast invasive carcinoma | Female | <65 | I/II | Chemotherapy | fluorouracil | SD |
| FRY | SNV | Missense_Mutation | c.967N>A | p.Pro323Thr | p.P323T | Q5TBA9 | protein_coding | deleterious(0) | probably_damaging(0.999) | TCGA-BH-A0DQ-01 | Breast | breast invasive carcinoma | Female | <65 | I/II | Chemotherapy | doxorubicin | SD | |
| FRY | SNV | Missense_Mutation | novel | c.7498G>C | p.Glu2500Gln | p.E2500Q | Q5TBA9 | protein_coding | tolerated(0.68) | benign(0.083) | TCGA-C8-A8HQ-01 | Breast | breast invasive carcinoma | Female | <65 | I/II | Unknown | Unknown | SD |
| FRY | SNV | Missense_Mutation | c.2885C>T | p.Pro962Leu | p.P962L | Q5TBA9 | protein_coding | deleterious(0.02) | possibly_damaging(0.877) | TCGA-D8-A27K-01 | Breast | breast invasive carcinoma | Female | <65 | I/II | Chemotherapy | adriamycin+cyclophosphamid | SD | |
| FRY | SNV | Missense_Mutation | rs761675708 | c.8857N>T | p.Arg2953Cys | p.R2953C | Q5TBA9 | protein_coding | deleterious(0.04) | probably_damaging(0.932) | TCGA-E2-A15T-01 | Breast | breast invasive carcinoma | Female | >=65 | I/II | Hormone Therapy | arimidex | SD |
| FRY | SNV | Missense_Mutation | novel | c.6248A>G | p.Glu2083Gly | p.E2083G | Q5TBA9 | protein_coding | deleterious(0) | probably_damaging(0.999) | TCGA-GM-A3XL-01 | Breast | breast invasive carcinoma | Female | <65 | I/II | Chemotherapy | fluorouracil | CR |
| FRY | insertion | Nonsense_Mutation | novel | c.858_859insCTTACAGTATAAGAAGGGTAAAGGAGAAGAAAA | p.Asp286_Phe287insLeuThrValTerGluGlyTerArgArgArgLys | p.D286_F287insLTV*EG*RRRK | Q5TBA9 | protein_coding | TCGA-A2-A0D1-01 | Breast | breast invasive carcinoma | Female | >=65 | I/II | Chemotherapy | taxotere | SD | ||
| FRY | insertion | Nonsense_Mutation | novel | c.2654_2655insTTTTCTTCTTTTAAAAATAACTACTTTGGTTTTGTAACACTT | p.Gln885delinsHisPheLeuLeuLeuLysIleThrThrLeuValLeuTerHisLeu | p.Q885delinsHFLLLKITTLVL*HL | Q5TBA9 | protein_coding | TCGA-AN-A03X-01 | Breast | breast invasive carcinoma | Female | >=65 | I/II | Unknown | Unknown | SD |
| Page: 1 2 3 4 5 6 7 8 9 10 11 12 13 14 15 16 17 18 19 20 21 22 23 24 25 26 27 28 29 30 31 32 33 34 35 36 37 38 39 40 |
Top |
Related drugs of malignant transformation related genes |
| Identification of chemicals and drugs interact with genes involved in malignant transfromation |
| (DGIdb 4.0) |
| Entrez ID | Symbol | Category | Interaction Types | Drug Claim Name | Drug Name | PMIDs |
| Page: 1 |

Copyright 2023-Present -The University of Texas Health Science Center at Houston |