
|
|||||
|
 | |
| |
| |
| |
| |
| |
|
Gene: FRS2 |
Gene summary for FRS2 |
| Gene information | Species | Human | Gene symbol | FRS2 | Gene ID | 10818 |
| Gene name | fibroblast growth factor receptor substrate 2 | |
| Gene Alias | FRS1A | |
| Cytomap | 12q15 | |
| Gene Type | protein-coding | GO ID | GO:0000003 | UniProtAcc | L7RTG7 |
Top |
Malignant transformation analysis |
| Identification of the aberrant gene expression in precancerous and cancerous lesions by comparing the gene expression of stem-like cells in diseased tissues with normal stem cells |
| Entrez ID | Symbol | Replicates | Species | Organ | Tissue | Adj P-value | Log2FC | Malignancy |
| 10818 | FRS2 | CCI_2 | Human | Cervix | CC | 2.92e-10 | 9.36e-01 | 0.5249 |
| 10818 | FRS2 | CCI_3 | Human | Cervix | CC | 1.58e-08 | 6.68e-01 | 0.516 |
| 10818 | FRS2 | HTA11_3410_2000001011 | Human | Colorectum | AD | 6.99e-09 | -4.55e-01 | 0.0155 |
| 10818 | FRS2 | HTA11_7862_2000001011 | Human | Colorectum | AD | 1.28e-02 | -5.61e-01 | -0.0179 |
| 10818 | FRS2 | HTA11_866_3004761011 | Human | Colorectum | AD | 1.08e-07 | -4.81e-01 | 0.096 |
| 10818 | FRS2 | HTA11_7696_3000711011 | Human | Colorectum | AD | 1.30e-08 | -3.90e-01 | 0.0674 |
| 10818 | FRS2 | HTA11_99999970781_79442 | Human | Colorectum | MSS | 4.00e-14 | -4.47e-01 | 0.294 |
| 10818 | FRS2 | HTA11_99999971662_82457 | Human | Colorectum | MSS | 6.46e-12 | -4.06e-01 | 0.3859 |
| 10818 | FRS2 | HTA11_99999973899_84307 | Human | Colorectum | MSS | 1.60e-02 | -5.13e-01 | 0.2585 |
| 10818 | FRS2 | HTA11_99999974143_84620 | Human | Colorectum | MSS | 2.14e-13 | -4.86e-01 | 0.3005 |
| 10818 | FRS2 | F007 | Human | Colorectum | FAP | 3.41e-02 | -3.30e-01 | 0.1176 |
| 10818 | FRS2 | A001-C-207 | Human | Colorectum | FAP | 1.60e-02 | -3.04e-01 | 0.1278 |
| 10818 | FRS2 | A015-C-203 | Human | Colorectum | FAP | 3.37e-17 | -3.32e-01 | -0.1294 |
| 10818 | FRS2 | A015-C-204 | Human | Colorectum | FAP | 4.96e-03 | -2.64e-01 | -0.0228 |
| 10818 | FRS2 | A002-C-201 | Human | Colorectum | FAP | 3.68e-12 | -3.89e-01 | 0.0324 |
| 10818 | FRS2 | A002-C-203 | Human | Colorectum | FAP | 1.51e-02 | -1.59e-01 | 0.2786 |
| 10818 | FRS2 | A001-C-119 | Human | Colorectum | FAP | 4.91e-05 | -4.30e-01 | -0.1557 |
| 10818 | FRS2 | A001-C-108 | Human | Colorectum | FAP | 2.50e-12 | -3.34e-01 | -0.0272 |
| 10818 | FRS2 | A002-C-205 | Human | Colorectum | FAP | 9.82e-17 | -4.58e-01 | -0.1236 |
| 10818 | FRS2 | A015-C-006 | Human | Colorectum | FAP | 5.27e-09 | -2.62e-01 | -0.0994 |
| Page: 1 2 3 4 5 6 |
| Tissue | Expression Dynamics | Abbreviation |
| Cervix | 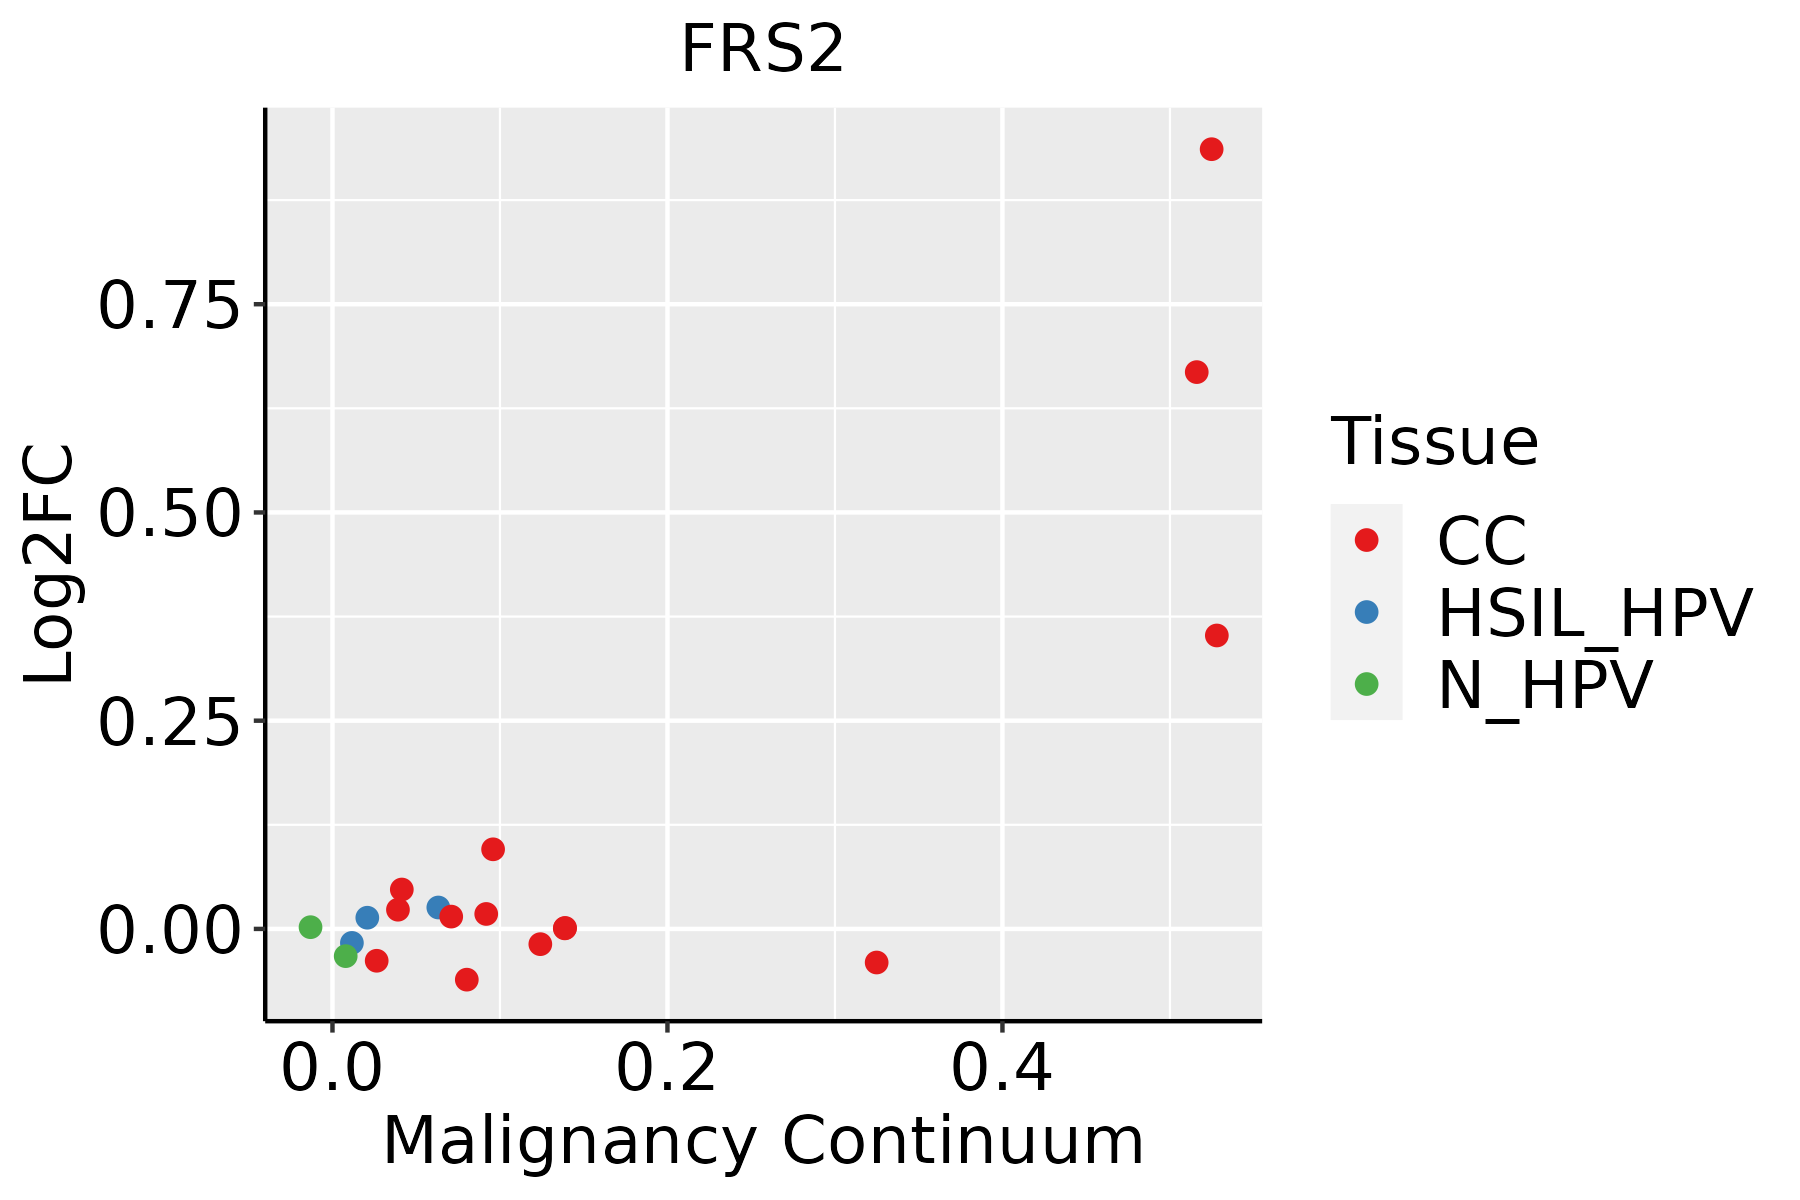 | CC: Cervix cancer |
| HSIL_HPV: HPV-infected high-grade squamous intraepithelial lesions | ||
| N_HPV: HPV-infected normal cervix | ||
| Colorectum (GSE201348) |  | FAP: Familial adenomatous polyposis |
| CRC: Colorectal cancer | ||
| Colorectum (HTA11) |  | AD: Adenomas |
| SER: Sessile serrated lesions | ||
| MSI-H: Microsatellite-high colorectal cancer | ||
| MSS: Microsatellite stable colorectal cancer | ||
| Esophagus | 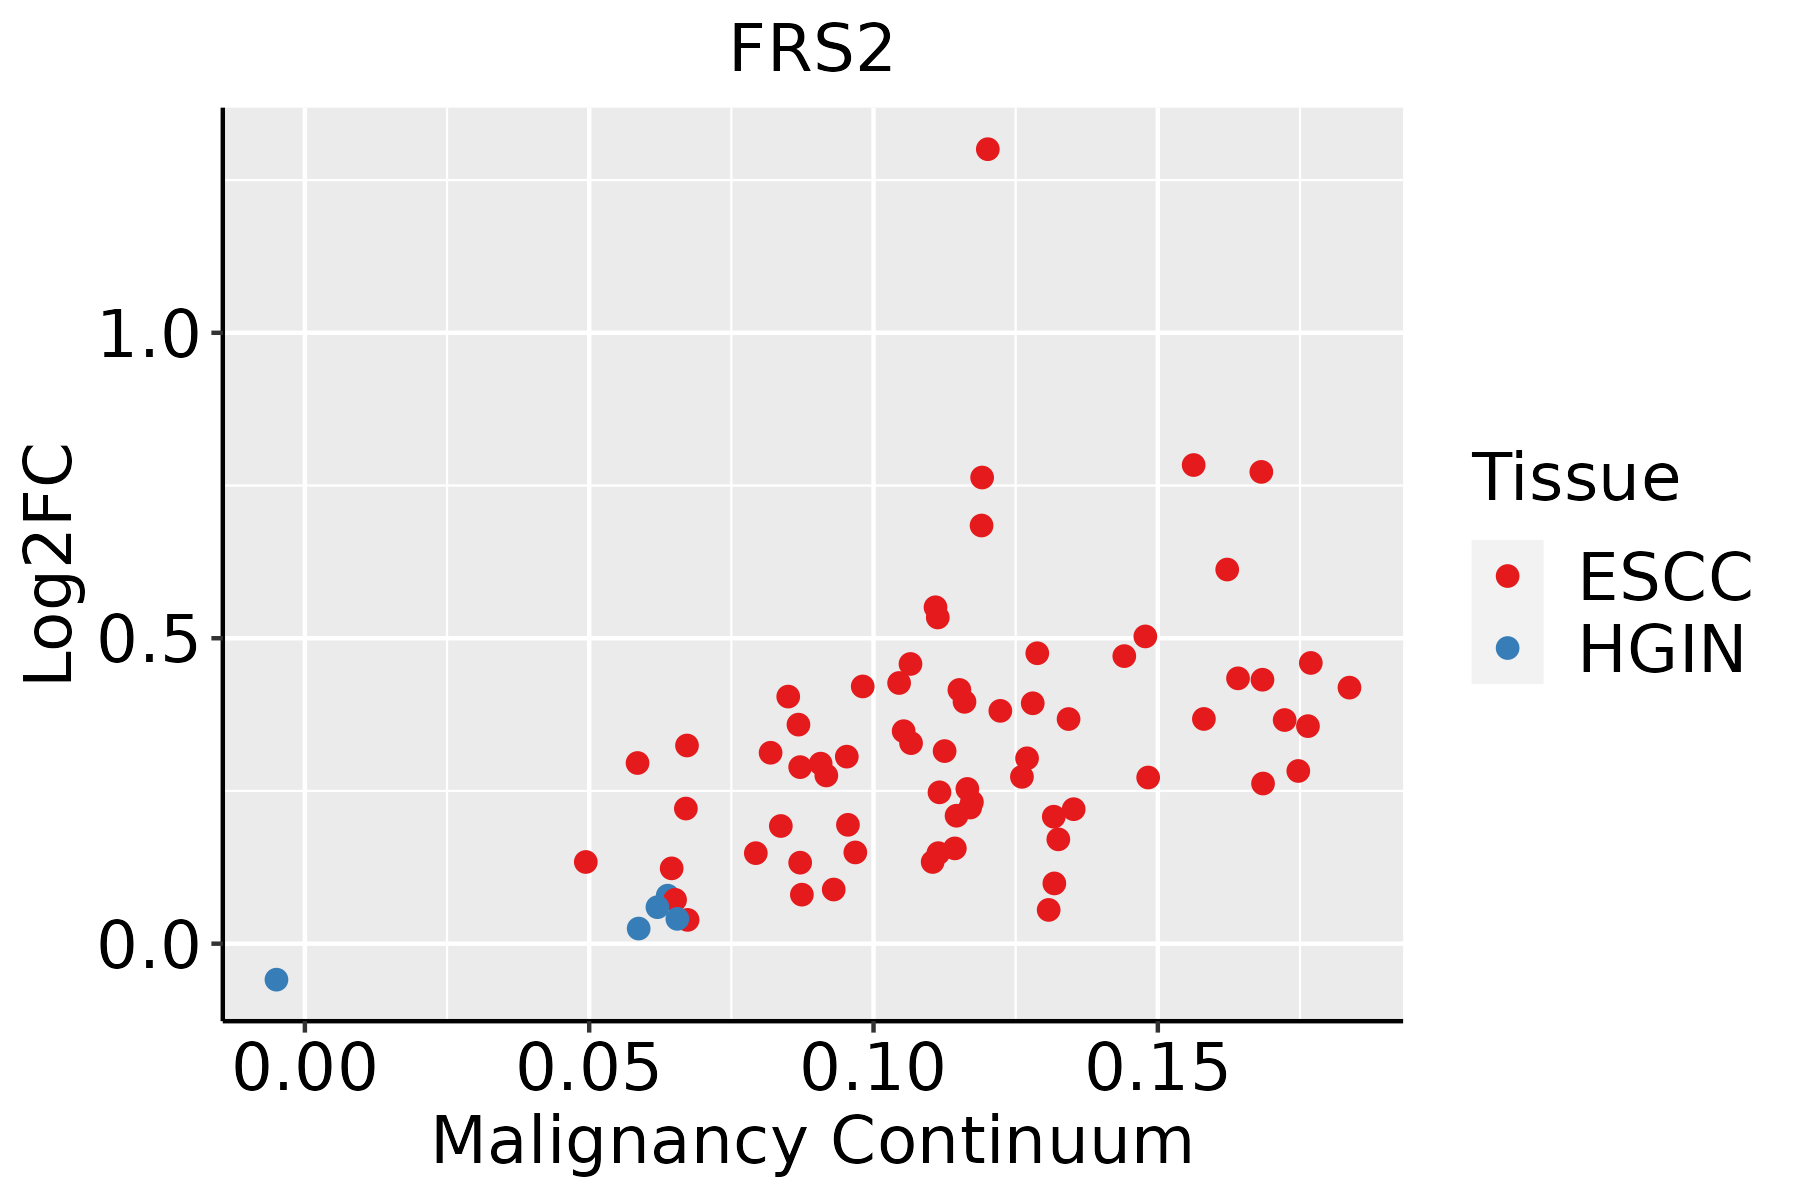 | ESCC: Esophageal squamous cell carcinoma |
| HGIN: High-grade intraepithelial neoplasias | ||
| LGIN: Low-grade intraepithelial neoplasias | ||
| Liver | 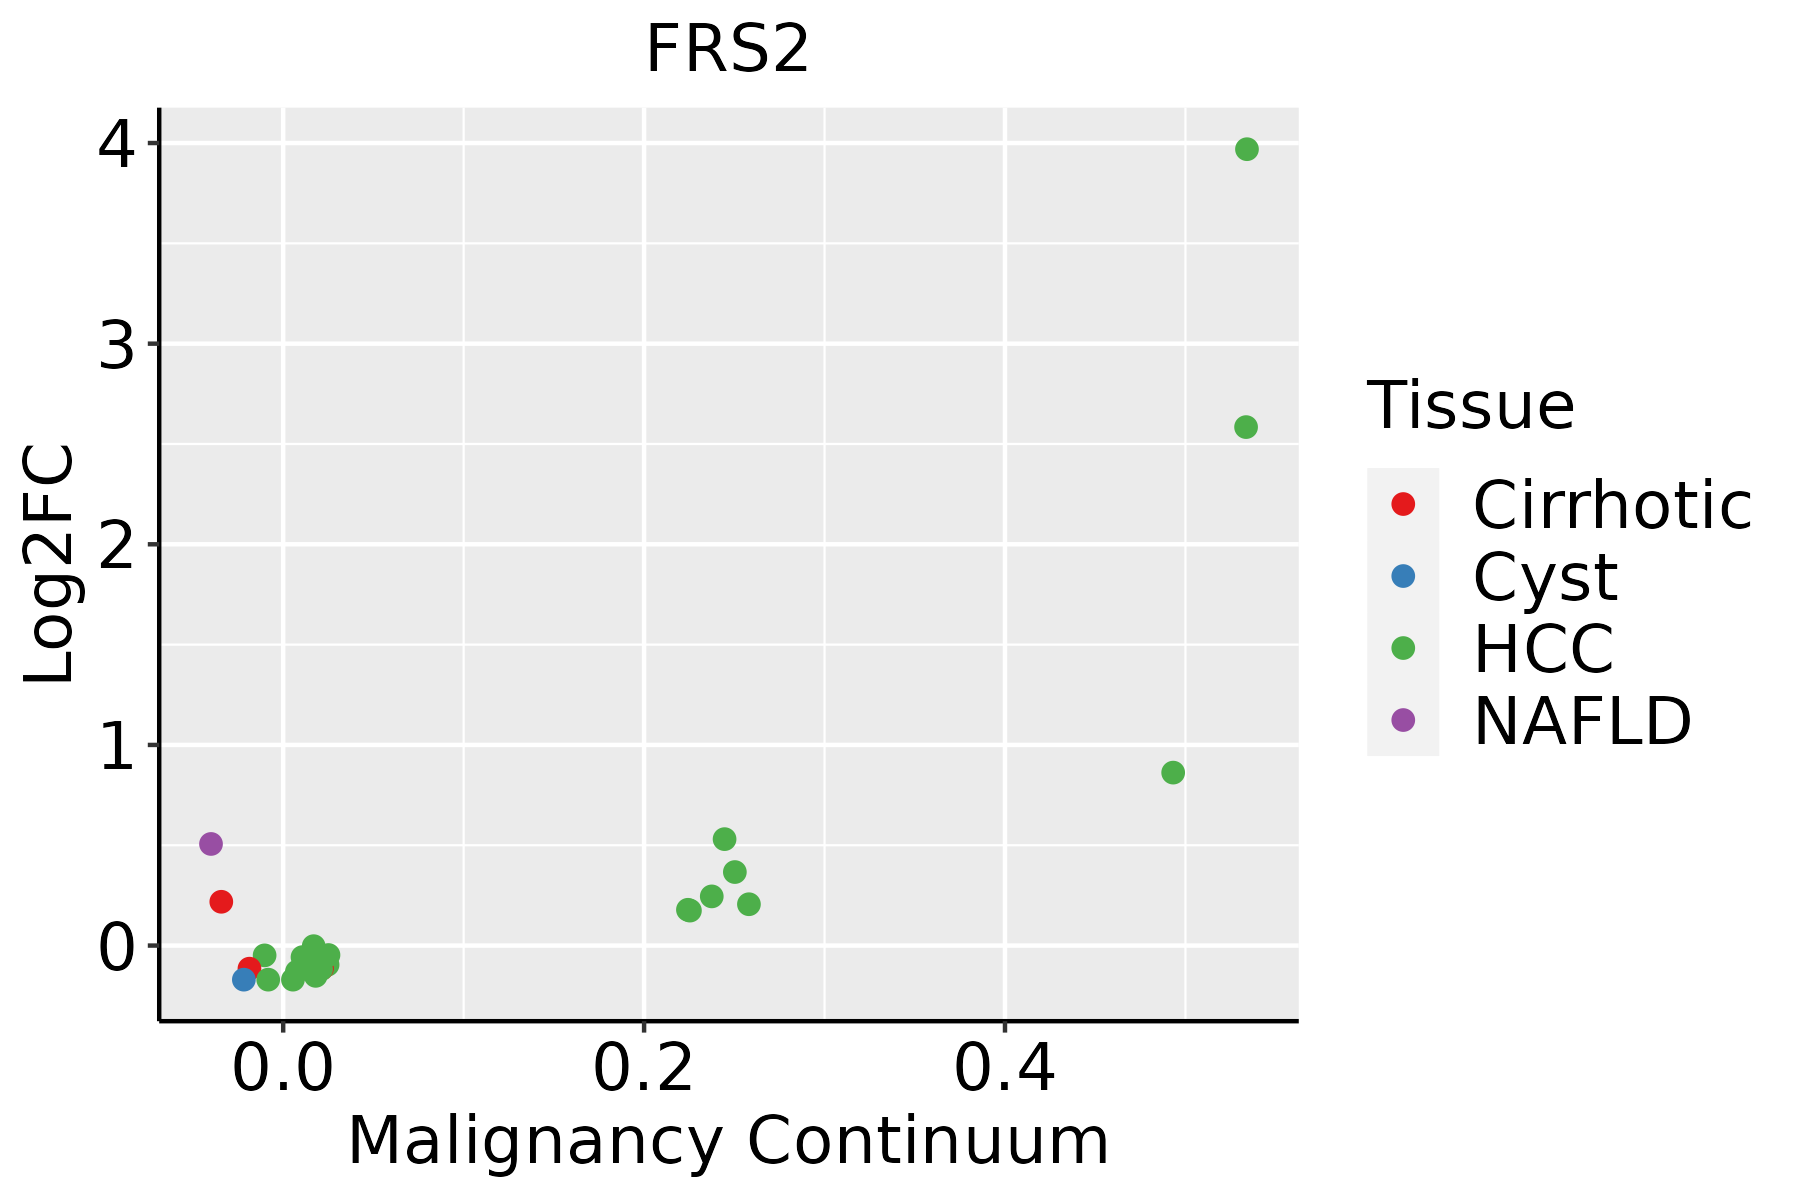 | HCC: Hepatocellular carcinoma |
| NAFLD: Non-alcoholic fatty liver disease | ||
| Lung | 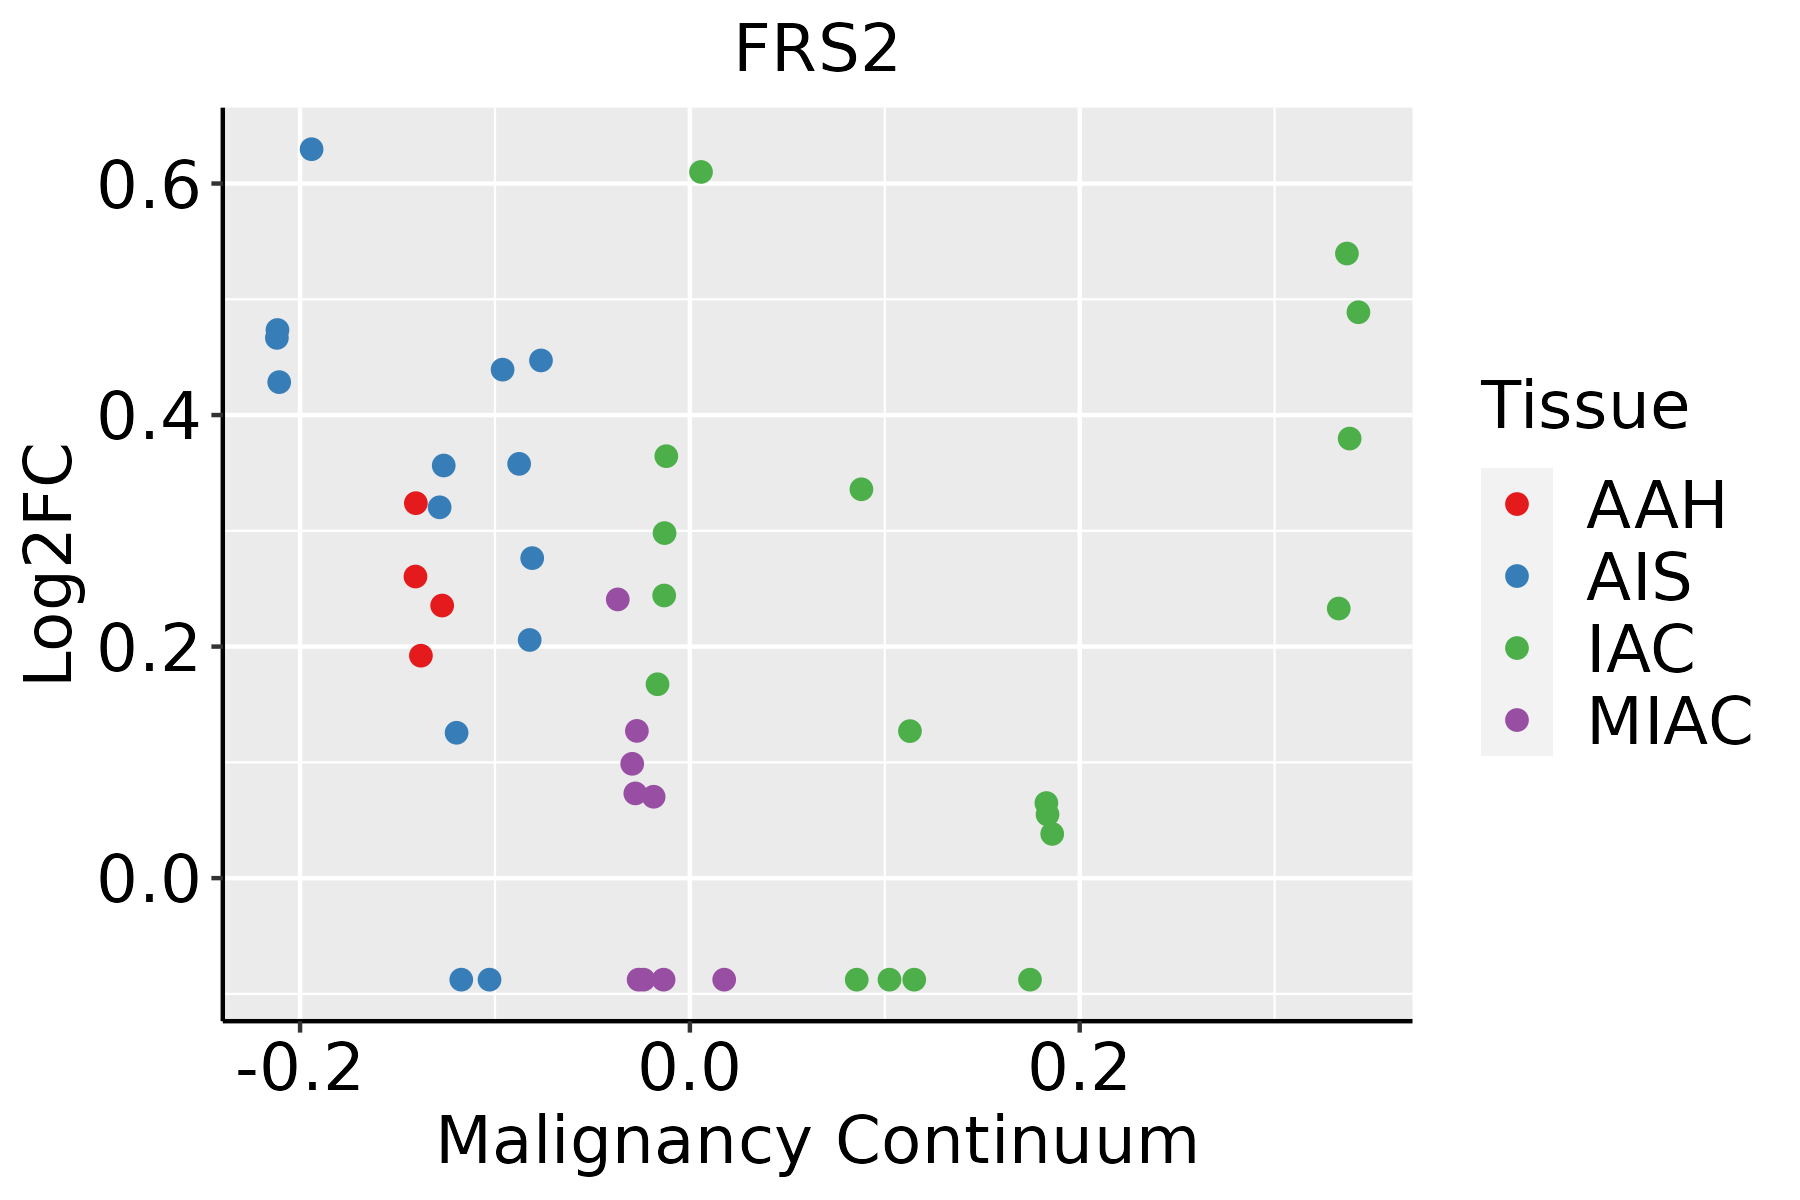 | AAH: Atypical adenomatous hyperplasia |
| AIS: Adenocarcinoma in situ | ||
| IAC: Invasive lung adenocarcinoma | ||
| MIA: Minimally invasive adenocarcinoma | ||
| Thyroid |  | ATC: Anaplastic thyroid cancer |
| HT: Hashimoto's thyroiditis | ||
| PTC: Papillary thyroid cancer |
| ∗log2FC in expression of this searched gene in stem-like cells from each diseased tissue sample relative to stem-like cells in normal samples in each tissue plotted against the malignancy continuum. Samples are colored based on if they are from different disease stage. |
Top |
Malignant transformation related pathway analysis |
| Find out the enriched GO biological processes and KEGG pathways involved in transition from healthy to precancer to cancer |
| Tissue | Disease Stage | Enriched GO biological Processes |
| Colorectum | AD |  |
| Colorectum | SER |  |
| Colorectum | MSS |  |
| Colorectum | MSI-H |  |
| Colorectum | FAP |  |
| ∗Top 15 enriched GO BP terms are showed in the bar plot of each disease state in each tissue. Each row represents a significant GO biological process which is colored according to the -log10(p.adjust). |
| Page: 1 2 3 4 5 6 7 8 9 |
| GO ID | Tissue | Disease Stage | Description | Gene Ratio | Bg Ratio | pvalue | p.adjust | Count |
| GO:00506737 | Cervix | CC | epithelial cell proliferation | 98/2311 | 437/18723 | 2.01e-09 | 2.15e-07 | 98 |
| GO:00506787 | Cervix | CC | regulation of epithelial cell proliferation | 83/2311 | 381/18723 | 1.31e-07 | 6.42e-06 | 83 |
| GO:00614588 | Cervix | CC | reproductive system development | 87/2311 | 427/18723 | 1.37e-06 | 4.55e-05 | 87 |
| GO:00486088 | Cervix | CC | reproductive structure development | 86/2311 | 424/18723 | 1.90e-06 | 5.97e-05 | 86 |
| GO:004873210 | Cervix | CC | gland development | 84/2311 | 436/18723 | 1.93e-05 | 3.54e-04 | 84 |
| GO:00434104 | Cervix | CC | positive regulation of MAPK cascade | 90/2311 | 480/18723 | 2.92e-05 | 4.83e-04 | 90 |
| GO:00073695 | Cervix | CC | gastrulation | 42/2311 | 185/18723 | 5.83e-05 | 8.46e-04 | 42 |
| GO:00605375 | Cervix | CC | muscle tissue development | 76/2311 | 403/18723 | 9.76e-05 | 1.27e-03 | 76 |
| GO:00147064 | Cervix | CC | striated muscle tissue development | 72/2311 | 384/18723 | 1.76e-04 | 2.07e-03 | 72 |
| GO:000206410 | Cervix | CC | epithelial cell development | 45/2311 | 220/18723 | 4.14e-04 | 4.21e-03 | 45 |
| GO:00426924 | Cervix | CC | muscle cell differentiation | 69/2311 | 384/18723 | 8.12e-04 | 7.09e-03 | 69 |
| GO:00703714 | Cervix | CC | ERK1 and ERK2 cascade | 60/2311 | 330/18723 | 1.28e-03 | 1.02e-02 | 60 |
| GO:0060525 | Cervix | CC | prostate glandular acinus development | 5/2311 | 10/18723 | 4.20e-03 | 2.58e-02 | 5 |
| GO:00703723 | Cervix | CC | regulation of ERK1 and ERK2 cascade | 54/2311 | 309/18723 | 5.11e-03 | 3.02e-02 | 54 |
| GO:00017636 | Cervix | CC | morphogenesis of a branching structure | 37/2311 | 196/18723 | 5.36e-03 | 3.10e-02 | 37 |
| GO:00511464 | Cervix | CC | striated muscle cell differentiation | 50/2311 | 283/18723 | 5.53e-03 | 3.19e-02 | 50 |
| GO:00309003 | Cervix | CC | forebrain development | 64/2311 | 379/18723 | 5.53e-03 | 3.19e-02 | 64 |
| GO:0150063 | Cervix | CC | visual system development | 63/2311 | 375/18723 | 6.58e-03 | 3.65e-02 | 63 |
| GO:00308503 | Cervix | CC | prostate gland development | 12/2311 | 45/18723 | 7.00e-03 | 3.77e-02 | 12 |
| GO:0001654 | Cervix | CC | eye development | 62/2311 | 371/18723 | 7.83e-03 | 4.13e-02 | 62 |
| Page: 1 2 3 4 5 6 7 8 9 |
| Pathway ID | Tissue | Disease Stage | Description | Gene Ratio | Bg Ratio | pvalue | p.adjust | qvalue | Count |
| hsa0471420 | Cervix | CC | Thermogenesis | 76/1267 | 232/8465 | 4.29e-12 | 1.16e-10 | 6.85e-11 | 76 |
| hsa0520516 | Cervix | CC | Proteoglycans in cancer | 60/1267 | 205/8465 | 9.13e-08 | 1.18e-06 | 7.00e-07 | 60 |
| hsa0472214 | Cervix | CC | Neurotrophin signaling pathway | 32/1267 | 119/8465 | 5.01e-04 | 2.42e-03 | 1.43e-03 | 32 |
| hsa04714110 | Cervix | CC | Thermogenesis | 76/1267 | 232/8465 | 4.29e-12 | 1.16e-10 | 6.85e-11 | 76 |
| hsa0520517 | Cervix | CC | Proteoglycans in cancer | 60/1267 | 205/8465 | 9.13e-08 | 1.18e-06 | 7.00e-07 | 60 |
| hsa0472215 | Cervix | CC | Neurotrophin signaling pathway | 32/1267 | 119/8465 | 5.01e-04 | 2.42e-03 | 1.43e-03 | 32 |
| hsa04714 | Colorectum | AD | Thermogenesis | 120/2092 | 232/8465 | 2.76e-19 | 1.16e-17 | 7.37e-18 | 120 |
| hsa04722 | Colorectum | AD | Neurotrophin signaling pathway | 50/2092 | 119/8465 | 2.28e-05 | 2.24e-04 | 1.43e-04 | 50 |
| hsa05205 | Colorectum | AD | Proteoglycans in cancer | 70/2092 | 205/8465 | 1.37e-03 | 8.46e-03 | 5.39e-03 | 70 |
| hsa047141 | Colorectum | AD | Thermogenesis | 120/2092 | 232/8465 | 2.76e-19 | 1.16e-17 | 7.37e-18 | 120 |
| hsa047221 | Colorectum | AD | Neurotrophin signaling pathway | 50/2092 | 119/8465 | 2.28e-05 | 2.24e-04 | 1.43e-04 | 50 |
| hsa052051 | Colorectum | AD | Proteoglycans in cancer | 70/2092 | 205/8465 | 1.37e-03 | 8.46e-03 | 5.39e-03 | 70 |
| hsa047144 | Colorectum | MSS | Thermogenesis | 113/1875 | 232/8465 | 1.52e-19 | 4.62e-18 | 2.83e-18 | 113 |
| hsa047224 | Colorectum | MSS | Neurotrophin signaling pathway | 45/1875 | 119/8465 | 7.04e-05 | 6.55e-04 | 4.02e-04 | 45 |
| hsa052054 | Colorectum | MSS | Proteoglycans in cancer | 65/1875 | 205/8465 | 8.66e-04 | 5.38e-03 | 3.29e-03 | 65 |
| hsa047145 | Colorectum | MSS | Thermogenesis | 113/1875 | 232/8465 | 1.52e-19 | 4.62e-18 | 2.83e-18 | 113 |
| hsa047225 | Colorectum | MSS | Neurotrophin signaling pathway | 45/1875 | 119/8465 | 7.04e-05 | 6.55e-04 | 4.02e-04 | 45 |
| hsa052055 | Colorectum | MSS | Proteoglycans in cancer | 65/1875 | 205/8465 | 8.66e-04 | 5.38e-03 | 3.29e-03 | 65 |
| hsa047148 | Colorectum | FAP | Thermogenesis | 70/1404 | 232/8465 | 1.38e-07 | 3.08e-06 | 1.87e-06 | 70 |
| hsa047226 | Colorectum | FAP | Neurotrophin signaling pathway | 38/1404 | 119/8465 | 2.49e-05 | 2.78e-04 | 1.69e-04 | 38 |
| Page: 1 2 3 |
Top |
Cell-cell communication analysis |
| Identification of potential cell-cell interactions between two cell types and their ligand-receptor pairs for different disease states |
| Ligand | Receptor | LRpair | Pathway | Tissue | Disease Stage |
| Page: 1 |
Top |
Single-cell gene regulatory network inference analysis |
| Find out the significant the regulons (TFs) and the target genes of each regulon across cell types for different disease states |
| TF | Cell Type | Tissue | Disease Stage | Target Gene | RSS | Regulon Activity |
| ∗The dot plots of a searched regulon are shown for all cell subpopulations in each disease state of each tissue based on the regulon specific score inferred using pySCENIC and by calculating the average expression. |
| Page: 1 |
Top |
Somatic mutation of malignant transformation related genes |
| Annotation of somatic variants for genes involved in malignant transformation |
| Hugo Symbol | Variant Class | Variant Classification | dbSNP RS | HGVSc | HGVSp | HGVSp Short | SWISSPROT | BIOTYPE | SIFT | PolyPhen | Tumor Sample Barcode | Tissue | Histology | Sex | Age | Stage | Therapy Types | Drugs | Outcome |
| FRS2 | SNV | Missense_Mutation | c.662N>G | p.Ser221Cys | p.S221C | Q8WU20 | protein_coding | deleterious(0.02) | benign(0.431) | TCGA-A2-A0EQ-01 | Breast | breast invasive carcinoma | Female | <65 | I/II | Chemotherapy | adriamycin | SD | |
| FRS2 | SNV | Missense_Mutation | c.662N>T | p.Ser221Phe | p.S221F | Q8WU20 | protein_coding | deleterious(0.01) | benign(0.36) | TCGA-AR-A2LE-01 | Breast | breast invasive carcinoma | Female | >=65 | I/II | Hormone Therapy | tamoxiphen | PD | |
| FRS2 | insertion | Nonsense_Mutation | novel | c.935_936insTGCAGTGAACTGAGATCATGCCACTGCATTCCAGCCTGGGCGAC | p.Ser313AlafsTer4 | p.S313Afs*4 | Q8WU20 | protein_coding | TCGA-A8-A09D-01 | Breast | breast invasive carcinoma | Female | <65 | I/II | Chemotherapy | doxorubicin | CR | ||
| FRS2 | insertion | Frame_Shift_Ins | novel | c.902_903insCGGTCCTCTGTATCTAATTAGCCATACCGTTCTGGTAATAC | p.Asn302GlyfsTer22 | p.N302Gfs*22 | Q8WU20 | protein_coding | TCGA-AN-A03X-01 | Breast | breast invasive carcinoma | Female | >=65 | I/II | Unknown | Unknown | SD | ||
| FRS2 | SNV | Missense_Mutation | c.1201N>T | p.Pro401Ser | p.P401S | Q8WU20 | protein_coding | tolerated(0.22) | benign(0.346) | TCGA-DS-A1OC-01 | Cervix | cervical & endocervical cancer | Female | <65 | I/II | Chemotherapy | gemcitabine | SD | |
| FRS2 | SNV | Missense_Mutation | rs775308985 | c.1085G>A | p.Arg362His | p.R362H | Q8WU20 | protein_coding | tolerated(0.11) | benign(0) | TCGA-EA-A3Y4-01 | Cervix | cervical & endocervical cancer | Female | <65 | I/II | Unknown | Unknown | SD |
| FRS2 | SNV | Missense_Mutation | c.1288N>A | p.Glu430Lys | p.E430K | Q8WU20 | protein_coding | deleterious(0.04) | benign(0.162) | TCGA-Q1-A73O-01 | Cervix | cervical & endocervical cancer | Female | <65 | I/II | Chemotherapy | cisplatin | CR | |
| FRS2 | SNV | Missense_Mutation | c.913G>A | p.Val305Met | p.V305M | Q8WU20 | protein_coding | tolerated(0.09) | benign(0.094) | TCGA-AA-3710-01 | Colorectum | colon adenocarcinoma | Female | >=65 | I/II | Unknown | Unknown | SD | |
| FRS2 | SNV | Missense_Mutation | novel | c.1307N>G | p.Tyr436Cys | p.Y436C | Q8WU20 | protein_coding | deleterious(0) | probably_damaging(0.99) | TCGA-AA-3984-01 | Colorectum | colon adenocarcinoma | Female | <65 | I/II | Unknown | Unknown | SD |
| FRS2 | SNV | Missense_Mutation | novel | c.820N>T | p.Asp274Tyr | p.D274Y | Q8WU20 | protein_coding | deleterious(0.03) | benign(0.031) | TCGA-CA-6717-01 | Colorectum | colon adenocarcinoma | Male | <65 | I/II | Chemotherapy | oxaliplatin | CR |
| Page: 1 2 3 4 5 6 |
Top |
Related drugs of malignant transformation related genes |
| Identification of chemicals and drugs interact with genes involved in malignant transfromation |
| (DGIdb 4.0) |
| Entrez ID | Symbol | Category | Interaction Types | Drug Claim Name | Drug Name | PMIDs |
| Page: 1 |

Copyright 2023-Present -The University of Texas Health Science Center at Houston |