
|
|||||
|
 | |
| |
| |
| |
| |
| |
|
Gene: FRMD8 |
Gene summary for FRMD8 |
| Gene information | Species | Human | Gene symbol | FRMD8 | Gene ID | 83786 |
| Gene name | FERM domain containing 8 | |
| Gene Alias | FKSG44 | |
| Cytomap | 11q13.1 | |
| Gene Type | protein-coding | GO ID | GO:0001816 | UniProtAcc | Q9BZ67 |
Top |
Malignant transformation analysis |
| Identification of the aberrant gene expression in precancerous and cancerous lesions by comparing the gene expression of stem-like cells in diseased tissues with normal stem cells |
| Entrez ID | Symbol | Replicates | Species | Organ | Tissue | Adj P-value | Log2FC | Malignancy |
| 83786 | FRMD8 | HTA11_2487_2000001011 | Human | Colorectum | SER | 3.25e-06 | 3.37e-01 | -0.1808 |
| 83786 | FRMD8 | HTA11_1938_2000001011 | Human | Colorectum | AD | 1.40e-02 | 2.16e-01 | -0.0811 |
| 83786 | FRMD8 | HTA11_347_2000001011 | Human | Colorectum | AD | 2.81e-04 | 1.71e-01 | -0.1954 |
| 83786 | FRMD8 | HTA11_411_2000001011 | Human | Colorectum | SER | 8.18e-04 | 8.00e-01 | -0.2602 |
| 83786 | FRMD8 | HTA11_3361_2000001011 | Human | Colorectum | AD | 5.44e-06 | 2.26e-01 | -0.1207 |
| 83786 | FRMD8 | HTA11_1391_2000001011 | Human | Colorectum | AD | 5.16e-13 | 4.65e-01 | -0.059 |
| 83786 | FRMD8 | HTA11_5212_2000001011 | Human | Colorectum | AD | 1.24e-04 | 3.18e-01 | -0.2061 |
| 83786 | FRMD8 | HTA11_10711_2000001011 | Human | Colorectum | AD | 6.73e-03 | 1.81e-01 | 0.0338 |
| 83786 | FRMD8 | HTA11_6818_2000001011 | Human | Colorectum | AD | 2.11e-02 | 2.06e-01 | 0.0112 |
| 83786 | FRMD8 | HTA11_99999971662_82457 | Human | Colorectum | MSS | 2.61e-09 | 3.15e-01 | 0.3859 |
| 83786 | FRMD8 | LZE4T | Human | Esophagus | ESCC | 1.74e-04 | 8.63e-02 | 0.0811 |
| 83786 | FRMD8 | LZE7T | Human | Esophagus | ESCC | 7.59e-11 | 3.13e-01 | 0.0667 |
| 83786 | FRMD8 | LZE8T | Human | Esophagus | ESCC | 6.08e-08 | 1.25e-01 | 0.067 |
| 83786 | FRMD8 | LZE20T | Human | Esophagus | ESCC | 1.97e-06 | 2.85e-01 | 0.0662 |
| 83786 | FRMD8 | LZE24T | Human | Esophagus | ESCC | 3.69e-16 | 4.48e-01 | 0.0596 |
| 83786 | FRMD8 | P1T-E | Human | Esophagus | ESCC | 3.77e-06 | 3.77e-01 | 0.0875 |
| 83786 | FRMD8 | P2T-E | Human | Esophagus | ESCC | 6.54e-30 | 2.15e-01 | 0.1177 |
| 83786 | FRMD8 | P4T-E | Human | Esophagus | ESCC | 4.20e-20 | 3.90e-01 | 0.1323 |
| 83786 | FRMD8 | P5T-E | Human | Esophagus | ESCC | 7.20e-20 | 1.93e-01 | 0.1327 |
| 83786 | FRMD8 | P8T-E | Human | Esophagus | ESCC | 5.27e-20 | 2.45e-01 | 0.0889 |
| Page: 1 2 3 4 5 |
| Tissue | Expression Dynamics | Abbreviation |
| Colorectum (GSE201348) |  | FAP: Familial adenomatous polyposis |
| CRC: Colorectal cancer | ||
| Colorectum (HTA11) |  | AD: Adenomas |
| SER: Sessile serrated lesions | ||
| MSI-H: Microsatellite-high colorectal cancer | ||
| MSS: Microsatellite stable colorectal cancer | ||
| Esophagus | 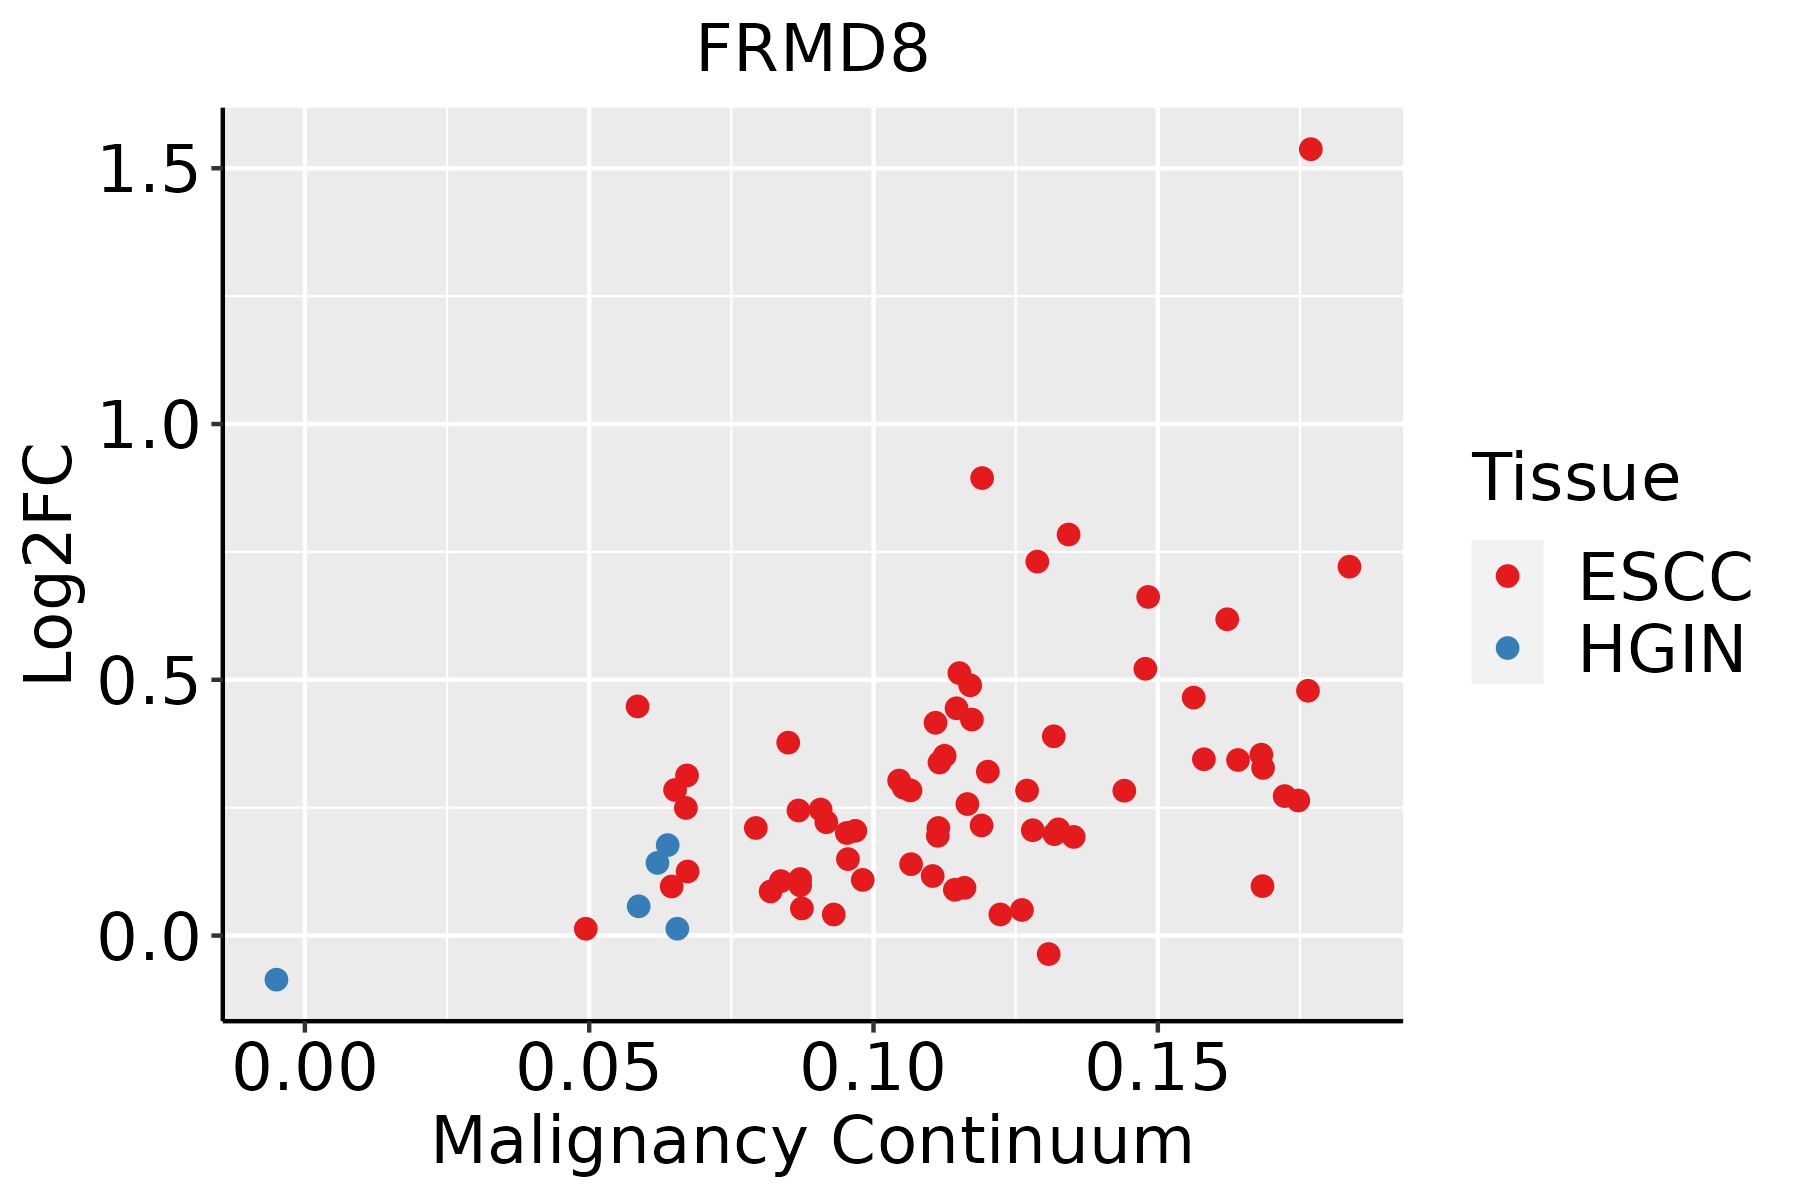 | ESCC: Esophageal squamous cell carcinoma |
| HGIN: High-grade intraepithelial neoplasias | ||
| LGIN: Low-grade intraepithelial neoplasias | ||
| Oral Cavity | 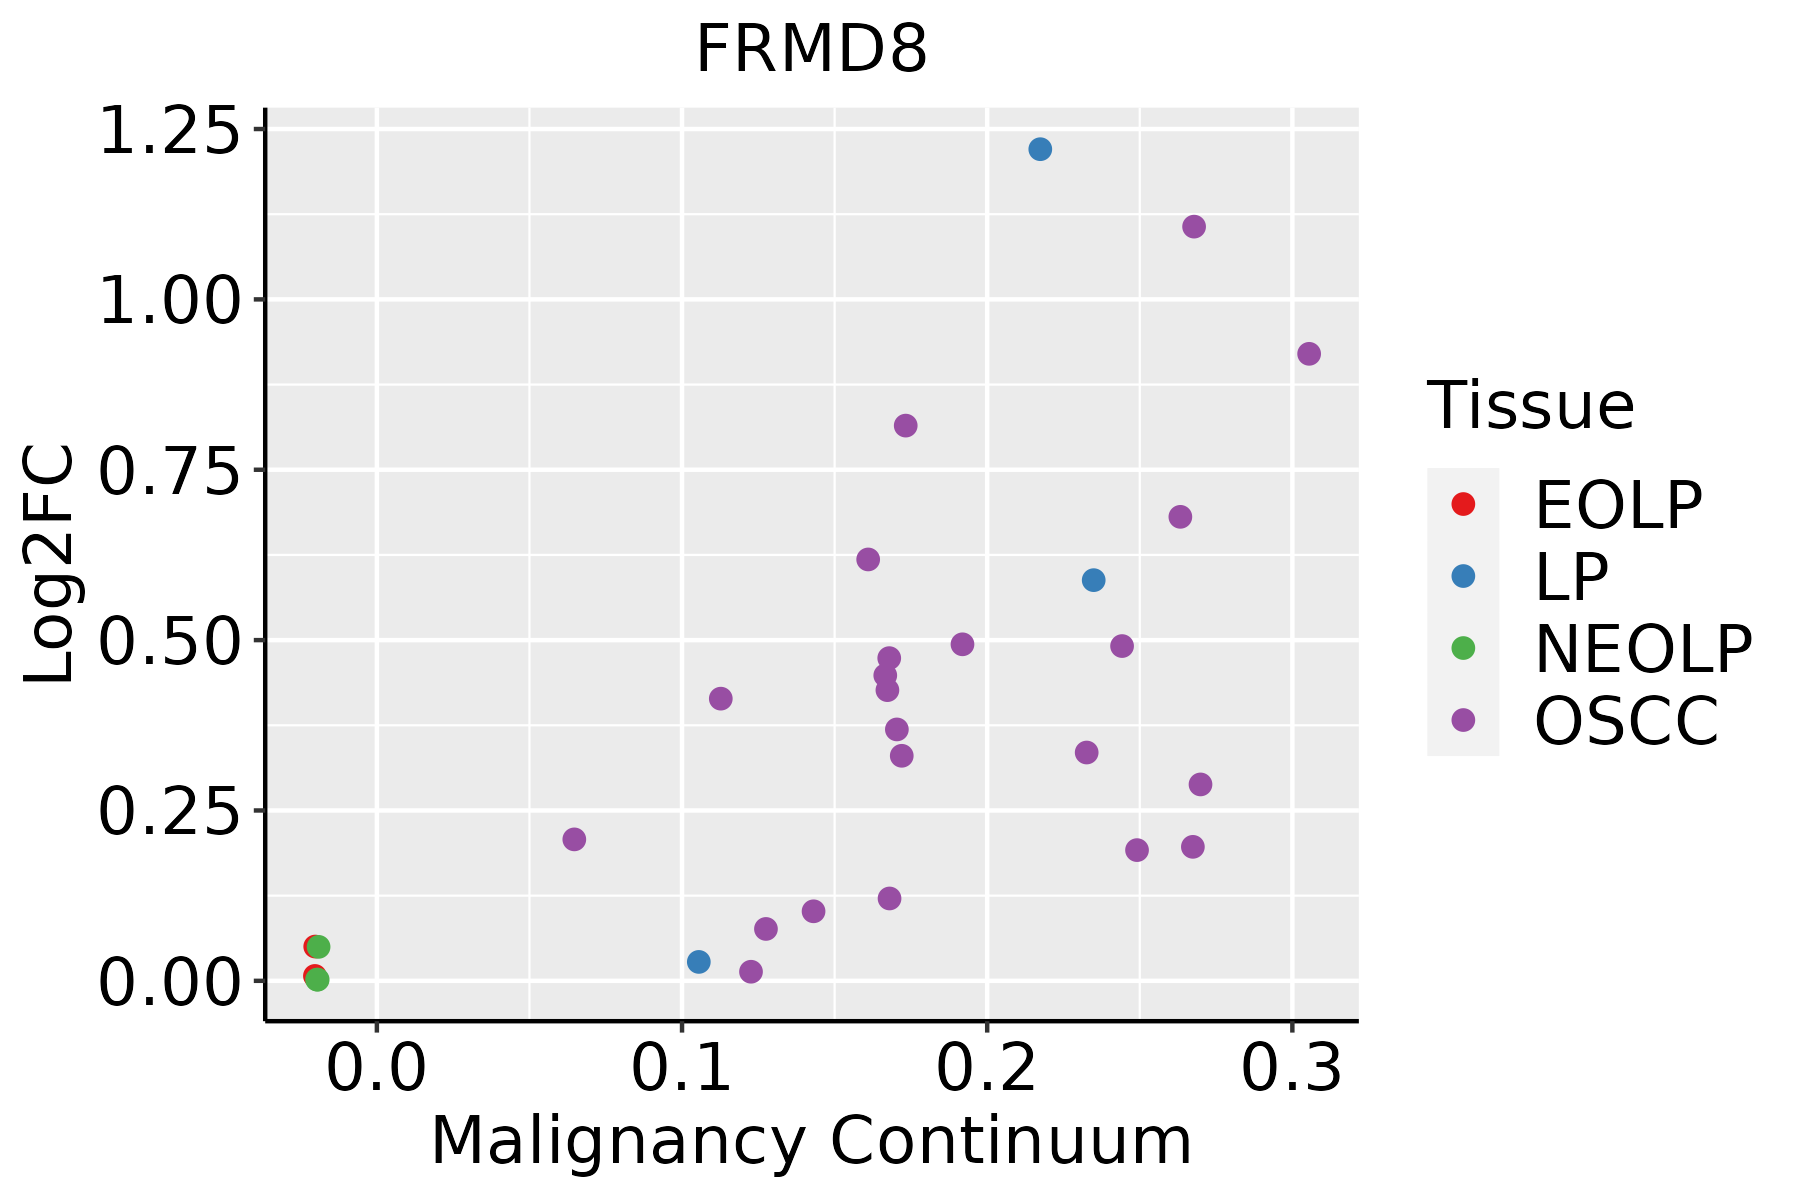 | EOLP: Erosive Oral lichen planus |
| LP: leukoplakia | ||
| NEOLP: Non-erosive oral lichen planus | ||
| OSCC: Oral squamous cell carcinoma |
| ∗log2FC in expression of this searched gene in stem-like cells from each diseased tissue sample relative to stem-like cells in normal samples in each tissue plotted against the malignancy continuum. Samples are colored based on if they are from different disease stage. |
Top |
Malignant transformation related pathway analysis |
| Find out the enriched GO biological processes and KEGG pathways involved in transition from healthy to precancer to cancer |
| Tissue | Disease Stage | Enriched GO biological Processes |
| Colorectum | AD |  |
| Colorectum | SER |  |
| Colorectum | MSS |  |
| Colorectum | MSI-H |  |
| Colorectum | FAP |  |
| ∗Top 15 enriched GO BP terms are showed in the bar plot of each disease state in each tissue. Each row represents a significant GO biological process which is colored according to the -log10(p.adjust). |
| Page: 1 2 3 4 5 6 7 8 9 |
| GO ID | Tissue | Disease Stage | Description | Gene Ratio | Bg Ratio | pvalue | p.adjust | Count |
| GO:0030111 | Colorectum | AD | regulation of Wnt signaling pathway | 102/3918 | 328/18723 | 8.51e-06 | 2.03e-04 | 102 |
| GO:0016055 | Colorectum | AD | Wnt signaling pathway | 130/3918 | 444/18723 | 1.60e-05 | 3.37e-04 | 130 |
| GO:0198738 | Colorectum | AD | cell-cell signaling by wnt | 130/3918 | 446/18723 | 2.02e-05 | 4.10e-04 | 130 |
| GO:0060070 | Colorectum | AD | canonical Wnt signaling pathway | 90/3918 | 303/18723 | 1.76e-04 | 2.38e-03 | 90 |
| GO:0060828 | Colorectum | AD | regulation of canonical Wnt signaling pathway | 77/3918 | 253/18723 | 2.19e-04 | 2.87e-03 | 77 |
| GO:00160551 | Colorectum | SER | Wnt signaling pathway | 97/2897 | 444/18723 | 2.02e-04 | 3.68e-03 | 97 |
| GO:01987381 | Colorectum | SER | cell-cell signaling by wnt | 97/2897 | 446/18723 | 2.39e-04 | 4.11e-03 | 97 |
| GO:00301111 | Colorectum | SER | regulation of Wnt signaling pathway | 75/2897 | 328/18723 | 2.47e-04 | 4.20e-03 | 75 |
| GO:00600701 | Colorectum | SER | canonical Wnt signaling pathway | 66/2897 | 303/18723 | 2.10e-03 | 2.06e-02 | 66 |
| GO:00608281 | Colorectum | SER | regulation of canonical Wnt signaling pathway | 56/2897 | 253/18723 | 3.03e-03 | 2.67e-02 | 56 |
| GO:00301112 | Colorectum | MSS | regulation of Wnt signaling pathway | 98/3467 | 328/18723 | 3.37e-07 | 1.36e-05 | 98 |
| GO:00160552 | Colorectum | MSS | Wnt signaling pathway | 124/3467 | 444/18723 | 6.06e-07 | 2.26e-05 | 124 |
| GO:01987382 | Colorectum | MSS | cell-cell signaling by wnt | 124/3467 | 446/18723 | 7.83e-07 | 2.77e-05 | 124 |
| GO:00600702 | Colorectum | MSS | canonical Wnt signaling pathway | 86/3467 | 303/18723 | 1.58e-05 | 3.56e-04 | 86 |
| GO:00608282 | Colorectum | MSS | regulation of canonical Wnt signaling pathway | 74/3467 | 253/18723 | 1.99e-05 | 4.26e-04 | 74 |
| GO:0030178 | Colorectum | MSS | negative regulation of Wnt signaling pathway | 48/3467 | 170/18723 | 1.23e-03 | 1.18e-02 | 48 |
| GO:001605517 | Esophagus | ESCC | Wnt signaling pathway | 268/8552 | 444/18723 | 2.32e-10 | 6.58e-09 | 268 |
| GO:019873817 | Esophagus | ESCC | cell-cell signaling by wnt | 269/8552 | 446/18723 | 2.41e-10 | 6.79e-09 | 269 |
| GO:003011117 | Esophagus | ESCC | regulation of Wnt signaling pathway | 194/8552 | 328/18723 | 5.39e-07 | 7.14e-06 | 194 |
| GO:006007016 | Esophagus | ESCC | canonical Wnt signaling pathway | 180/8552 | 303/18723 | 9.15e-07 | 1.17e-05 | 180 |
| Page: 1 2 |
| Pathway ID | Tissue | Disease Stage | Description | Gene Ratio | Bg Ratio | pvalue | p.adjust | qvalue | Count |
| Page: 1 |
Top |
Cell-cell communication analysis |
| Identification of potential cell-cell interactions between two cell types and their ligand-receptor pairs for different disease states |
| Ligand | Receptor | LRpair | Pathway | Tissue | Disease Stage |
| Page: 1 |
Top |
Single-cell gene regulatory network inference analysis |
| Find out the significant the regulons (TFs) and the target genes of each regulon across cell types for different disease states |
| TF | Cell Type | Tissue | Disease Stage | Target Gene | RSS | Regulon Activity |
| ∗The dot plots of a searched regulon are shown for all cell subpopulations in each disease state of each tissue based on the regulon specific score inferred using pySCENIC and by calculating the average expression. |
| Page: 1 |
Top |
Somatic mutation of malignant transformation related genes |
| Annotation of somatic variants for genes involved in malignant transformation |
| Hugo Symbol | Variant Class | Variant Classification | dbSNP RS | HGVSc | HGVSp | HGVSp Short | SWISSPROT | BIOTYPE | SIFT | PolyPhen | Tumor Sample Barcode | Tissue | Histology | Sex | Age | Stage | Therapy Types | Drugs | Outcome |
| FRMD8 | SNV | Missense_Mutation | novel | c.955N>C | p.Glu319Gln | p.E319Q | Q9BZ67 | protein_coding | deleterious(0) | probably_damaging(0.991) | TCGA-AC-A5EH-01 | Breast | breast invasive carcinoma | Female | >=65 | I/II | Unknown | Unknown | SD |
| FRMD8 | SNV | Missense_Mutation | novel | c.331N>A | p.Ala111Thr | p.A111T | Q9BZ67 | protein_coding | deleterious(0.01) | possibly_damaging(0.81) | TCGA-2W-A8YY-01 | Cervix | cervical & endocervical cancer | Female | <65 | I/II | Chemotherapy | cisplatin | CR |
| FRMD8 | SNV | Missense_Mutation | novel | c.943N>A | p.Leu315Met | p.L315M | Q9BZ67 | protein_coding | deleterious(0.04) | probably_damaging(0.996) | TCGA-2W-A8YY-01 | Cervix | cervical & endocervical cancer | Female | <65 | I/II | Chemotherapy | cisplatin | CR |
| FRMD8 | SNV | Missense_Mutation | novel | c.888N>G | p.Ile296Met | p.I296M | Q9BZ67 | protein_coding | deleterious(0) | probably_damaging(0.991) | TCGA-IR-A3LH-01 | Cervix | cervical & endocervical cancer | Female | <65 | I/II | Chemotherapy | cisplatin | CR |
| FRMD8 | insertion | In_Frame_Ins | novel | c.1330_1331insCTA | p.Gln444delinsProLys | p.Q444delinsPK | Q9BZ67 | protein_coding | TCGA-DS-A1OB-01 | Cervix | cervical & endocervical cancer | Female | <65 | I/II | Chemotherapy | carboplatin | PD | ||
| FRMD8 | SNV | Missense_Mutation | rs758310158 | c.176N>A | p.Arg59His | p.R59H | Q9BZ67 | protein_coding | tolerated(0.07) | benign(0) | TCGA-F4-6856-01 | Colorectum | colon adenocarcinoma | Male | <65 | I/II | Ancillary | leucovorin | CR |
| FRMD8 | SNV | Missense_Mutation | rs745445330 | c.739N>A | p.Glu247Lys | p.E247K | Q9BZ67 | protein_coding | tolerated(0.12) | benign(0.221) | TCGA-NH-A50T-01 | Colorectum | colon adenocarcinoma | Female | >=65 | I/II | Unknown | Unknown | SD |
| FRMD8 | SNV | Missense_Mutation | c.1103N>A | p.Cys368Tyr | p.C368Y | Q9BZ67 | protein_coding | tolerated(0.26) | probably_damaging(0.996) | TCGA-NH-A5IV-01 | Colorectum | colon adenocarcinoma | Female | >=65 | I/II | Unknown | Unknown | SD | |
| FRMD8 | SNV | Missense_Mutation | novel | c.191N>G | p.Val64Gly | p.V64G | Q9BZ67 | protein_coding | tolerated(0.26) | benign(0.196) | TCGA-AG-3726-01 | Colorectum | rectum adenocarcinoma | Female | <65 | I/II | Unknown | Unknown | SD |
| FRMD8 | SNV | Missense_Mutation | novel | c.913N>T | p.Asp305Tyr | p.D305Y | Q9BZ67 | protein_coding | deleterious(0) | probably_damaging(0.999) | TCGA-AG-3892-01 | Colorectum | rectum adenocarcinoma | Female | <65 | I/II | Unknown | Unknown | SD |
| Page: 1 2 3 4 |
Top |
Related drugs of malignant transformation related genes |
| Identification of chemicals and drugs interact with genes involved in malignant transfromation |
| (DGIdb 4.0) |
| Entrez ID | Symbol | Category | Interaction Types | Drug Claim Name | Drug Name | PMIDs |
| Page: 1 |

Copyright 2023-Present -The University of Texas Health Science Center at Houston |