
|
|||||
|
 | |
| |
| |
| |
| |
| |
|
Gene: FRMD6 |
Gene summary for FRMD6 |
| Gene information | Species | Human | Gene symbol | FRMD6 | Gene ID | 122786 |
| Gene name | FERM domain containing 6 | |
| Gene Alias | C14orf31 | |
| Cytomap | 14q22.1 | |
| Gene Type | protein-coding | GO ID | GO:0006996 | UniProtAcc | Q96NE9 |
Top |
Malignant transformation analysis |
| Identification of the aberrant gene expression in precancerous and cancerous lesions by comparing the gene expression of stem-like cells in diseased tissues with normal stem cells |
| Entrez ID | Symbol | Replicates | Species | Organ | Tissue | Adj P-value | Log2FC | Malignancy |
| 122786 | FRMD6 | CCI_1 | Human | Cervix | CC | 6.79e-28 | 2.68e+00 | 0.528 |
| 122786 | FRMD6 | CCI_2 | Human | Cervix | CC | 7.53e-15 | 1.50e+00 | 0.5249 |
| 122786 | FRMD6 | CCI_3 | Human | Cervix | CC | 1.41e-25 | 1.55e+00 | 0.516 |
| 122786 | FRMD6 | Tumor | Human | Cervix | CC | 1.35e-25 | 5.65e-01 | 0.1241 |
| 122786 | FRMD6 | sample3 | Human | Cervix | CC | 7.61e-46 | 7.70e-01 | 0.1387 |
| 122786 | FRMD6 | T3 | Human | Cervix | CC | 2.29e-43 | 7.73e-01 | 0.1389 |
| 122786 | FRMD6 | LZE4T | Human | Esophagus | ESCC | 6.49e-17 | 6.28e-01 | 0.0811 |
| 122786 | FRMD6 | LZE20T | Human | Esophagus | ESCC | 6.27e-05 | 3.15e-01 | 0.0662 |
| 122786 | FRMD6 | LZE22T | Human | Esophagus | ESCC | 1.35e-05 | 1.34e-01 | 0.068 |
| 122786 | FRMD6 | LZE24T | Human | Esophagus | ESCC | 8.62e-04 | 1.15e-01 | 0.0596 |
| 122786 | FRMD6 | P1T-E | Human | Esophagus | ESCC | 4.93e-04 | 5.74e-02 | 0.0875 |
| 122786 | FRMD6 | P2T-E | Human | Esophagus | ESCC | 1.95e-21 | 5.65e-01 | 0.1177 |
| 122786 | FRMD6 | P4T-E | Human | Esophagus | ESCC | 2.16e-16 | 3.93e-01 | 0.1323 |
| 122786 | FRMD6 | P5T-E | Human | Esophagus | ESCC | 3.83e-14 | 3.91e-01 | 0.1327 |
| 122786 | FRMD6 | P8T-E | Human | Esophagus | ESCC | 2.14e-07 | 2.61e-01 | 0.0889 |
| 122786 | FRMD6 | P9T-E | Human | Esophagus | ESCC | 6.04e-14 | 3.80e-01 | 0.1131 |
| 122786 | FRMD6 | P10T-E | Human | Esophagus | ESCC | 2.90e-22 | 6.08e-01 | 0.116 |
| 122786 | FRMD6 | P11T-E | Human | Esophagus | ESCC | 2.08e-15 | 1.09e+00 | 0.1426 |
| 122786 | FRMD6 | P12T-E | Human | Esophagus | ESCC | 2.41e-38 | 8.68e-01 | 0.1122 |
| 122786 | FRMD6 | P15T-E | Human | Esophagus | ESCC | 2.94e-26 | 7.36e-01 | 0.1149 |
| Page: 1 2 3 4 5 6 7 |
| Tissue | Expression Dynamics | Abbreviation |
| Cervix | 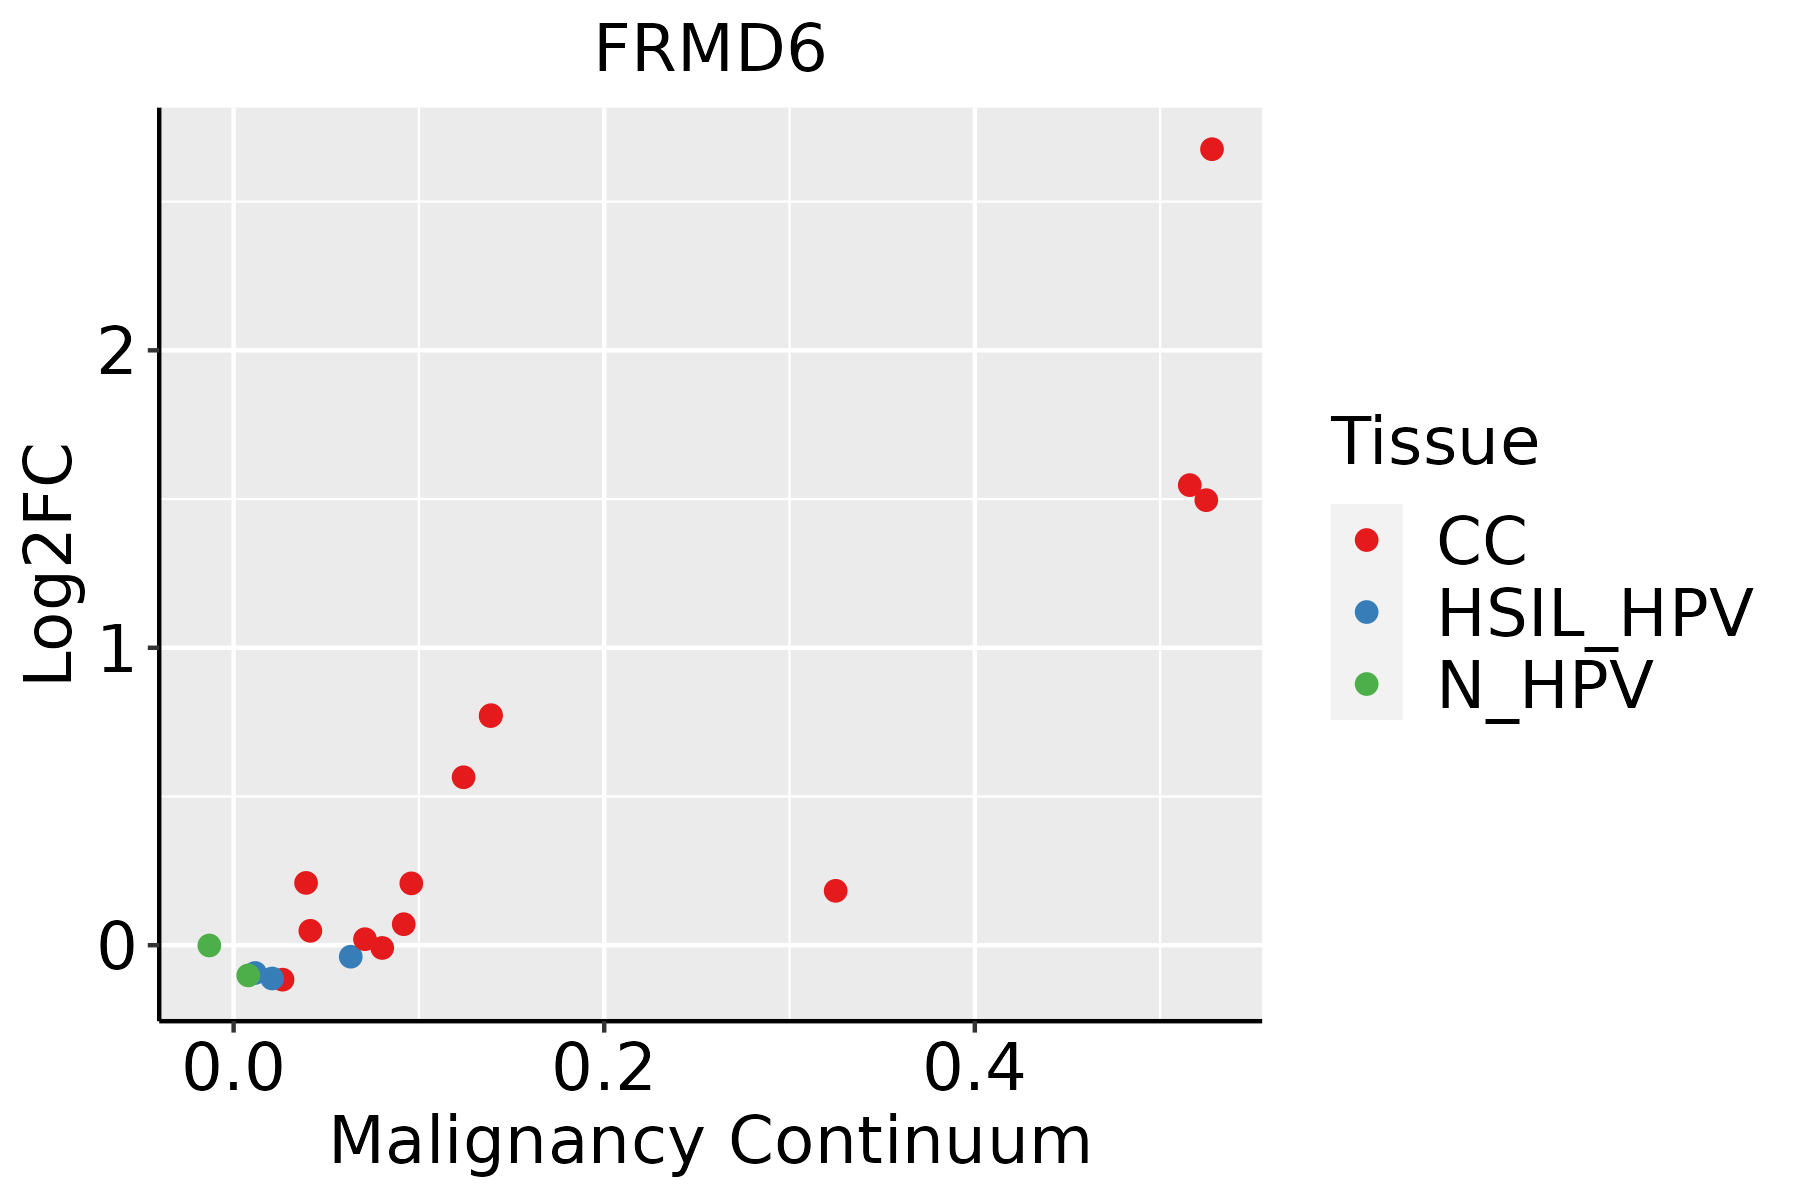 | CC: Cervix cancer |
| HSIL_HPV: HPV-infected high-grade squamous intraepithelial lesions | ||
| N_HPV: HPV-infected normal cervix | ||
| Esophagus | 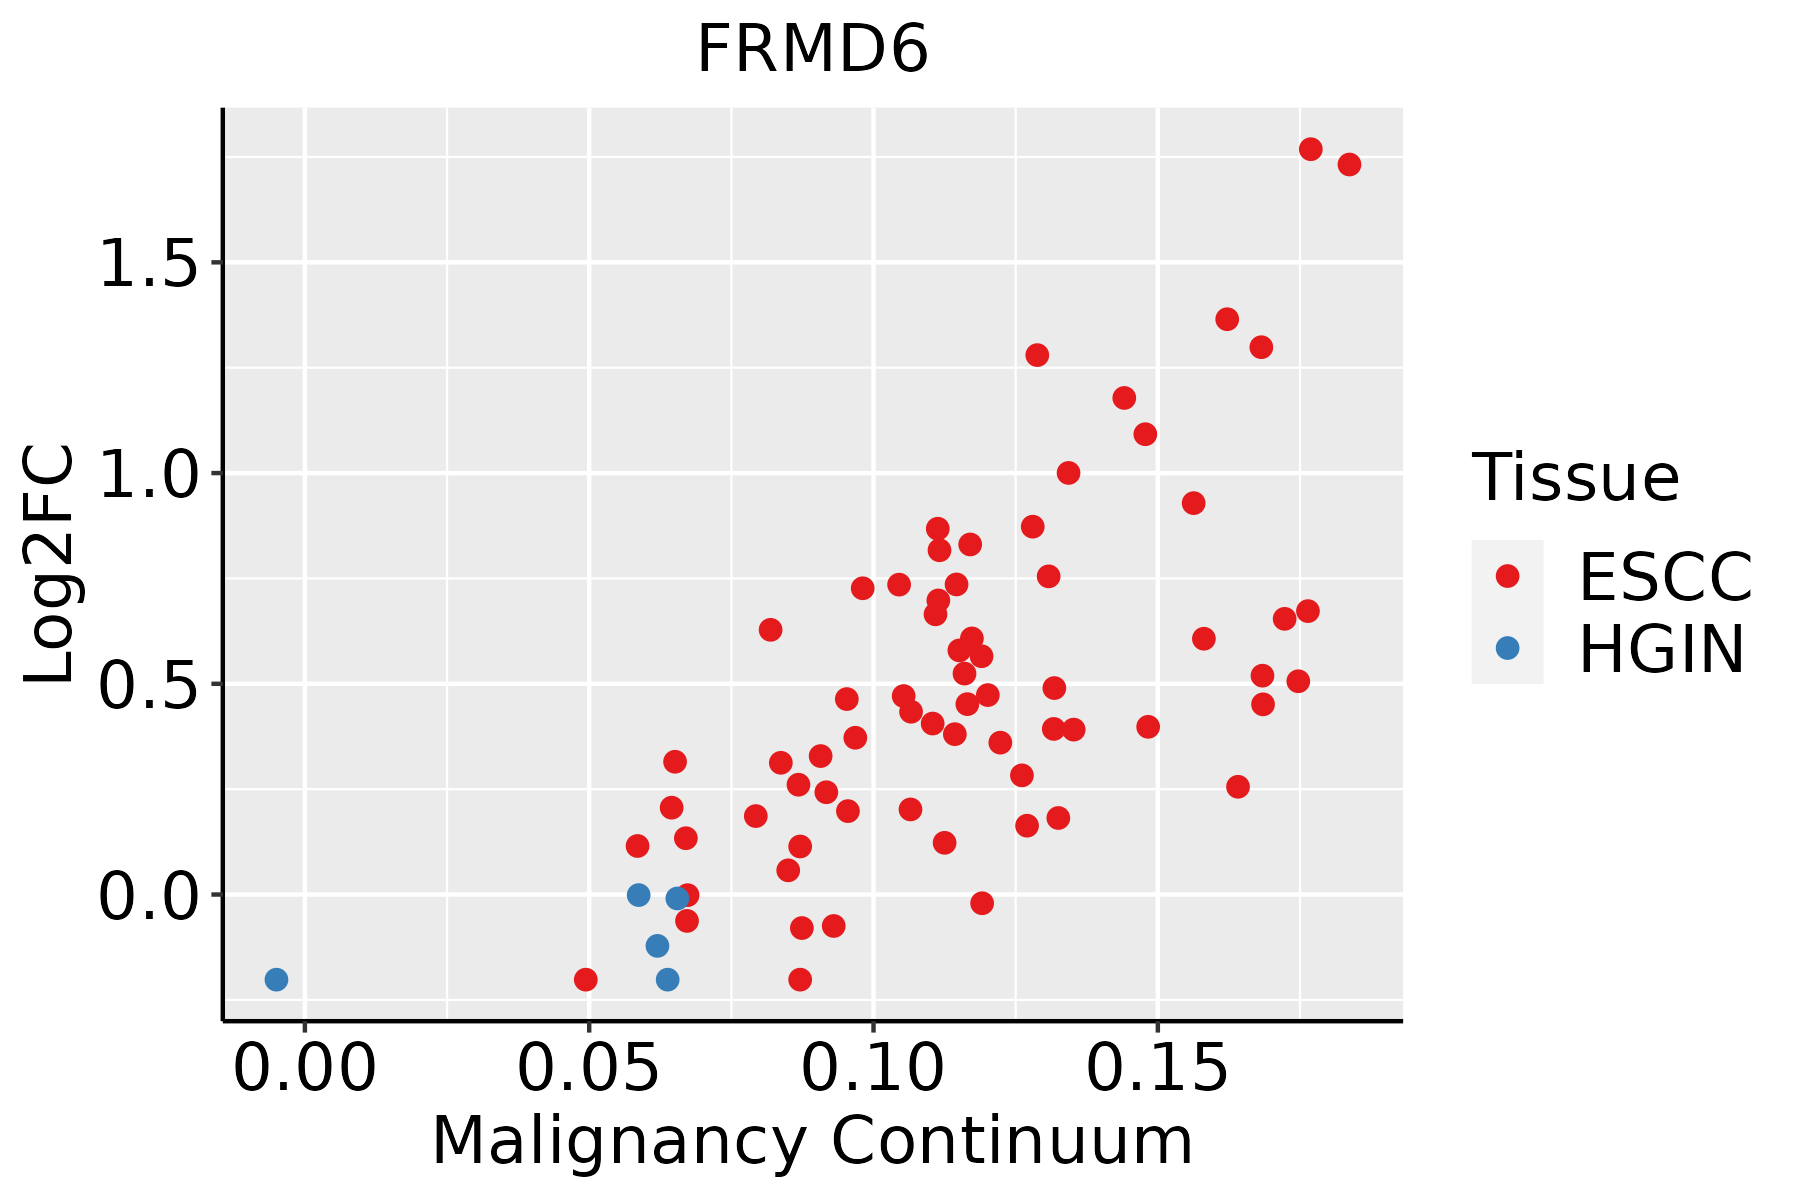 | ESCC: Esophageal squamous cell carcinoma |
| HGIN: High-grade intraepithelial neoplasias | ||
| LGIN: Low-grade intraepithelial neoplasias | ||
| Oral Cavity | 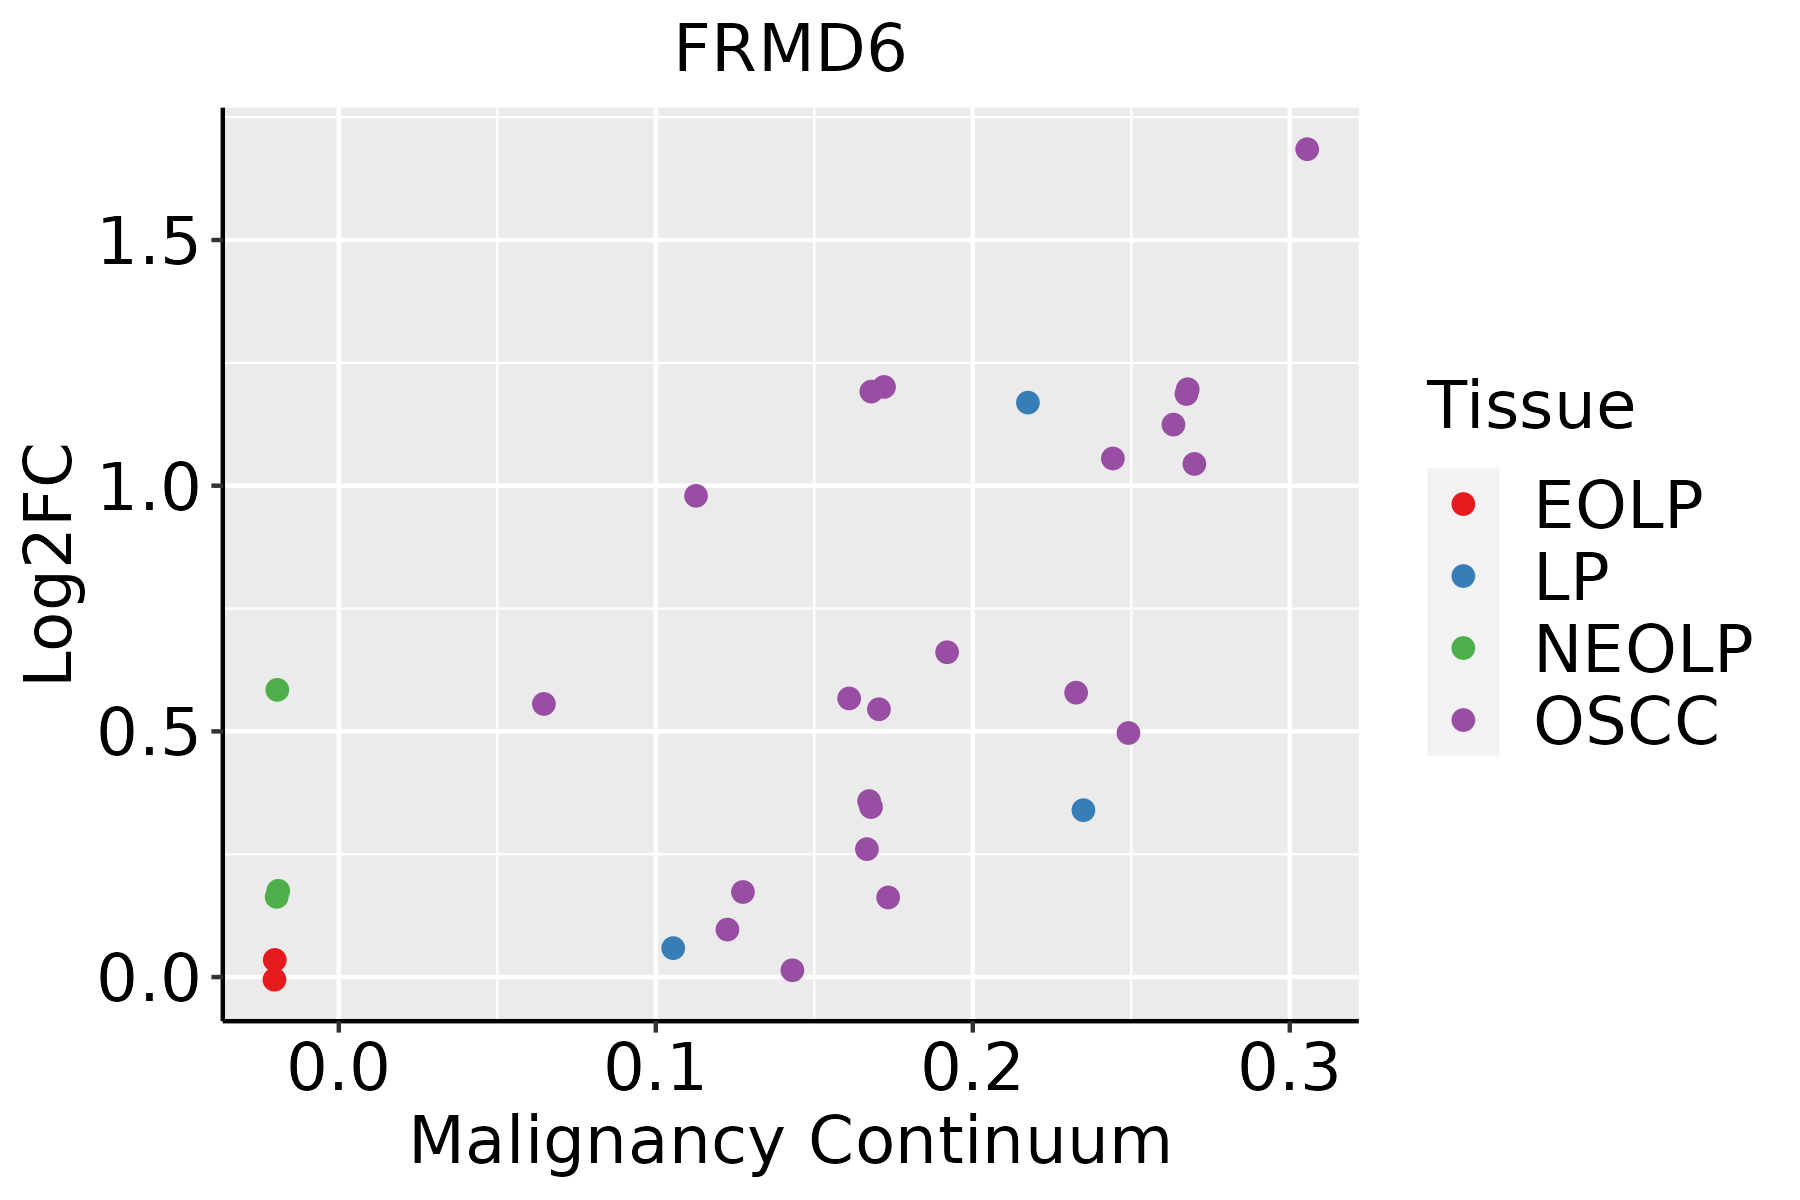 | EOLP: Erosive Oral lichen planus |
| LP: leukoplakia | ||
| NEOLP: Non-erosive oral lichen planus | ||
| OSCC: Oral squamous cell carcinoma | ||
| Prostate |  | BPH: Benign Prostatic Hyperplasia |
| Skin | 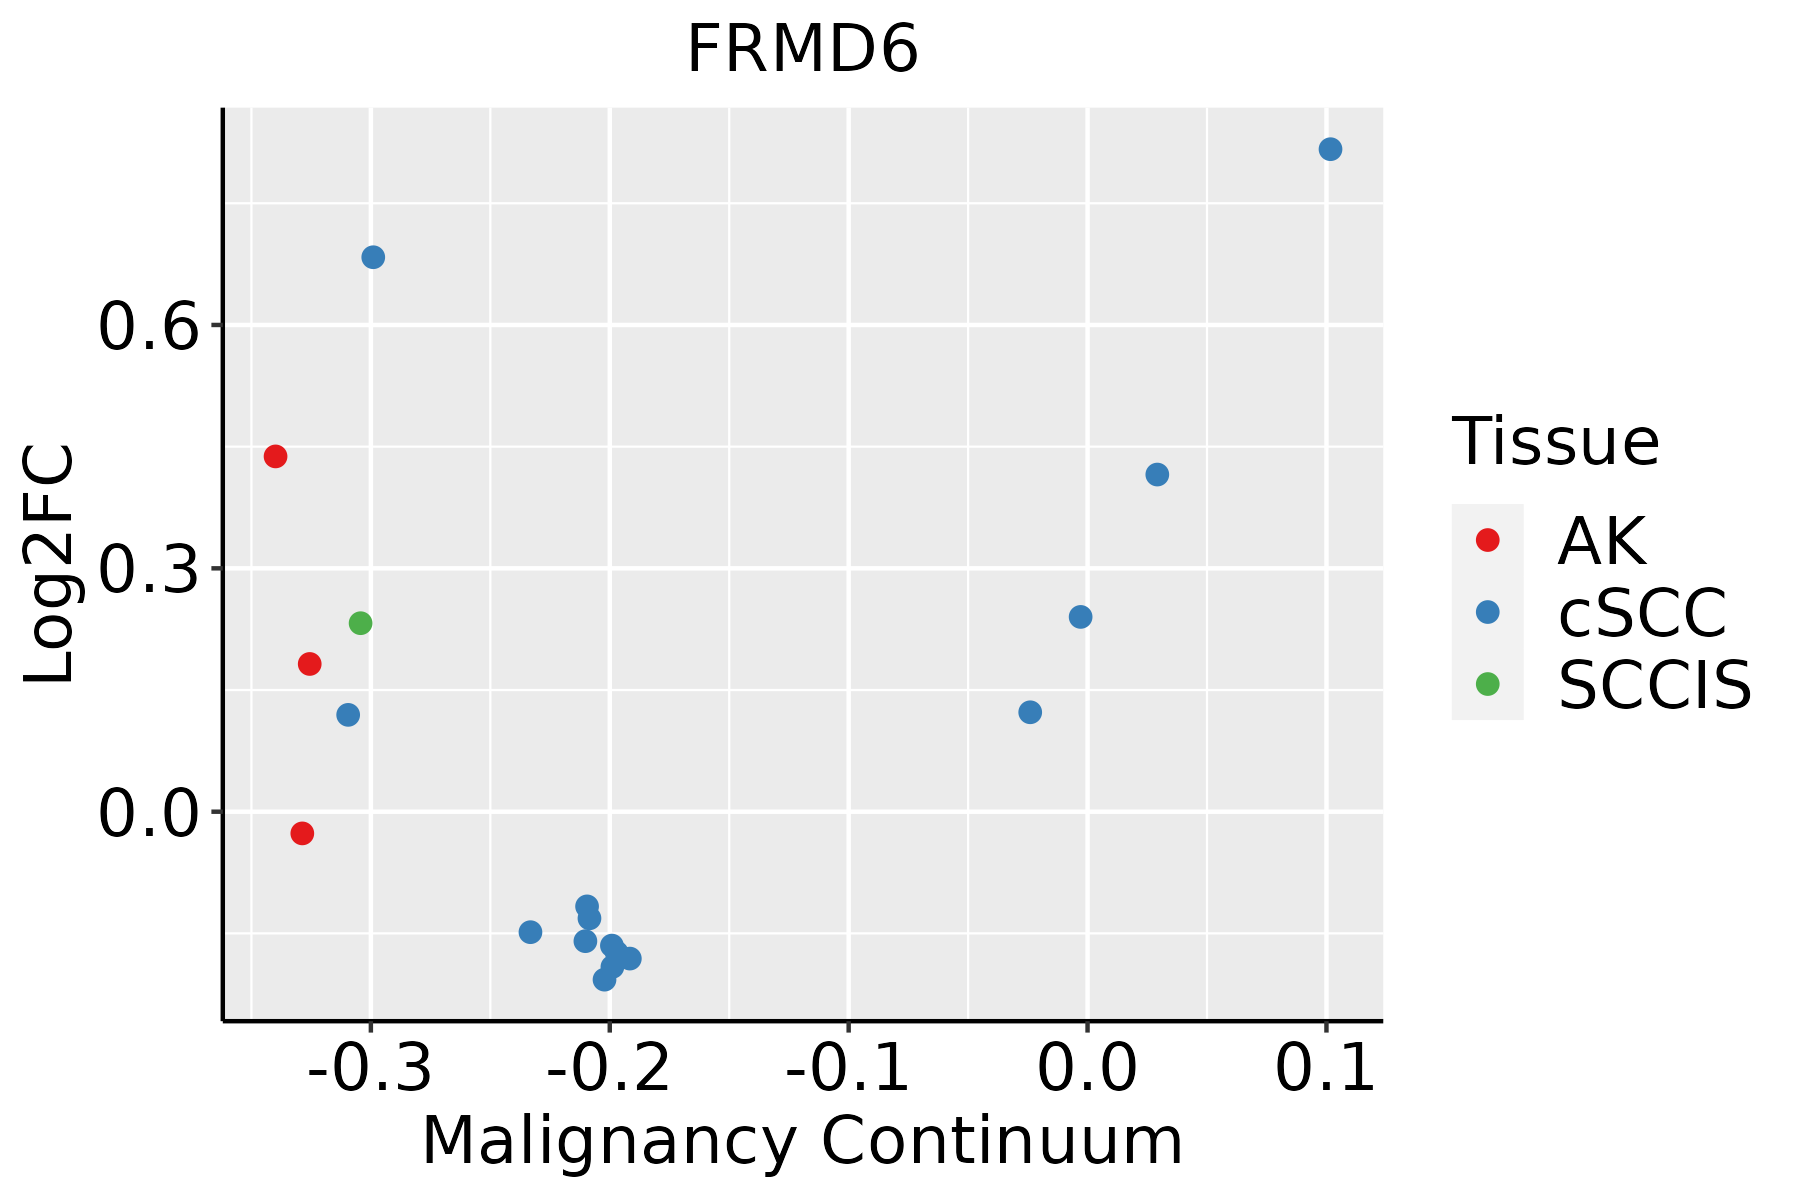 | AK: Actinic keratosis |
| cSCC: Cutaneous squamous cell carcinoma | ||
| SCCIS:squamous cell carcinoma in situ | ||
| Thyroid | 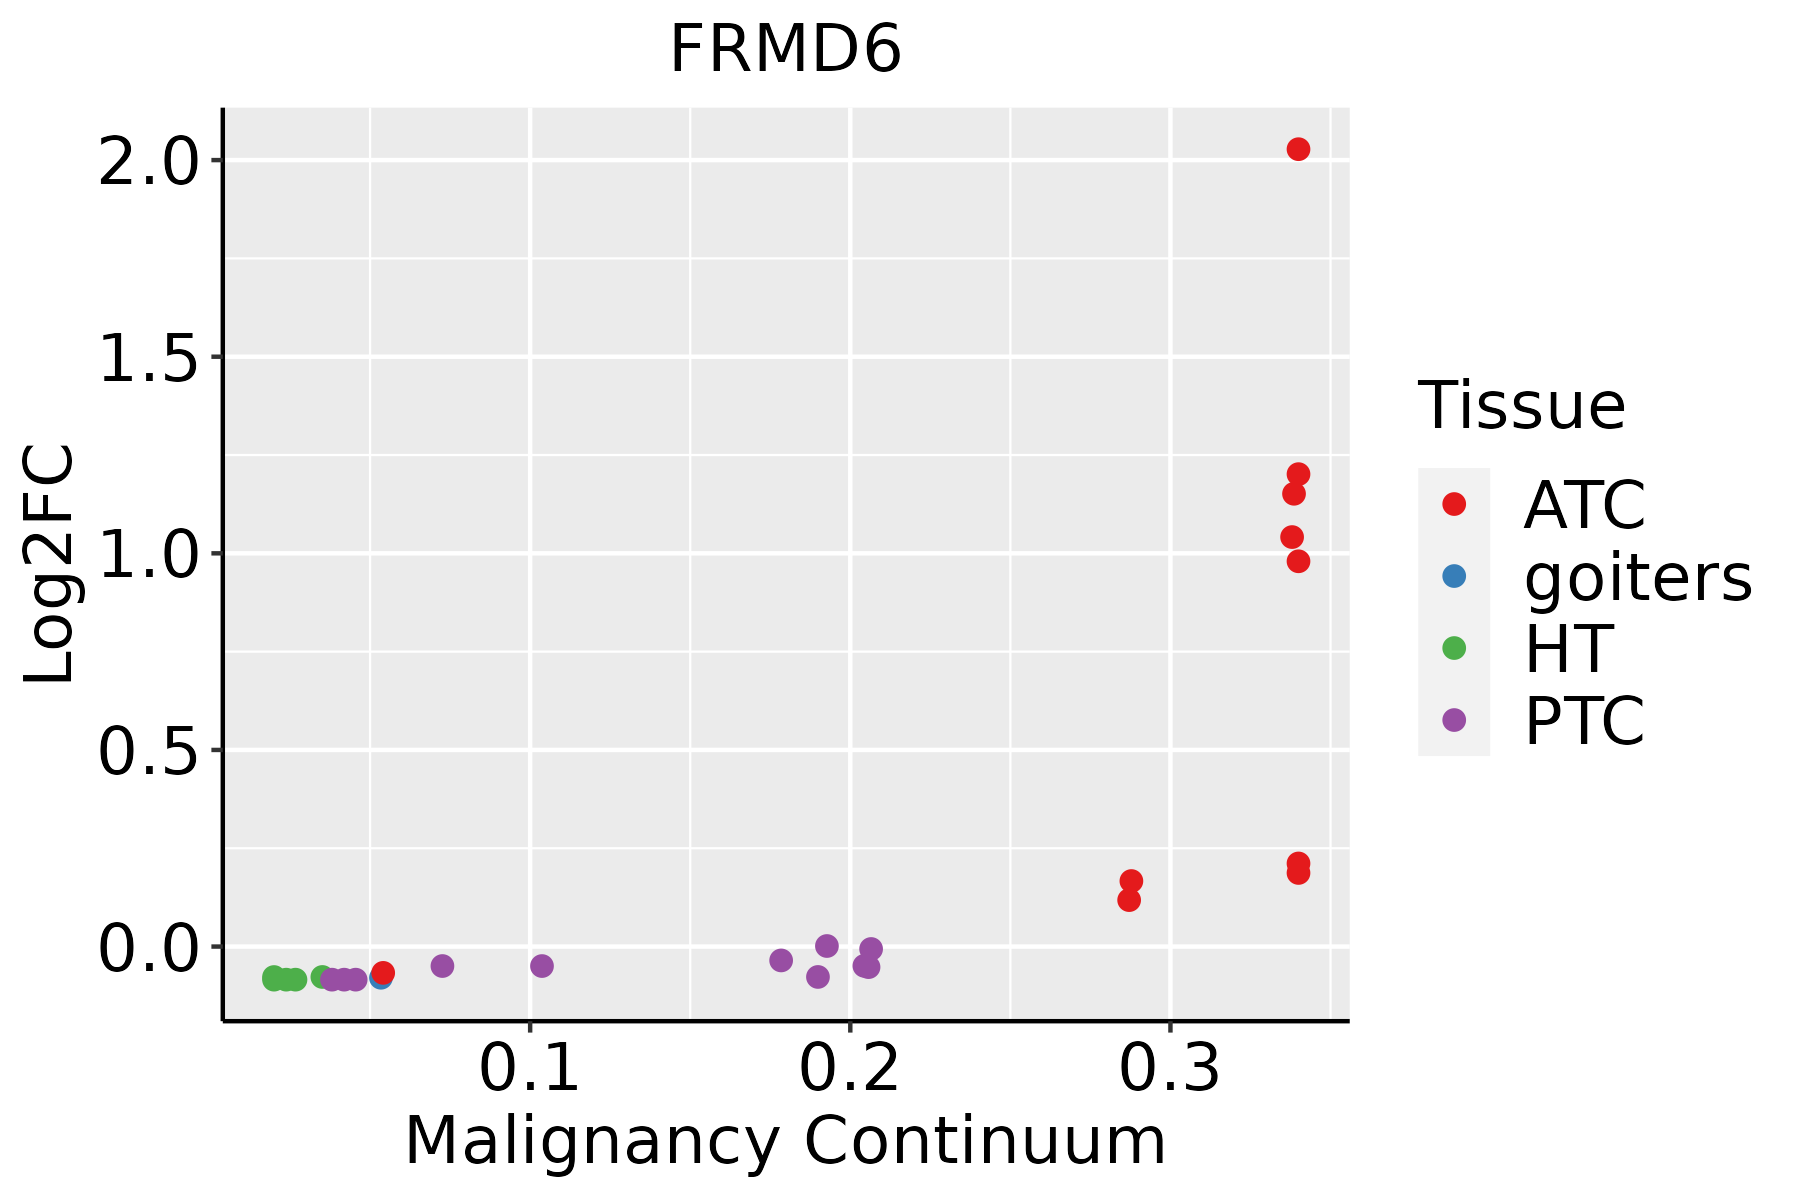 | ATC: Anaplastic thyroid cancer |
| HT: Hashimoto's thyroiditis | ||
| PTC: Papillary thyroid cancer |
| ∗log2FC in expression of this searched gene in stem-like cells from each diseased tissue sample relative to stem-like cells in normal samples in each tissue plotted against the malignancy continuum. Samples are colored based on if they are from different disease stage. |
Top |
Malignant transformation related pathway analysis |
| Find out the enriched GO biological processes and KEGG pathways involved in transition from healthy to precancer to cancer |
| Tissue | Disease Stage | Enriched GO biological Processes |
| Colorectum | AD |  |
| Colorectum | SER |  |
| Colorectum | MSS |  |
| Colorectum | MSI-H |  |
| Colorectum | FAP |  |
| ∗Top 15 enriched GO BP terms are showed in the bar plot of each disease state in each tissue. Each row represents a significant GO biological process which is colored according to the -log10(p.adjust). |
| Page: 1 2 3 4 5 6 7 8 9 |
| GO ID | Tissue | Disease Stage | Description | Gene Ratio | Bg Ratio | pvalue | p.adjust | Count |
| GO:00310329 | Cervix | CC | actomyosin structure organization | 43/2311 | 196/18723 | 1.11e-04 | 1.40e-03 | 43 |
| GO:003103219 | Esophagus | ESCC | actomyosin structure organization | 108/8552 | 196/18723 | 4.86e-03 | 1.88e-02 | 108 |
| GO:003103217 | Oral cavity | OSCC | actomyosin structure organization | 93/7305 | 196/18723 | 9.63e-03 | 3.41e-02 | 93 |
| GO:003103224 | Oral cavity | NEOLP | actomyosin structure organization | 44/2005 | 196/18723 | 1.42e-06 | 3.58e-05 | 44 |
| GO:003103215 | Prostate | BPH | actomyosin structure organization | 63/3107 | 196/18723 | 5.78e-08 | 1.57e-06 | 63 |
| GO:003103216 | Prostate | Tumor | actomyosin structure organization | 63/3246 | 196/18723 | 2.94e-07 | 6.72e-06 | 63 |
| GO:003103220 | Skin | AK | actomyosin structure organization | 37/1910 | 196/18723 | 1.67e-04 | 1.94e-03 | 37 |
| GO:0031032110 | Thyroid | PTC | actomyosin structure organization | 91/5968 | 196/18723 | 1.35e-05 | 1.45e-04 | 91 |
| GO:003103226 | Thyroid | ATC | actomyosin structure organization | 98/6293 | 196/18723 | 1.44e-06 | 1.77e-05 | 98 |
| Page: 1 |
| Pathway ID | Tissue | Disease Stage | Description | Gene Ratio | Bg Ratio | pvalue | p.adjust | qvalue | Count |
| hsa043908 | Cervix | CC | Hippo signaling pathway | 40/1267 | 157/8465 | 3.64e-04 | 1.82e-03 | 1.07e-03 | 40 |
| hsa0439013 | Cervix | CC | Hippo signaling pathway | 40/1267 | 157/8465 | 3.64e-04 | 1.82e-03 | 1.07e-03 | 40 |
| hsa0439018 | Esophagus | ESCC | Hippo signaling pathway | 92/4205 | 157/8465 | 1.46e-02 | 3.31e-02 | 1.69e-02 | 92 |
| hsa0439019 | Esophagus | ESCC | Hippo signaling pathway | 92/4205 | 157/8465 | 1.46e-02 | 3.31e-02 | 1.69e-02 | 92 |
| hsa0439016 | Oral cavity | OSCC | Hippo signaling pathway | 86/3704 | 157/8465 | 3.30e-03 | 8.24e-03 | 4.20e-03 | 86 |
| hsa0439017 | Oral cavity | OSCC | Hippo signaling pathway | 86/3704 | 157/8465 | 3.30e-03 | 8.24e-03 | 4.20e-03 | 86 |
| hsa0439025 | Oral cavity | NEOLP | Hippo signaling pathway | 35/1112 | 157/8465 | 9.91e-04 | 4.85e-03 | 3.05e-03 | 35 |
| hsa0439035 | Oral cavity | NEOLP | Hippo signaling pathway | 35/1112 | 157/8465 | 9.91e-04 | 4.85e-03 | 3.05e-03 | 35 |
| hsa0439010 | Prostate | BPH | Hippo signaling pathway | 52/1718 | 157/8465 | 9.93e-05 | 6.00e-04 | 3.71e-04 | 52 |
| hsa0439015 | Prostate | BPH | Hippo signaling pathway | 52/1718 | 157/8465 | 9.93e-05 | 6.00e-04 | 3.71e-04 | 52 |
| hsa0439024 | Prostate | Tumor | Hippo signaling pathway | 54/1791 | 157/8465 | 7.52e-05 | 5.30e-04 | 3.28e-04 | 54 |
| hsa0439034 | Prostate | Tumor | Hippo signaling pathway | 54/1791 | 157/8465 | 7.52e-05 | 5.30e-04 | 3.28e-04 | 54 |
| Page: 1 |
Top |
Cell-cell communication analysis |
| Identification of potential cell-cell interactions between two cell types and their ligand-receptor pairs for different disease states |
| Ligand | Receptor | LRpair | Pathway | Tissue | Disease Stage |
| Page: 1 |
Top |
Single-cell gene regulatory network inference analysis |
| Find out the significant the regulons (TFs) and the target genes of each regulon across cell types for different disease states |
| TF | Cell Type | Tissue | Disease Stage | Target Gene | RSS | Regulon Activity |
| ∗The dot plots of a searched regulon are shown for all cell subpopulations in each disease state of each tissue based on the regulon specific score inferred using pySCENIC and by calculating the average expression. |
| Page: 1 |
Top |
Somatic mutation of malignant transformation related genes |
| Annotation of somatic variants for genes involved in malignant transformation |
| Hugo Symbol | Variant Class | Variant Classification | dbSNP RS | HGVSc | HGVSp | HGVSp Short | SWISSPROT | BIOTYPE | SIFT | PolyPhen | Tumor Sample Barcode | Tissue | Histology | Sex | Age | Stage | Therapy Types | Drugs | Outcome |
| FRMD6 | SNV | Missense_Mutation | c.1026N>T | p.Glu342Asp | p.E342D | Q96NE9 | protein_coding | deleterious(0.05) | benign(0.101) | TCGA-A2-A04R-01 | Breast | breast invasive carcinoma | Female | <65 | I/II | Chemotherapy | taxol | SD | |
| FRMD6 | SNV | Missense_Mutation | c.294N>T | p.Trp98Cys | p.W98C | Q96NE9 | protein_coding | tolerated(0.07) | possibly_damaging(0.67) | TCGA-A2-A25A-01 | Breast | breast invasive carcinoma | Female | <65 | I/II | Unspecific | Cytoxan | SD | |
| FRMD6 | SNV | Missense_Mutation | novel | c.1309N>T | p.Gly437Trp | p.G437W | Q96NE9 | protein_coding | deleterious(0) | probably_damaging(1) | TCGA-AN-A046-01 | Breast | breast invasive carcinoma | Female | >=65 | I/II | Unknown | Unknown | SD |
| FRMD6 | SNV | Missense_Mutation | c.638N>G | p.Ser213Cys | p.S213C | Q96NE9 | protein_coding | tolerated(0.06) | benign(0.179) | TCGA-C5-A1BQ-01 | Cervix | cervical & endocervical cancer | Female | >=65 | III/IV | Chemotherapy | cisplatin | CR | |
| FRMD6 | SNV | Missense_Mutation | c.638N>G | p.Ser213Cys | p.S213C | Q96NE9 | protein_coding | tolerated(0.06) | benign(0.179) | TCGA-C5-A3HL-01 | Cervix | cervical & endocervical cancer | Female | >=65 | I/II | Unknown | Unknown | SD | |
| FRMD6 | SNV | Missense_Mutation | rs748065189 | c.1595N>A | p.Arg532Gln | p.R532Q | Q96NE9 | protein_coding | tolerated(0.27) | benign(0.277) | TCGA-EA-A410-01 | Cervix | cervical & endocervical cancer | Female | <65 | I/II | Unknown | Unknown | SD |
| FRMD6 | SNV | Missense_Mutation | c.515N>G | p.His172Arg | p.H172R | Q96NE9 | protein_coding | deleterious(0.02) | benign(0.03) | TCGA-EA-A5FO-01 | Cervix | cervical & endocervical cancer | Female | <65 | I/II | Unknown | Unknown | SD | |
| FRMD6 | SNV | Missense_Mutation | rs374236968 | c.688G>A | p.Ala230Thr | p.A230T | Q96NE9 | protein_coding | tolerated(0.1) | benign(0.059) | TCGA-A6-2684-01 | Colorectum | colon adenocarcinoma | Female | >=65 | I/II | Unknown | Unknown | PD |
| FRMD6 | SNV | Missense_Mutation | rs747022006 | c.737N>T | p.Ser246Leu | p.S246L | Q96NE9 | protein_coding | deleterious(0.02) | benign(0.149) | TCGA-A6-5662-01 | Colorectum | colon adenocarcinoma | Male | <65 | I/II | Chemotherapy | oxaliplatin | PD |
| FRMD6 | SNV | Missense_Mutation | c.904T>C | p.Tyr302His | p.Y302H | Q96NE9 | protein_coding | deleterious(0) | probably_damaging(0.987) | TCGA-A6-5665-01 | Colorectum | colon adenocarcinoma | Female | >=65 | I/II | Unknown | Unknown | PD |
| Page: 1 2 3 4 5 6 7 8 9 |
Top |
Related drugs of malignant transformation related genes |
| Identification of chemicals and drugs interact with genes involved in malignant transfromation |
| (DGIdb 4.0) |
| Entrez ID | Symbol | Category | Interaction Types | Drug Claim Name | Drug Name | PMIDs |
| Page: 1 |

Copyright 2023-Present -The University of Texas Health Science Center at Houston |