Schematic overview of the cellular and molecular mechanisms involved in the cancer progression, including the proposed cellular and molecular mechanisms in cancer cells trajectory. AT1: alveolar type 1 cells; AT2: alveolar type 2 cells; AAH: atypical adenomatous hyperplasia; AIS: adenocarcinoma in situ; MIA: minimally invasive adenocarcinoma; IA: invasive adenocarcinoma; EMT: epithelial-mesenchymal transition

Home

Download

Statistics

Help

Contact

Center for Computational Systems Medicine
leaf

Gene summary

leaf

Malignant transformation analysis

leaf

Malignant transformation related pathway analysis

leaf

Cell-cell communication analysis

leaf

Single-cell gene regulatory network inference analysis

leaf

Somatic mutation of malignant transformation related genes

leaf

Related drugs of malignant transformation related genes

Gene: FRMD4B

Gene summary for FRMD4B

check button Gene summary.

Gene informationSpeciesHuman
Gene symbol

FRMD4B

Gene ID

23150

Gene nameFERM domain containing 4B
Gene Alias6030440G05Rik
Cytomap3p14.1
Gene Typeprotein-coding
GO ID

GO:0007163

UniProtAcc

B3KNA2


Top

Malignant transformation analysis

check button Identification of the aberrant gene expression in precancerous and cancerous lesions by comparing the gene expression of stem-like cells in diseased tissues with normal stem cells
check button Malignant transformation involving gene list.
Entrez IDSymbolReplicatesSpeciesOrganTissueAdj P-valueLog2FCMalignancy
23150FRMD4BLZE4THumanEsophagusESCC3.80e-117.17e-010.0811
23150FRMD4BLZE5THumanEsophagusESCC1.61e-029.53e-020.0514
23150FRMD4BLZE7THumanEsophagusESCC6.26e-033.51e-010.0667
23150FRMD4BLZE8THumanEsophagusESCC9.93e-047.32e-020.067
23150FRMD4BLZE24THumanEsophagusESCC2.32e-023.21e-010.0596
23150FRMD4BP1T-EHumanEsophagusESCC1.03e-063.57e-010.0875
23150FRMD4BP2T-EHumanEsophagusESCC3.93e-275.81e-010.1177
23150FRMD4BP4T-EHumanEsophagusESCC1.23e-135.90e-010.1323
23150FRMD4BP5T-EHumanEsophagusESCC1.00e-103.07e-010.1327
23150FRMD4BP8T-EHumanEsophagusESCC1.81e-133.05e-010.0889
23150FRMD4BP9T-EHumanEsophagusESCC4.41e-125.08e-010.1131
23150FRMD4BP10T-EHumanEsophagusESCC8.32e-275.88e-010.116
23150FRMD4BP11T-EHumanEsophagusESCC8.22e-083.14e-010.1426
23150FRMD4BP12T-EHumanEsophagusESCC2.20e-367.43e-010.1122
23150FRMD4BP15T-EHumanEsophagusESCC5.72e-093.00e-010.1149
23150FRMD4BP16T-EHumanEsophagusESCC3.02e-161.45e-010.1153
23150FRMD4BP17T-EHumanEsophagusESCC3.30e-032.57e-010.1278
23150FRMD4BP20T-EHumanEsophagusESCC9.10e-048.93e-020.1124
23150FRMD4BP21T-EHumanEsophagusESCC1.88e-103.19e-010.1617
23150FRMD4BP22T-EHumanEsophagusESCC4.48e-19-2.31e-020.1236
Page: 1 2 3 4 5 6 7 

check button Transcriptomic changes along malignancy continuum.
TissueExpression DynamicsAbbreviation
EsophagusThe image shows the transcriptomic changes along malignancy continuum.log2FC in expression of this searched gene in stem-like cells from each diseased tissue sample relative to stem-like cells in normal samples in each tissue plotted against the malignancy continuum. Samples are colored based on if they are from different disease stage.
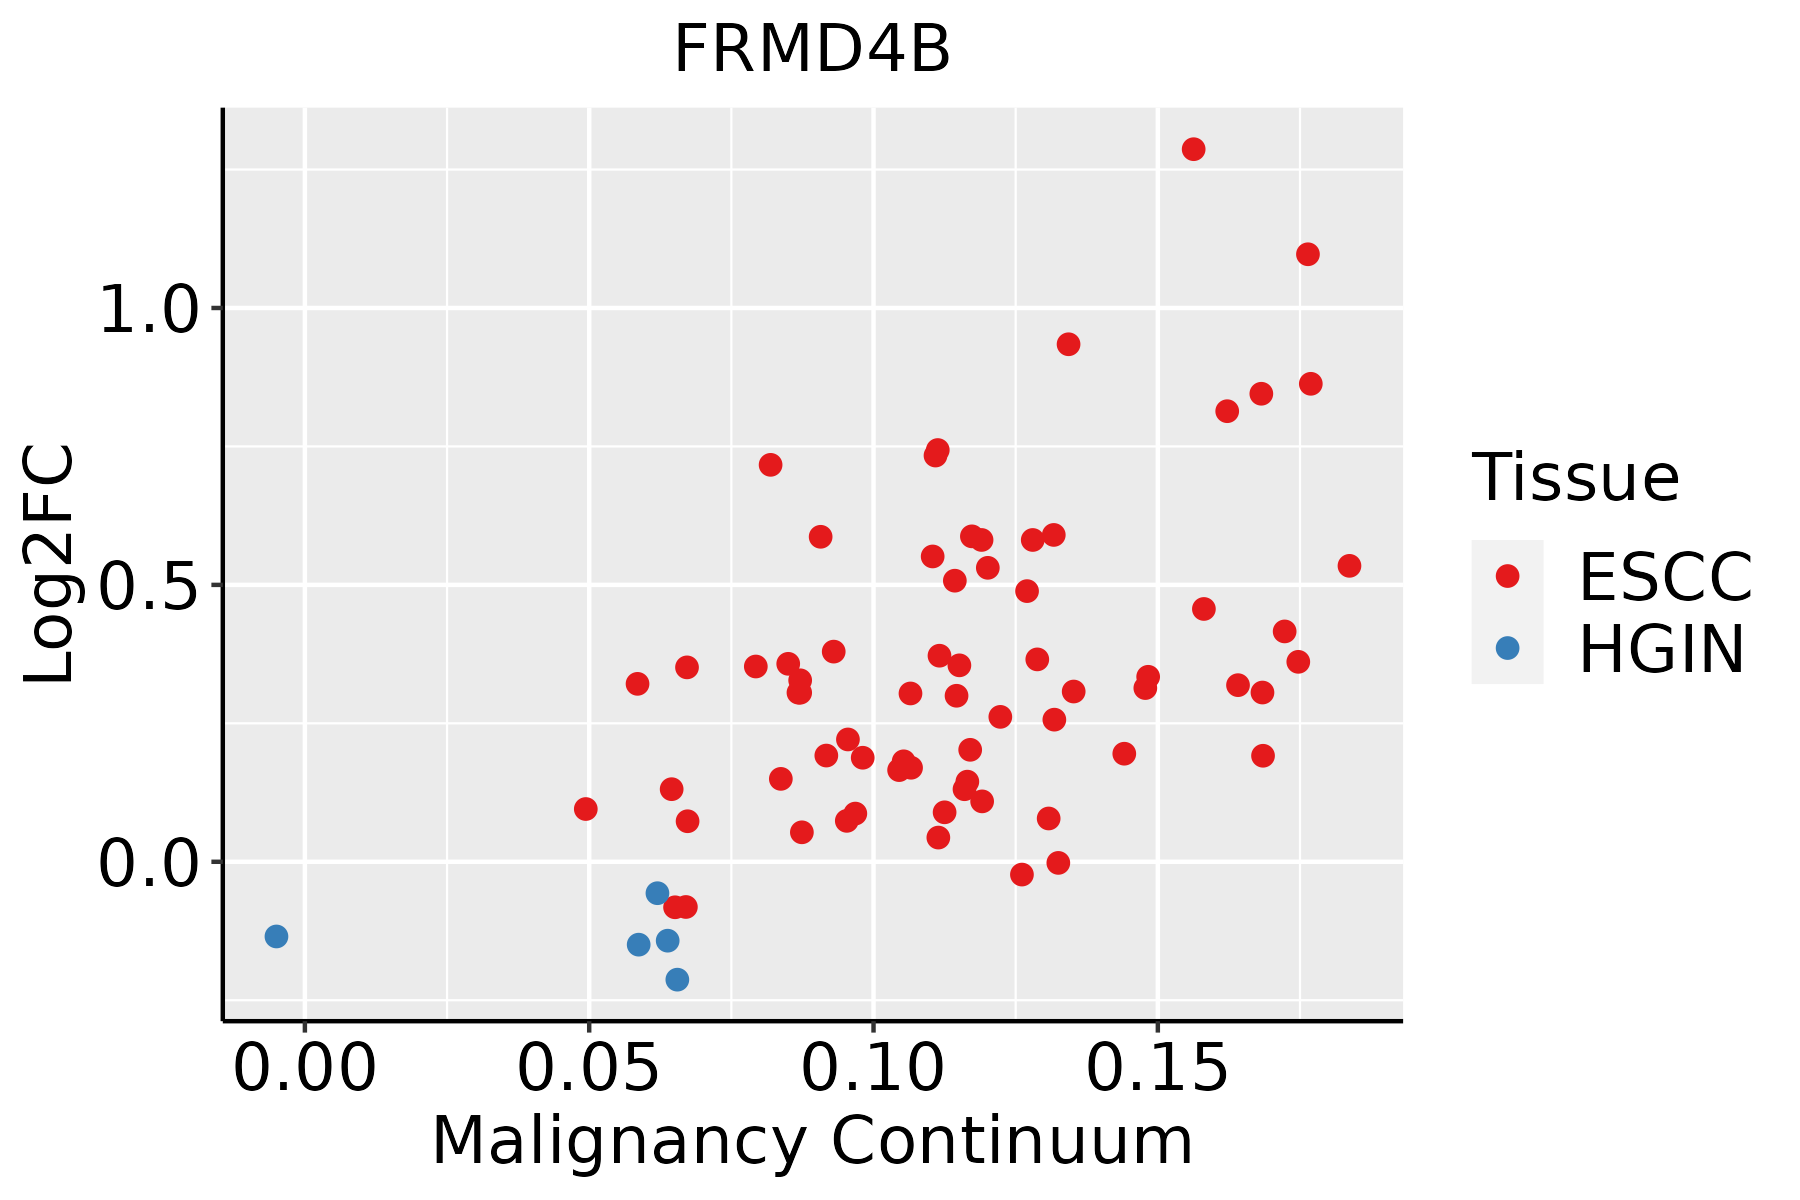
ESCC: Esophageal squamous cell carcinoma
HGIN: High-grade intraepithelial neoplasias
LGIN: Low-grade intraepithelial neoplasias
LiverThe image shows the transcriptomic changes along malignancy continuum.log2FC in expression of this searched gene in stem-like cells from each diseased tissue sample relative to stem-like cells in normal samples in each tissue plotted against the malignancy continuum. Samples are colored based on if they are from different disease stage.
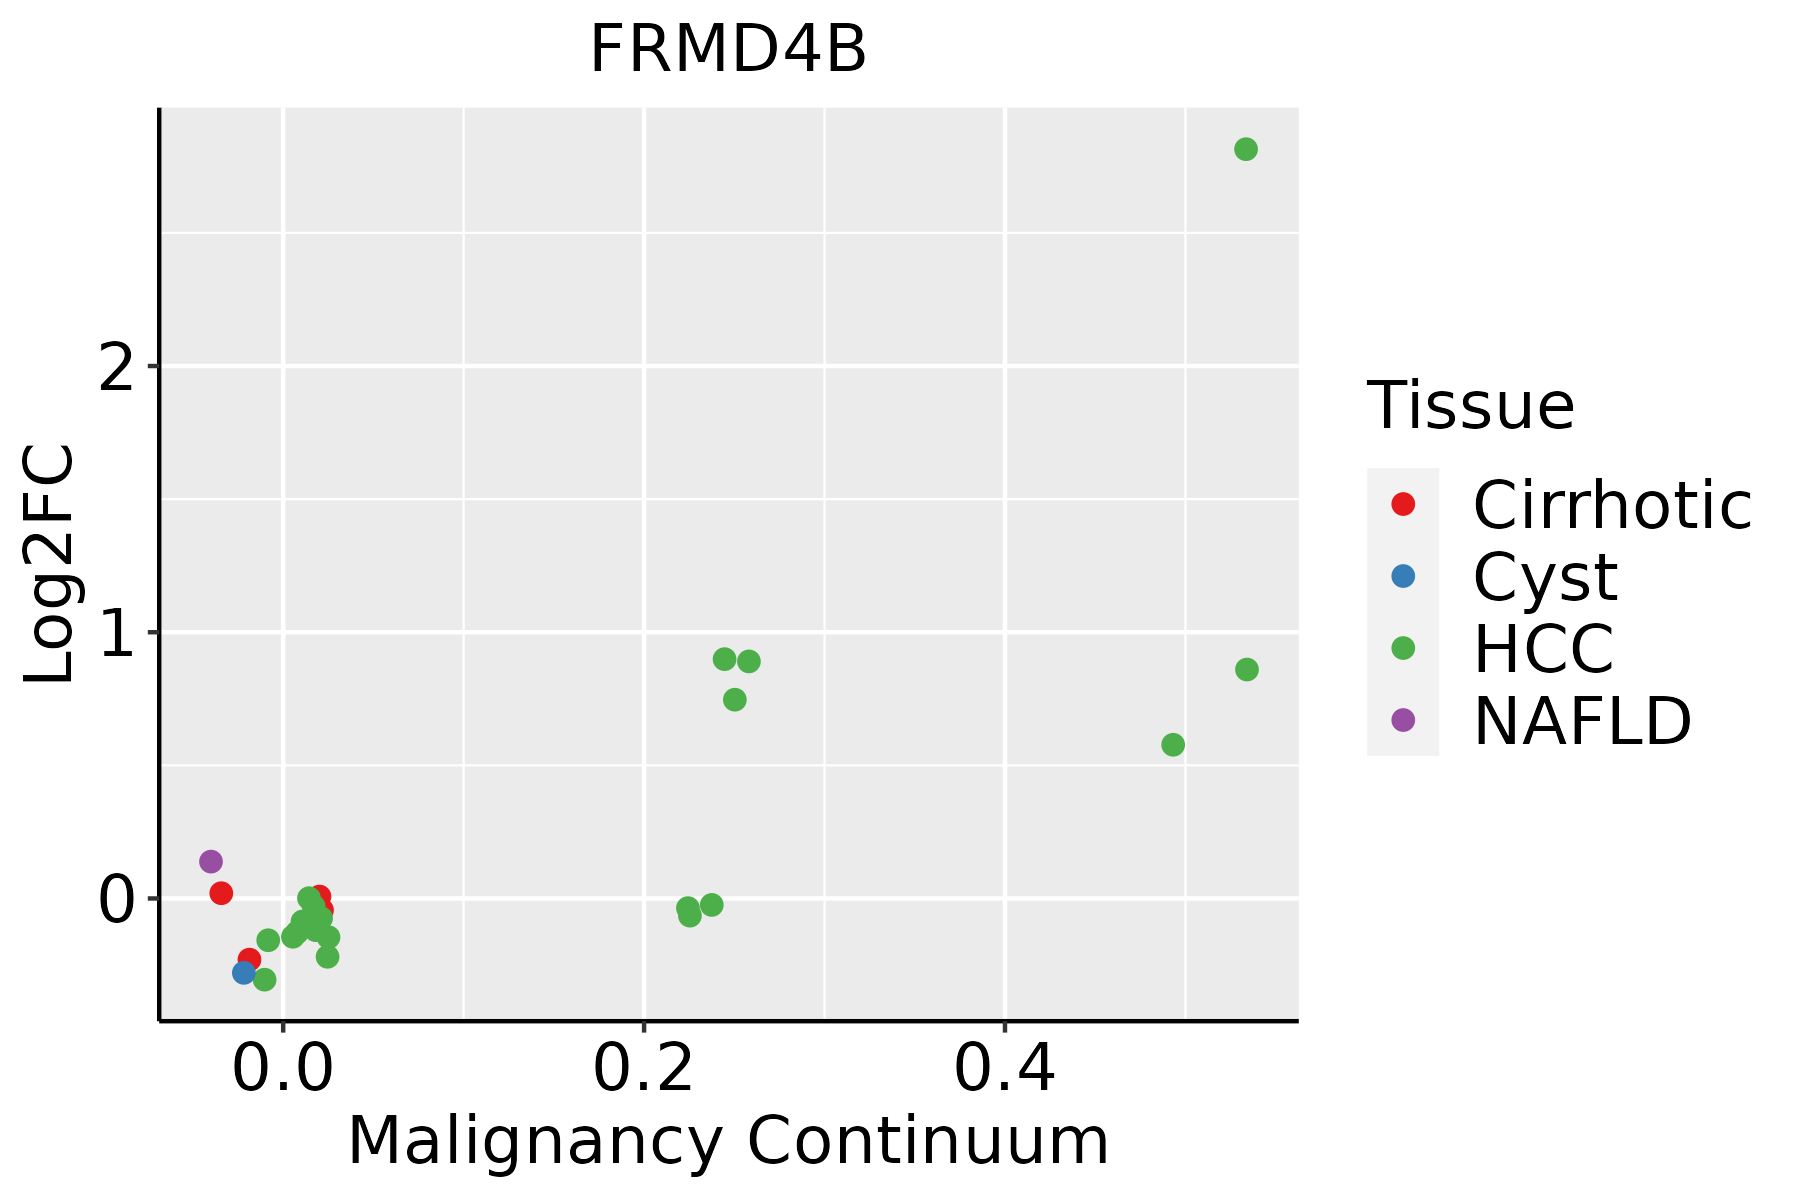
HCC: Hepatocellular carcinoma
NAFLD: Non-alcoholic fatty liver disease
LungThe image shows the transcriptomic changes along malignancy continuum.log2FC in expression of this searched gene in stem-like cells from each diseased tissue sample relative to stem-like cells in normal samples in each tissue plotted against the malignancy continuum. Samples are colored based on if they are from different disease stage.
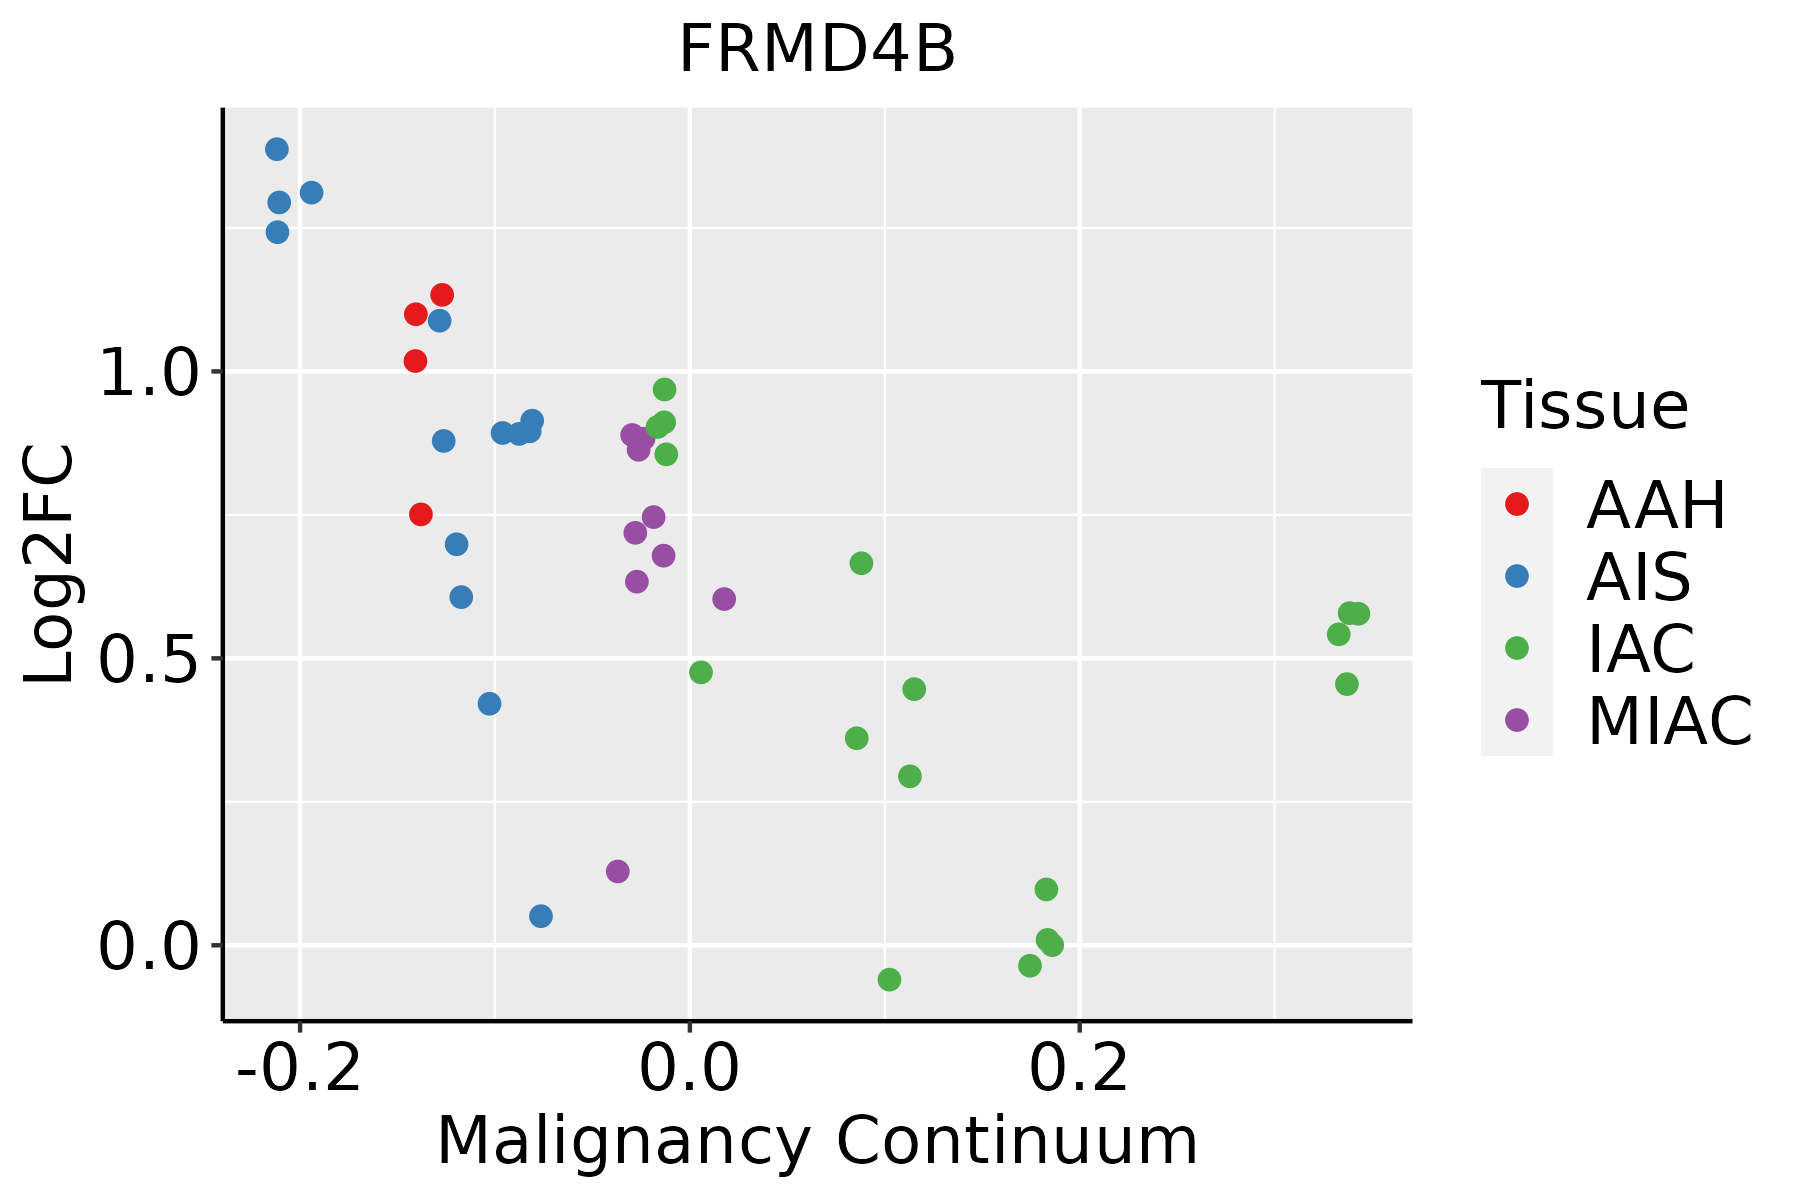
AAH: Atypical adenomatous hyperplasia
AIS: Adenocarcinoma in situ
IAC: Invasive lung adenocarcinoma
MIA: Minimally invasive adenocarcinoma
Oral CavityThe image shows the transcriptomic changes along malignancy continuum.log2FC in expression of this searched gene in stem-like cells from each diseased tissue sample relative to stem-like cells in normal samples in each tissue plotted against the malignancy continuum. Samples are colored based on if they are from different disease stage.
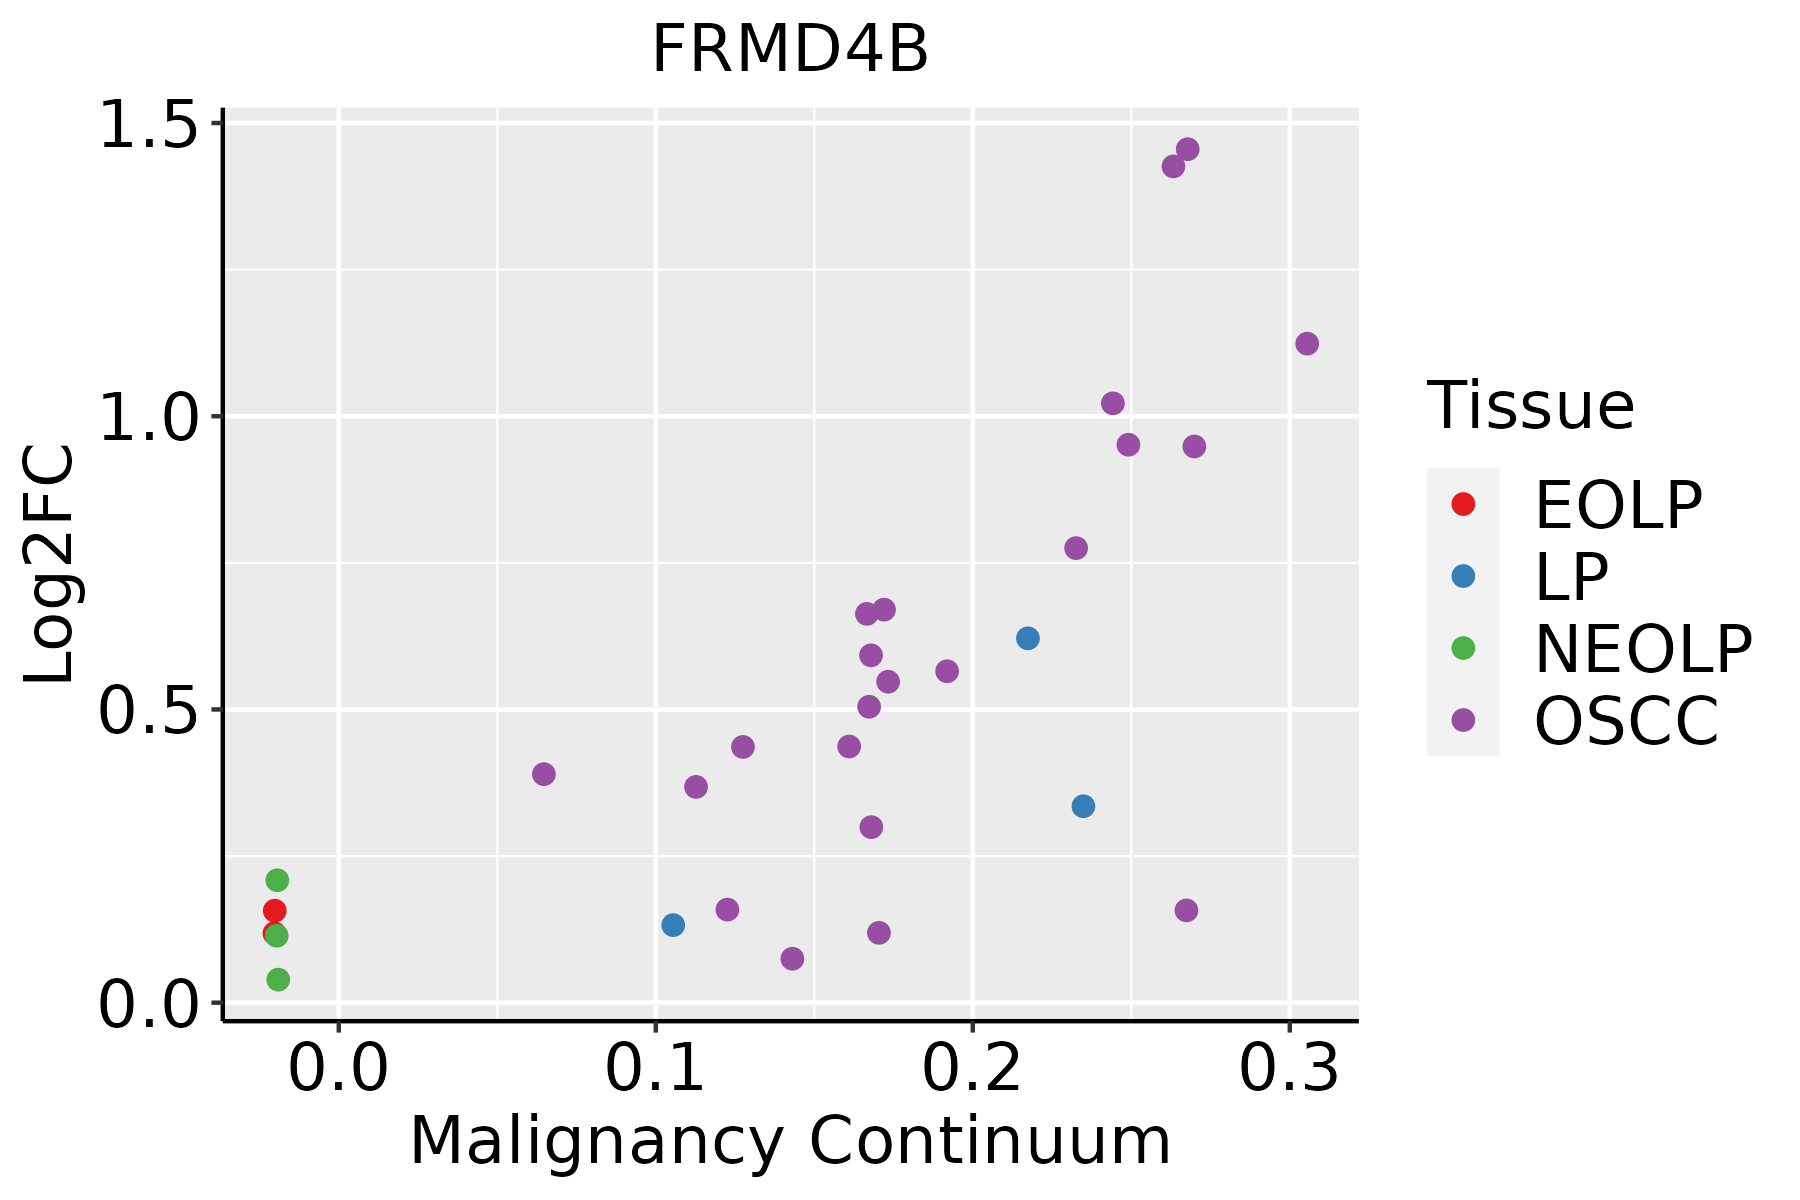
EOLP: Erosive Oral lichen planus
LP: leukoplakia
NEOLP: Non-erosive oral lichen planus
OSCC: Oral squamous cell carcinoma
ProstateThe image shows the transcriptomic changes along malignancy continuum.log2FC in expression of this searched gene in stem-like cells from each diseased tissue sample relative to stem-like cells in normal samples in each tissue plotted against the malignancy continuum. Samples are colored based on if they are from different disease stage.
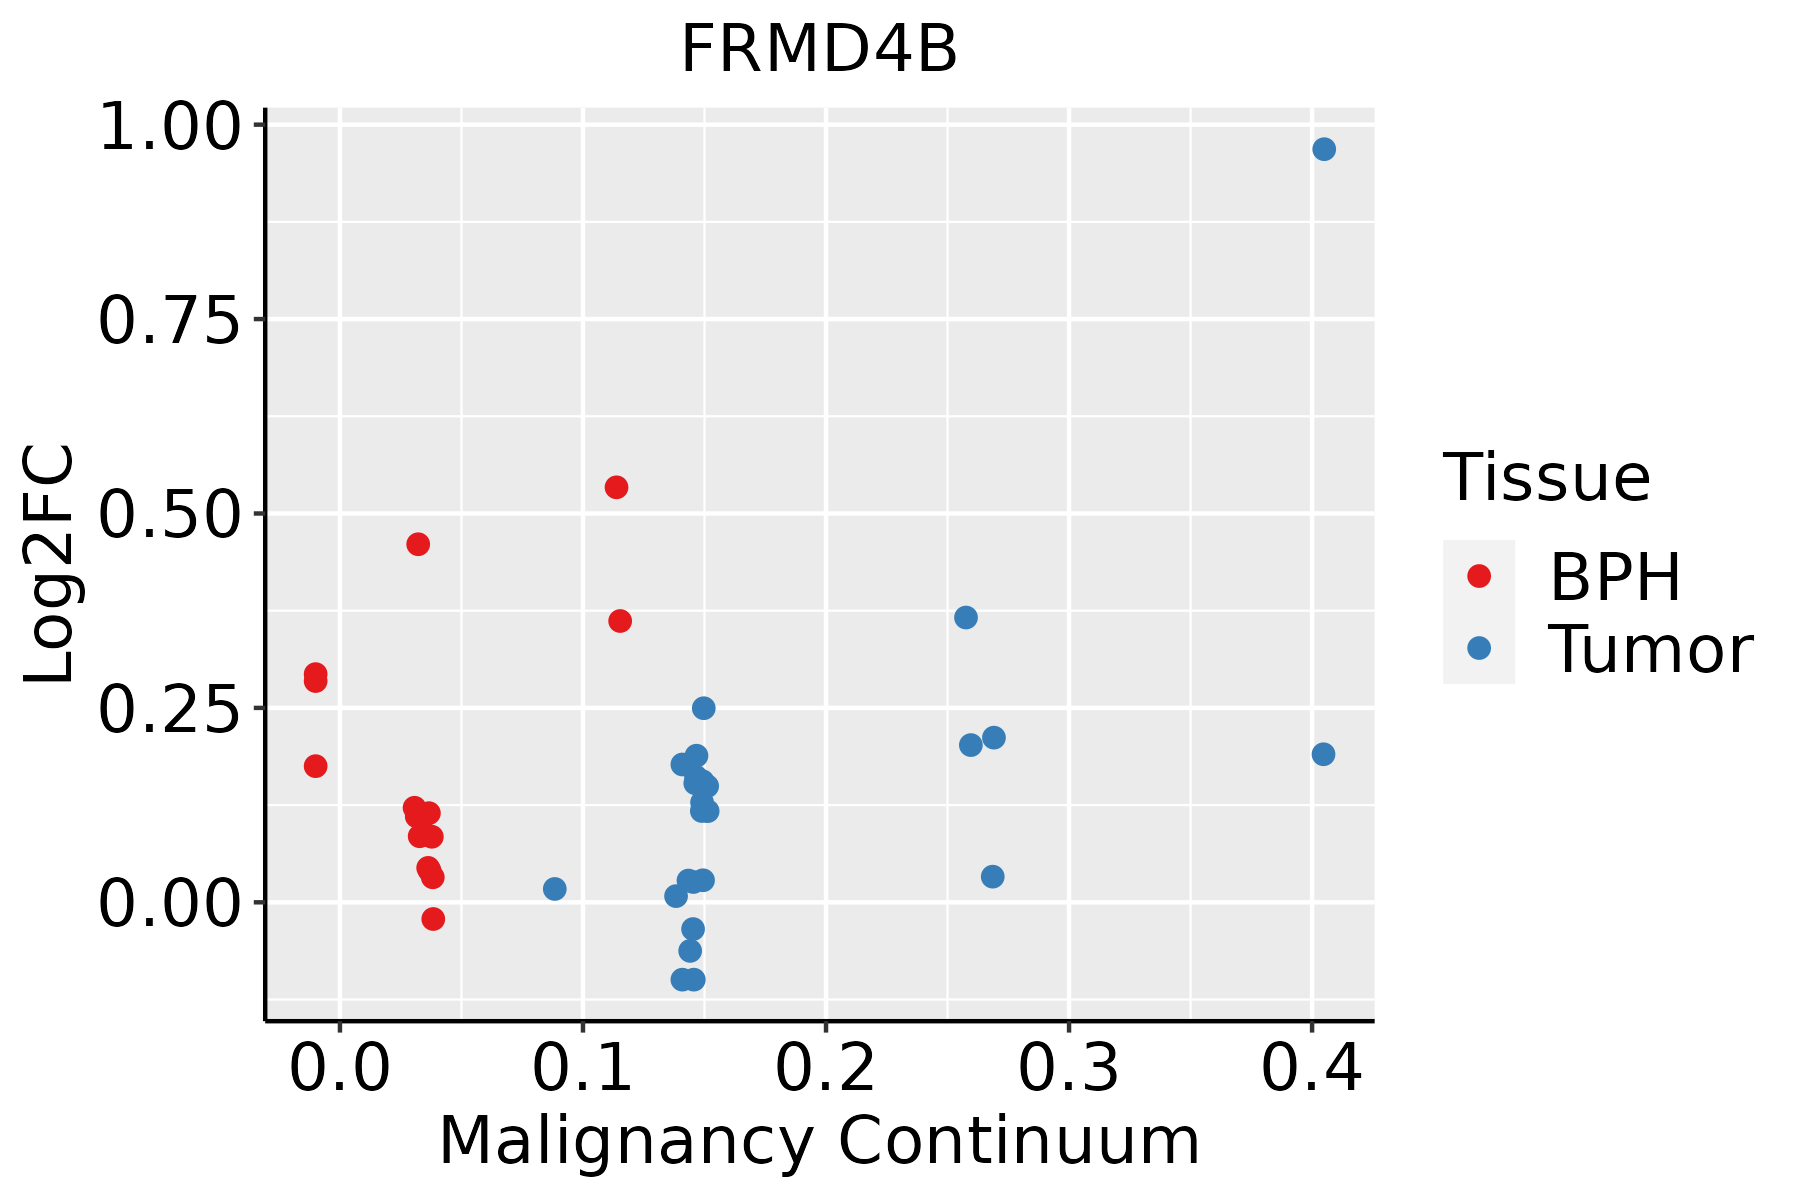
BPH: Benign Prostatic Hyperplasia
SkinThe image shows the transcriptomic changes along malignancy continuum.log2FC in expression of this searched gene in stem-like cells from each diseased tissue sample relative to stem-like cells in normal samples in each tissue plotted against the malignancy continuum. Samples are colored based on if they are from different disease stage.
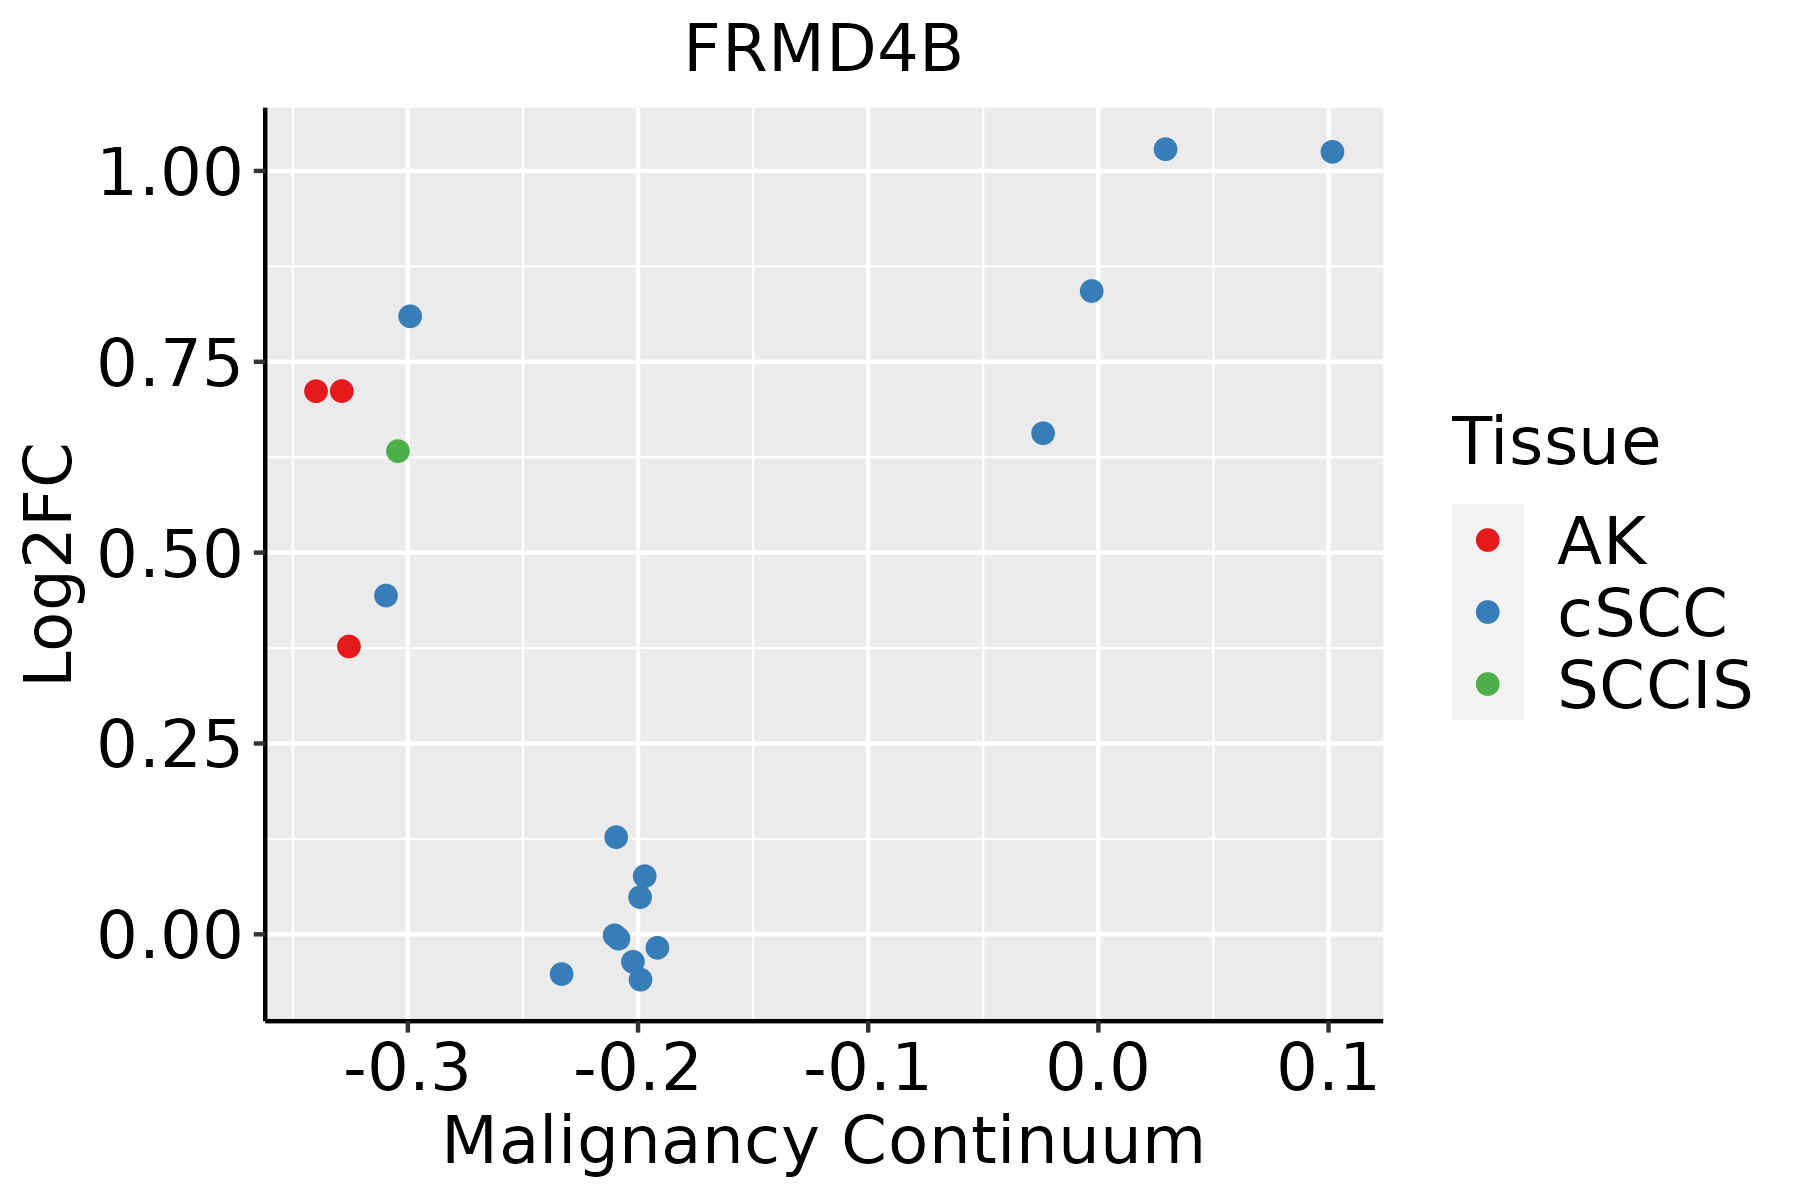
AK: Actinic keratosis
cSCC: Cutaneous squamous cell carcinoma
SCCIS:squamous cell carcinoma in situ
ThyroidThe image shows the transcriptomic changes along malignancy continuum.log2FC in expression of this searched gene in stem-like cells from each diseased tissue sample relative to stem-like cells in normal samples in each tissue plotted against the malignancy continuum. Samples are colored based on if they are from different disease stage.ATC: Anaplastic thyroid cancer
HT: Hashimoto's thyroiditis
PTC: Papillary thyroid cancer
∗log2FC in expression of this searched gene in stem-like cells from each diseased tissue sample relative to stem-like cells in normal samples in each tissue plotted against the malignancy continuum. Samples are colored based on if they are from different disease stage.

Top

Malignant transformation related pathway analysis

check buttonFind out the enriched GO biological processes and KEGG pathways involved in transition from healthy to precancer to cancer
check button Figure of enriched GO biological processes.
TissueDisease StageEnriched GO biological Processes
ColorectumADGO analysis - Figure of enriched GO biological processes: Top 15 enriched GO BP terms are showed in the bar plot of each disease state in each tissue. Each row represents a significant GO biological process which is colored according to the -log10(p.adjust).
ColorectumSERGO analysis - Figure of enriched GO biological processes: Top 15 enriched GO BP terms are showed in the bar plot of each disease state in each tissue. Each row represents a significant GO biological process which is colored according to the -log10(p.adjust).
ColorectumMSSGO analysis - Figure of enriched GO biological processes: Top 15 enriched GO BP terms are showed in the bar plot of each disease state in each tissue. Each row represents a significant GO biological process which is colored according to the -log10(p.adjust).
ColorectumMSI-HGO analysis - Figure of enriched GO biological processes: Top 15 enriched GO BP terms are showed in the bar plot of each disease state in each tissue. Each row represents a significant GO biological process which is colored according to the -log10(p.adjust).
ColorectumFAPGO analysis - Figure of enriched GO biological processes: Top 15 enriched GO BP terms are showed in the bar plot of each disease state in each tissue. Each row represents a significant GO biological process which is colored according to the -log10(p.adjust).
∗Top 15 enriched GO BP terms are showed in the bar plot of each disease state in each tissue. Each row represents a significant GO biological process which is colored according to the -log10(p.adjust).
Page: 1 2 3 4 5 6 7 8 9 

check button Enriched GO biological processes.
GO IDTissueDisease StageDescriptionGene RatioBg Ratiopvaluep.adjustCount
GO:000716320EsophagusESCCestablishment or maintenance of cell polarity143/8552218/187232.05e-094.65e-08143
GO:003001018EsophagusESCCestablishment of cell polarity96/8552143/187231.69e-072.67e-0696
GO:009016216EsophagusESCCestablishment of epithelial cell polarity25/855231/187237.13e-055.38e-0425
GO:000716312LiverCirrhoticestablishment or maintenance of cell polarity82/4634218/187231.55e-052.11e-0482
GO:00901625LiverCirrhoticestablishment of epithelial cell polarity14/463431/187231.05e-024.65e-0214
GO:003001012LiverCirrhoticestablishment of cell polarity48/4634143/187231.09e-024.79e-0248
GO:000716322LiverHCCestablishment or maintenance of cell polarity133/7958218/187232.48e-085.73e-07133
GO:003001022LiverHCCestablishment of cell polarity82/7958143/187232.38e-041.79e-0382
GO:00071637LungIACestablishment or maintenance of cell polarity61/2061218/187233.10e-123.07e-0961
GO:00300107LungIACestablishment of cell polarity46/2061143/187237.70e-124.27e-0946
GO:00901626LungIACestablishment of epithelial cell polarity11/206131/187232.91e-044.72e-0311
GO:000716313LungAISestablishment or maintenance of cell polarity56/1849218/187231.31e-116.13e-0956
GO:003001013LungAISestablishment of cell polarity42/1849143/187235.03e-111.95e-0842
GO:009016212LungAISestablishment of epithelial cell polarity11/184931/187231.10e-042.57e-0311
GO:000716323LungAAHestablishment or maintenance of cell polarity24/613218/187232.21e-071.01e-0424
GO:003001023LungAAHestablishment of cell polarity17/613143/187234.53e-061.22e-0317
GO:009016222LungAAHestablishment of epithelial cell polarity6/61331/187234.40e-041.92e-026
GO:003001031LungMIACestablishment of cell polarity27/967143/187234.16e-094.27e-0627
GO:000716332LungMIACestablishment or maintenance of cell polarity34/967218/187237.70e-094.94e-0634
GO:009016231LungMIACestablishment of epithelial cell polarity7/96731/187238.47e-041.83e-027
Page: 1 2 3 

check button Enriched KEGG pathways.
Pathway IDTissueDisease StageDescriptionGene RatioBg Ratiopvaluep.adjustqvalueCount
Page: 1 

Top

Cell-cell communication analysis

check buttonIdentification of potential cell-cell interactions between two cell types and their ligand-receptor pairs for different disease states
LigandReceptorLRpairPathwayTissueDisease Stage
Page: 1 

Top

Single-cell gene regulatory network inference analysis

check buttonFind out the significant the regulons (TFs) and the target genes of each regulon across cell types for different disease states
TFCell TypeTissueDisease StageTarget GeneRSSRegulon Activity
∗The dot plots of a searched regulon are shown for all cell subpopulations in each disease state of each tissue based on the regulon specific score inferred using pySCENIC and by calculating the average expression.
Page: 1 

Top

Somatic mutation of malignant transformation related genes

check buttonAnnotation of somatic variants for genes involved in malignant transformation
Hugo SymbolVariant ClassVariant ClassificationdbSNP RSHGVScHGVSpHGVSp ShortSWISSPROTBIOTYPESIFTPolyPhenTumor Sample BarcodeTissueHistologySexAgeStageTherapy TypesDrugsOutcome
FRMD4BSNVMissense_Mutationnovelc.1336G>Ap.Glu446Lysp.E446KQ9Y2L6protein_codingtolerated(0.19)benign(0.318)TCGA-5L-AAT1-01Breastbreast invasive carcinomaFemale<65III/IVHormone TherapyletrozolSD
FRMD4BSNVMissense_Mutationnovelc.3027N>Ap.Asn1009Lysp.N1009KQ9Y2L6protein_codingtolerated_low_confidence(0.25)benign(0.006)TCGA-AC-A3YI-01Breastbreast invasive carcinomaFemale>=65III/IVChemotherapycytoxanCR
FRMD4BSNVMissense_Mutationc.2498A>Gp.Tyr833Cysp.Y833CQ9Y2L6protein_codingdeleterious(0)probably_damaging(0.999)TCGA-B6-A0IH-01Breastbreast invasive carcinomaFemale>=65III/IVUnknownUnknownSD
FRMD4BSNVMissense_Mutationc.1456N>Cp.Lys486Glnp.K486QQ9Y2L6protein_codingdeleterious(0.02)possibly_damaging(0.455)TCGA-D8-A140-01Breastbreast invasive carcinomaFemale<65I/IIChemotherapydoxorubicin+cyclophosphamidSD
FRMD4BSNVMissense_Mutationc.2550G>Cp.Gln850Hisp.Q850HQ9Y2L6protein_codingtolerated(0.54)benign(0)TCGA-EW-A1J5-01Breastbreast invasive carcinomaFemale<65I/IIChemotherapyadriamycinSD
FRMD4BinsertionNonsense_Mutationnovelc.2898_2899insAAAGAGAGAGCGATGAGATCTGATCTGCTATGACAGAATCAGTGTGGGp.Ile966_Gly967insLysGluArgAlaMetArgSerAspLeuLeuTerGlnAsnGlnCysGlyp.I966_G967insKERAMRSDLL*QNQCGQ9Y2L6protein_codingTCGA-3C-AAAU-01Breastbreast invasive carcinomaFemale<65I/IIChemotherapyzoladexSD
FRMD4BinsertionFrame_Shift_Insnovelc.2175_2176insAACCCTTCCTACCGGTCCTCAGCCCACTATGGATATGAGCGp.Leu726AsnfsTer32p.L726Nfs*32Q9Y2L6protein_codingTCGA-A8-A08H-01Breastbreast invasive carcinomaFemale>=65I/IIUnknownUnknownSD
FRMD4BinsertionFrame_Shift_Insnovelc.2771_2772insCCTGGGATTATGCAp.Arg924SerfsTer46p.R924Sfs*46Q9Y2L6protein_codingTCGA-AN-A0FV-01Breastbreast invasive carcinomaFemale<65I/IIUnknownUnknownSD
FRMD4BinsertionNonsense_Mutationnovelc.3000_3001insTAGGCACTAACGTAACTGTAGGGTCTGCCCACATGTTGAAGTp.Ile1000_Ser1001insTerp.I1000_S1001ins*Q9Y2L6protein_codingTCGA-AN-A0FX-01Breastbreast invasive carcinomaFemale<65I/IIUnknownUnknownSD
FRMD4BinsertionIn_Frame_Insnovelc.1204_1205insGGAGTATGAGACCAGTAATGGCAGTAAp.Ile401_Met402insArgSerMetArgProValMetAlaValp.I401_M402insRSMRPVMAVQ9Y2L6protein_codingTCGA-E2-A1LL-01Breastbreast invasive carcinomaFemale>=65III/IVChemotherapydocetaxelPD
Page: 1 2 3 4 5 6 7 8 9 

Top

Related drugs of malignant transformation related genes

check buttonIdentification of chemicals and drugs interact with genes involved in malignant transfromation
(DGIdb 4.0)
Entrez IDSymbolCategoryInteraction TypesDrug Claim NameDrug NamePMIDs
Page: 1